Job Satisfaction Analysis Report for ABC Company - Research Methods
VerifiedAdded on 2023/06/09
|23
|5042
|467
Report
AI Summary
This report presents a job satisfaction analysis conducted at ABC Private Limited, involving 30 employees. The study investigates the relationship between job satisfaction and various factors such as job benefits, employee age, hierarchical positions, and training programs. Data was collected through online surveys and analyzed using descriptive statistics, exploratory factor analysis, and reliability tests. The results indicate no significant correlation between job satisfaction and the tested factors. The report includes detailed percentage distributions of employee opinions on aspects like sense of accomplishment, feeling valued, pay appropriateness, benefits, training, and respect. It also highlights concerns regarding the recommendation of ABC as an employer. The research aimed to provide insights into the factors influencing employee contentment within the company's working environment.
1
Program title:
Module title:
Module code:
Name of the Online Tutor:
Student name:
Student number:
Date:
Word count:
Program title:
Module title:
Module code:
Name of the Online Tutor:
Student name:
Student number:
Date:
Word count:
Paraphrase This Document
Need a fresh take? Get an instant paraphrase of this document with our AI Paraphraser
2
Table of Contents
Task 1: Job Satisfaction in ABC Company.....................................................................................................3
Abstract.......................................................................................................................................................3
Introduction.................................................................................................................................................3
Hypotheses..................................................................................................................................................4
Materials and Method.................................................................................................................................4
Data Analysis and Results............................................................................................................................5
Reliability................................................................................................................................................5
Descriptive Analysis....................................................................................................................................5
Exploratory Factor Analysis..................................................................................................................12
Inferential Analysis...............................................................................................................................14
Discussion and Conclusion........................................................................................................................15
Task 2........................................................................................................................................................16
Task 3........................................................................................................................................................18
Reference...................................................................................................................................................19
Appendix: Task 1.......................................................................................................................................20
3
Task 1: Job Satisfaction in ABC Company
Abstract
Satisfaction of the professionals is one of the most complex areas that managers face in
relation to their employees. Many studies have shown an exceptionally important impact on the
work of inspiring accomplishment for workers when the level of profitability from inspiration
seems immense. The critical section that was analyzed in the study was the job satisfaction
section, with the weight of the company monetary benefits, the employer-employee mutual
understanding interface, some of the seniority related matters and the weight of the job
implementation. The current illustration was adopted from a private-funded company with 30
employees of ABC Private Limited. The results show that there was no important link between
three proven developments. The results also show that there was no significant link between
work satisfaction and occupational factors.
Introduction
The social research papers on human behavior suggested that accomplishment in the
workplace could be achieved by four remarkable considerations; financial benefits at work, the
extent to which respect is considered reasonable, the comparison with the income of others and
the non-economic performance of jobs. Measurements of these conceivable determinants were
made using a 12-parameter facet study. Using these components and some statistical factors in a
moderate number of observations (n = 30), the results of this study provide particularly
important expectations for the working environment of a company. In some previous research
studies, small critical consequences have been also found for age, occupation, education, and
unemployment.
⊘ This is a preview!⊘
Do you want full access?
Subscribe today to unlock all pages.
Trusted by 1+ million students worldwide
4
In the current research, convincing arguments and experimental pieces of evidence
explain the relationship between the company's sustainable growth with employee contentment.
This article explores this relationship, using the broad reactions of British employees of ABC
Company. The strategies used in the data analysis were to describe the relationship between the
type of compliance of individual employee and substantial disposition qualities of the employer.
The thesis strongly confirms an increasing relationship between age conformity and profession.
The association of appraised satisfaction with the organization level variable was also
investigated. The scope for industrial training and improvement are the main motivations in
representative professional decisions. This research also analyzed the relationship between the
company provided training and overall job contentment.
Hypotheses
Specifically, the following research hypotheses were addressed:
1. It was hypothesized that there was no significant positive relationship between job
satisfaction and job benefits.
2. It was hypothesized that employee benefits and the age of the employees did not have
any significant association.
3. The effects when the job benefits of an employee were not in line with the hierarchical
positions in ABC Company, was statistically significant.
4. Job satisfaction and training programs were not significantly correlated for the
employees of ABC.
Materials and Method
For purpose of the research, management of ABC private limited was contacted for an
interview with their employees. The modality of the online interview of interested candidates
Paraphrase This Document
Need a fresh take? Get an instant paraphrase of this document with our AI Paraphraser
5
was conveyed to the company. The online survey questionnaire was sent to the management of
the company for their 150 employees, and filled up forms were collected manually from ABC
Pvt. Ltd. by the scholar. In addition to demographic records; professional data was collected
from the interested employees. Threatened members were contacted over phone and interested
participants were also included in the inspection work. The ethical form was signed by the
subjects, where the University ethical committee approved the method. After following up with
the management of ABC, overall filled survey form of 30 participants was acquired. The average
employment years was calculated at 4.5 years (SD = 3.5 years). The mean age of the employees
was 35.6 years (SD = 12.41 years). Some missing data from the filled up questionnaire were
found, and they were replaced by the average of the responses from the employees. Due to a
small number of samples, collected data was not downsized because of the missing values.
Data Analysis and Results
Reliability
The reliability of the questionnaire was measured for cross-analysis of the impact factor
of the answers. The Cronbach’s Alpha was 0.29 for 14 items reliability analysis (Table 3 in
Appendix). For obtaining significantly larger reliability, items were discarded from the analysis.
Finally, the Cronbach’s Alpha was improvised to 0.53 with 10 items (Table 4 of Appendix). The
factor analysis with the reliable 10 items was conducted for the assemblage of the familiar
factors.
Descriptive Analysis
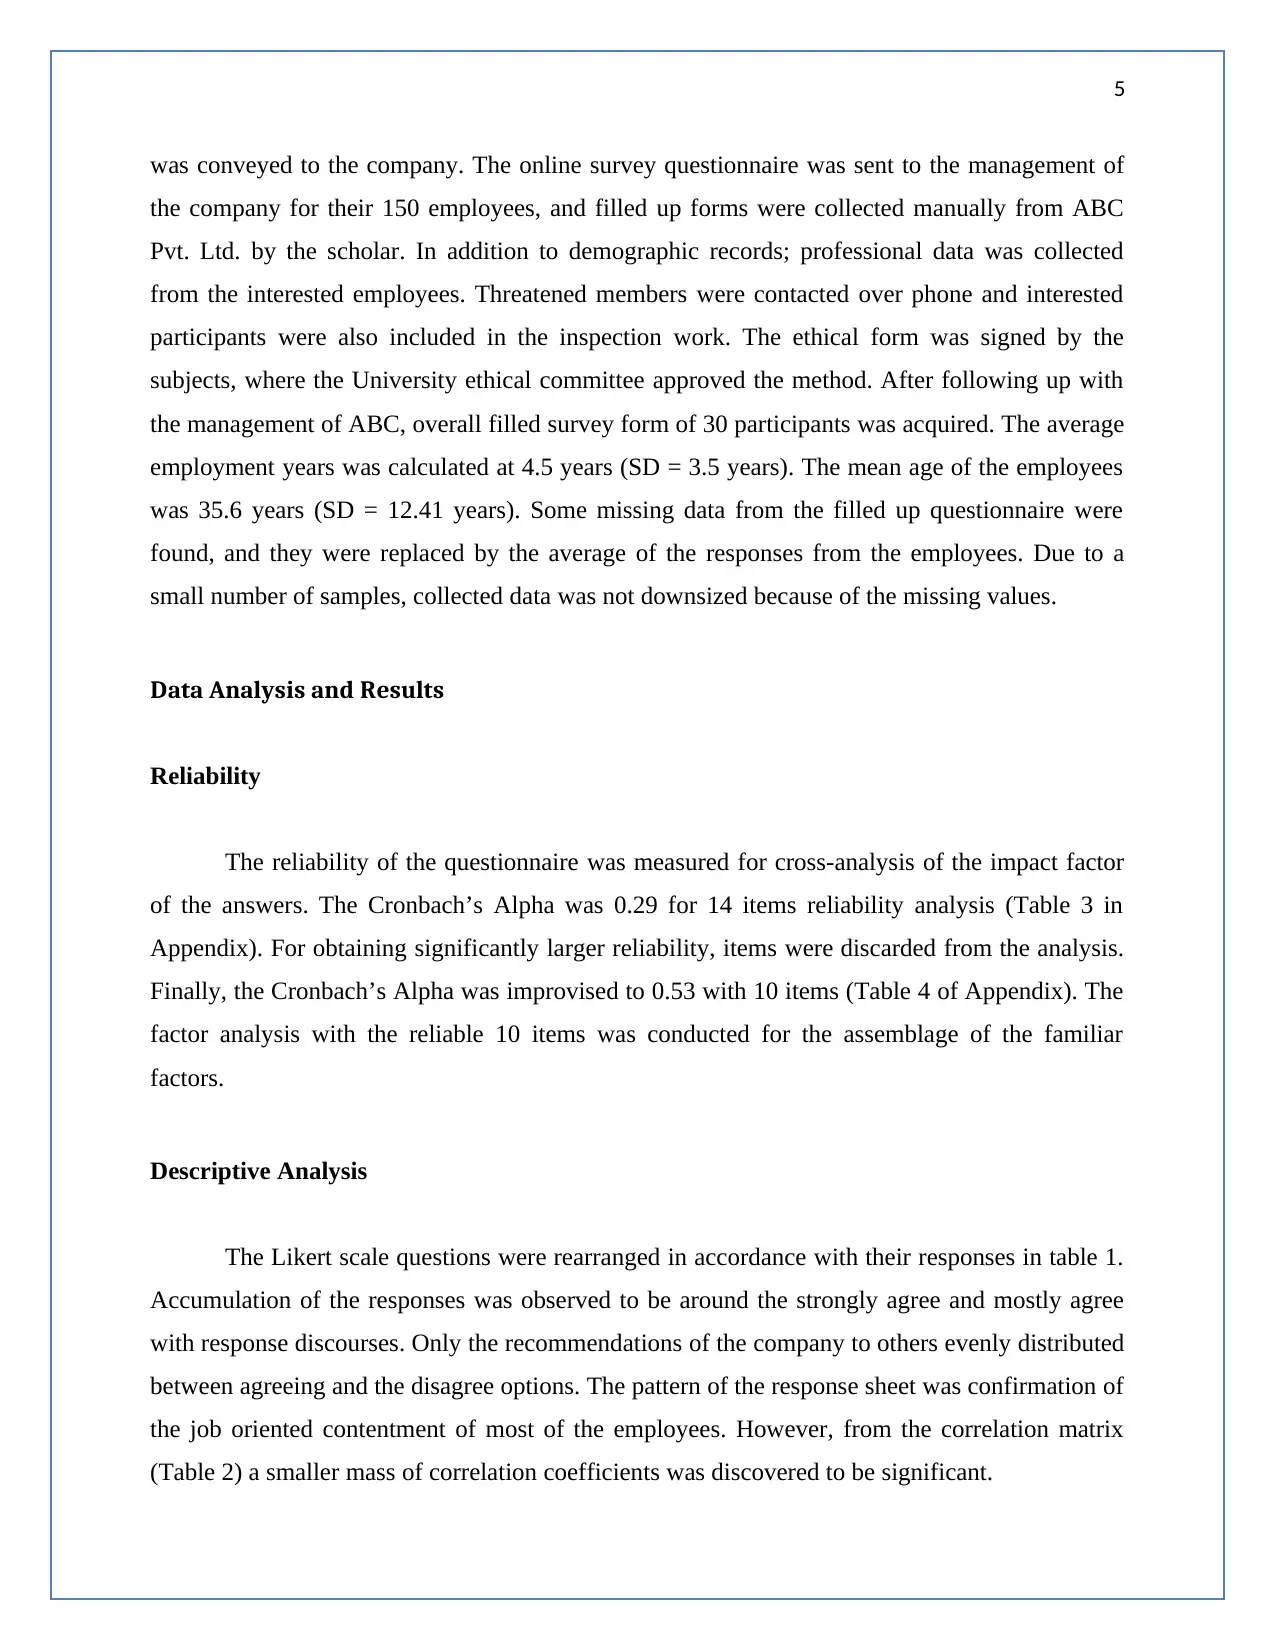
The Likert scale questions were rearranged in accordance with their responses in table 1.
Accumulation of the responses was observed to be around the strongly agree and mostly agree
with response discourses. Only the recommendations of the company to others evenly distributed
between agreeing and the disagree options. The pattern of the response sheet was confirmation of
the job oriented contentment of most of the employees. However, from the correlation matrix
(Table 2) a smaller mass of correlation coefficients was discovered to be significant.
was conveyed to the company. The online survey questionnaire was sent to the management of
the company for their 150 employees, and filled up forms were collected manually from ABC
Pvt. Ltd. by the scholar. In addition to demographic records; professional data was collected
from the interested employees. Threatened members were contacted over phone and interested
participants were also included in the inspection work. The ethical form was signed by the
subjects, where the University ethical committee approved the method. After following up with
the management of ABC, overall filled survey form of 30 participants was acquired. The average
employment years was calculated at 4.5 years (SD = 3.5 years). The mean age of the employees
was 35.6 years (SD = 12.41 years). Some missing data from the filled up questionnaire were
found, and they were replaced by the average of the responses from the employees. Due to a
small number of samples, collected data was not downsized because of the missing values.
Data Analysis and Results
Reliability
The reliability of the questionnaire was measured for cross-analysis of the impact factor
of the answers. The Cronbach’s Alpha was 0.29 for 14 items reliability analysis (Table 3 in
Appendix). For obtaining significantly larger reliability, items were discarded from the analysis.
Finally, the Cronbach’s Alpha was improvised to 0.53 with 10 items (Table 4 of Appendix). The
factor analysis with the reliable 10 items was conducted for the assemblage of the familiar
factors.
Descriptive Analysis
The Likert scale questions were rearranged in accordance with their responses in table 1.
Accumulation of the responses was observed to be around the strongly agree and mostly agree
with response discourses. Only the recommendations of the company to others evenly distributed
between agreeing and the disagree options. The pattern of the response sheet was confirmation of
the job oriented contentment of most of the employees. However, from the correlation matrix
(Table 2) a smaller mass of correlation coefficients was discovered to be significant.
6
Table 1: Percentage opinion of employees
Strongly agree Mostly Agreee Mostly disagree Strongly Disagreee Don't know
0.0%
10.0%
20.0%
30.0%
40.0%
50.0%
60.0%
50.0%
23.3%
10.0% 10.0% 6.7%
Sense of accomplishment from work
Figure 1: Percentage Distribution of opinions on accomplishment of work
Table 1: Percentage opinion of employees
Strongly agree Mostly Agreee Mostly disagree Strongly Disagreee Don't know
0.0%
10.0%
20.0%
30.0%
40.0%
50.0%
60.0%
50.0%
23.3%
10.0% 10.0% 6.7%
Sense of accomplishment from work
Figure 1: Percentage Distribution of opinions on accomplishment of work
⊘ This is a preview!⊘
Do you want full access?
Subscribe today to unlock all pages.
Trusted by 1+ million students worldwide
7
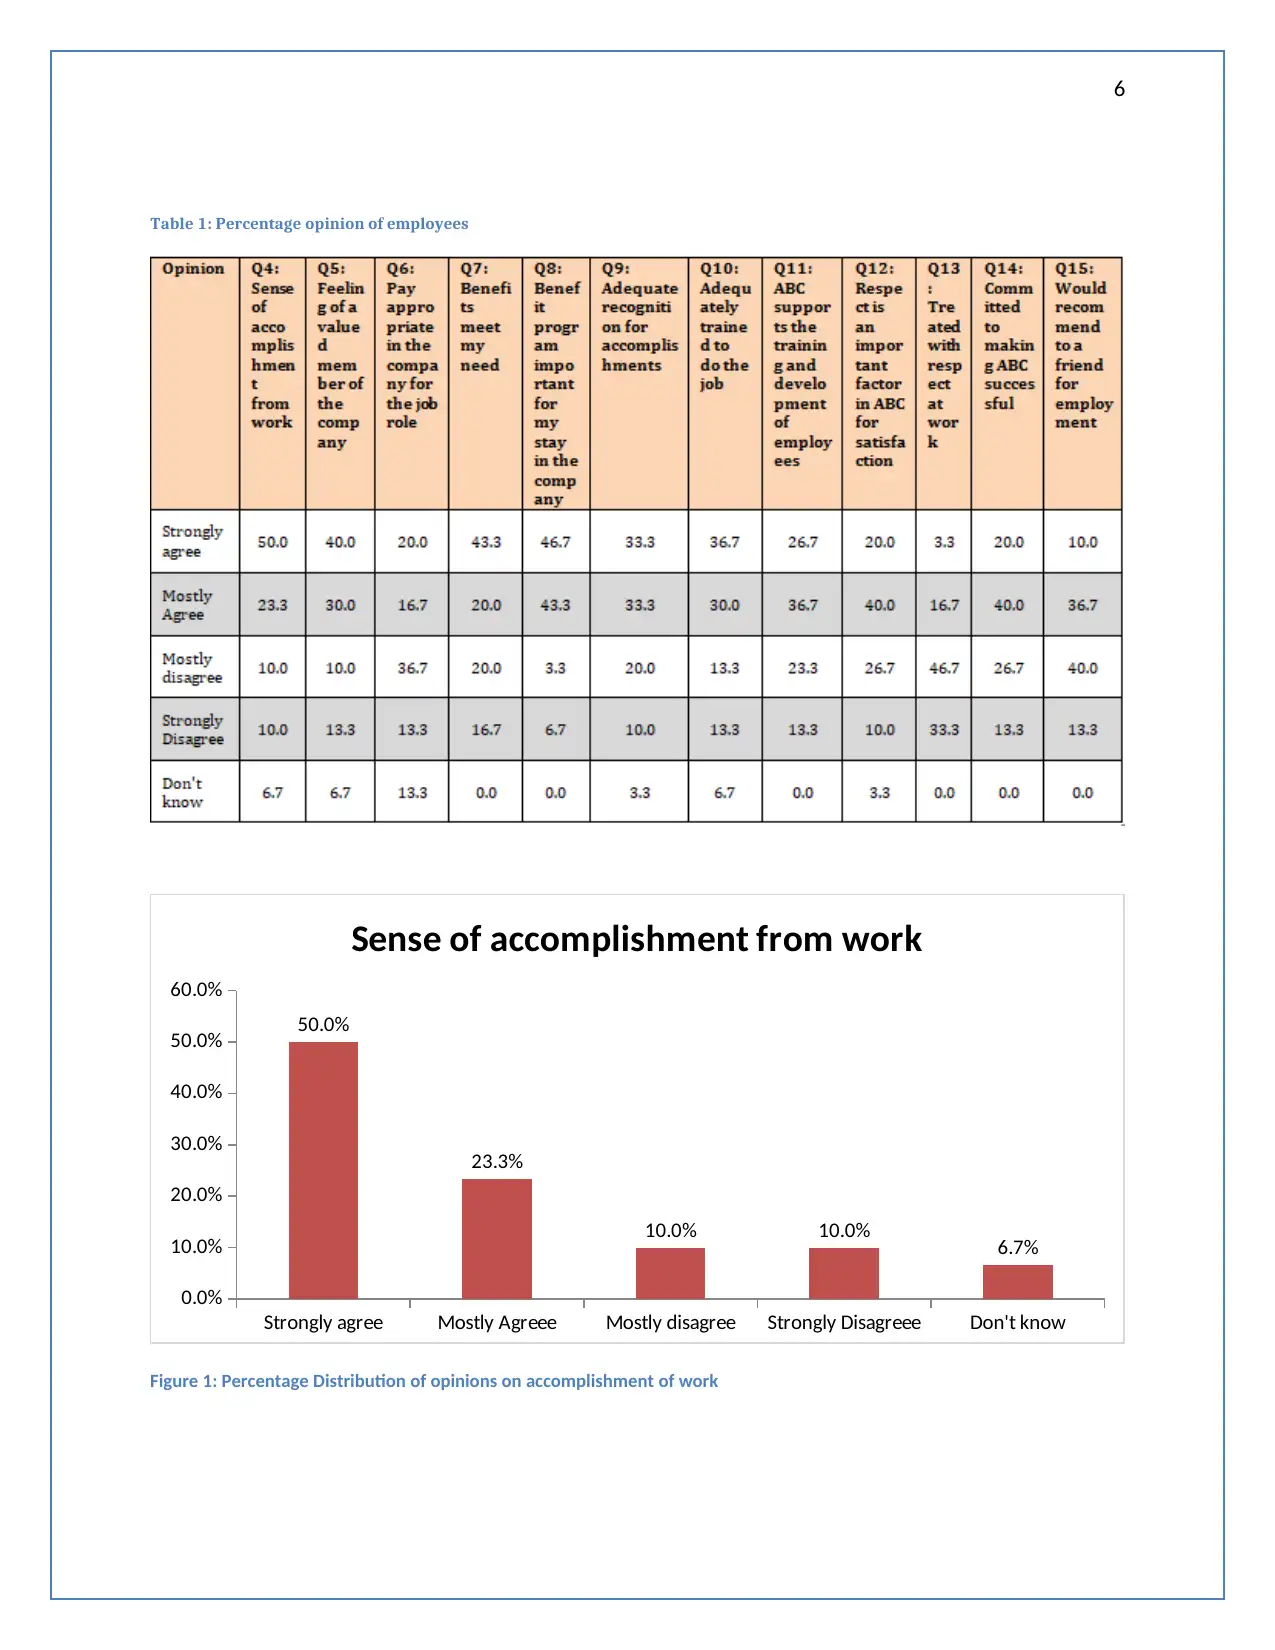
Figure 1 indicated that 73.3% employees agreed to the feeling of achievement from their work in
the company.
Strongly agree Mostly Agreee Mostly disagree Strongly Disagreee Don't know
0.0%
5.0%
10.0%
15.0%
20.0%
25.0%
30.0%
35.0%
40.0%
45.0%
40.0%
30.0%
10.0%
13.3%
6.7%
Feeling of valued member of the company
Figure 2: Percentage Distribution of opinions on valued member
Most of the workers felt that they were important part of the organization.
Strongly agree Mostly Agreee Mostly disagree Strongly Disagreee Don't know
0.0%
5.0%
10.0%
15.0%
20.0%
25.0%
30.0%
35.0%
40.0%
20.0%
16.7%
36.7%
13.3% 13.3%
Pay appropriate in company for job role
Figure 3: Percentage Distribution of opinions on job role
Paraphrase This Document
Need a fresh take? Get an instant paraphrase of this document with our AI Paraphraser
8
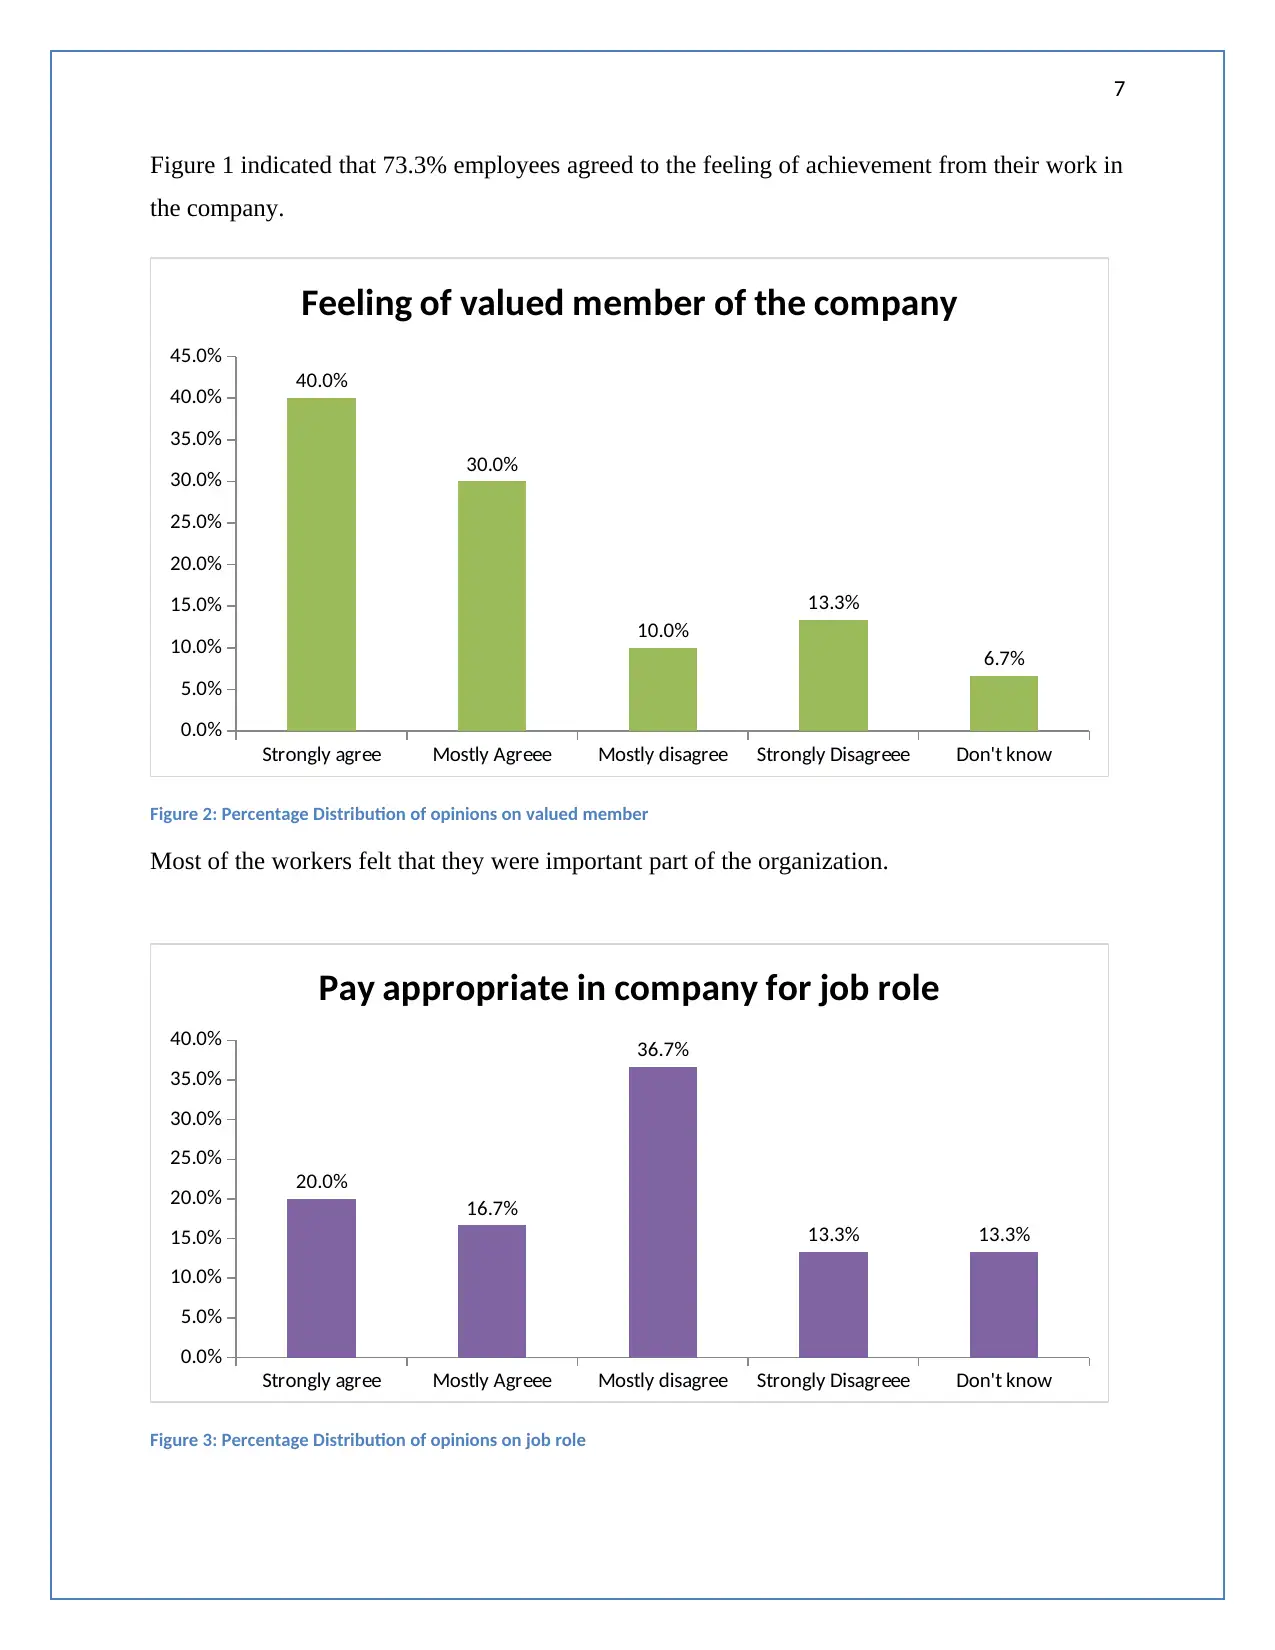
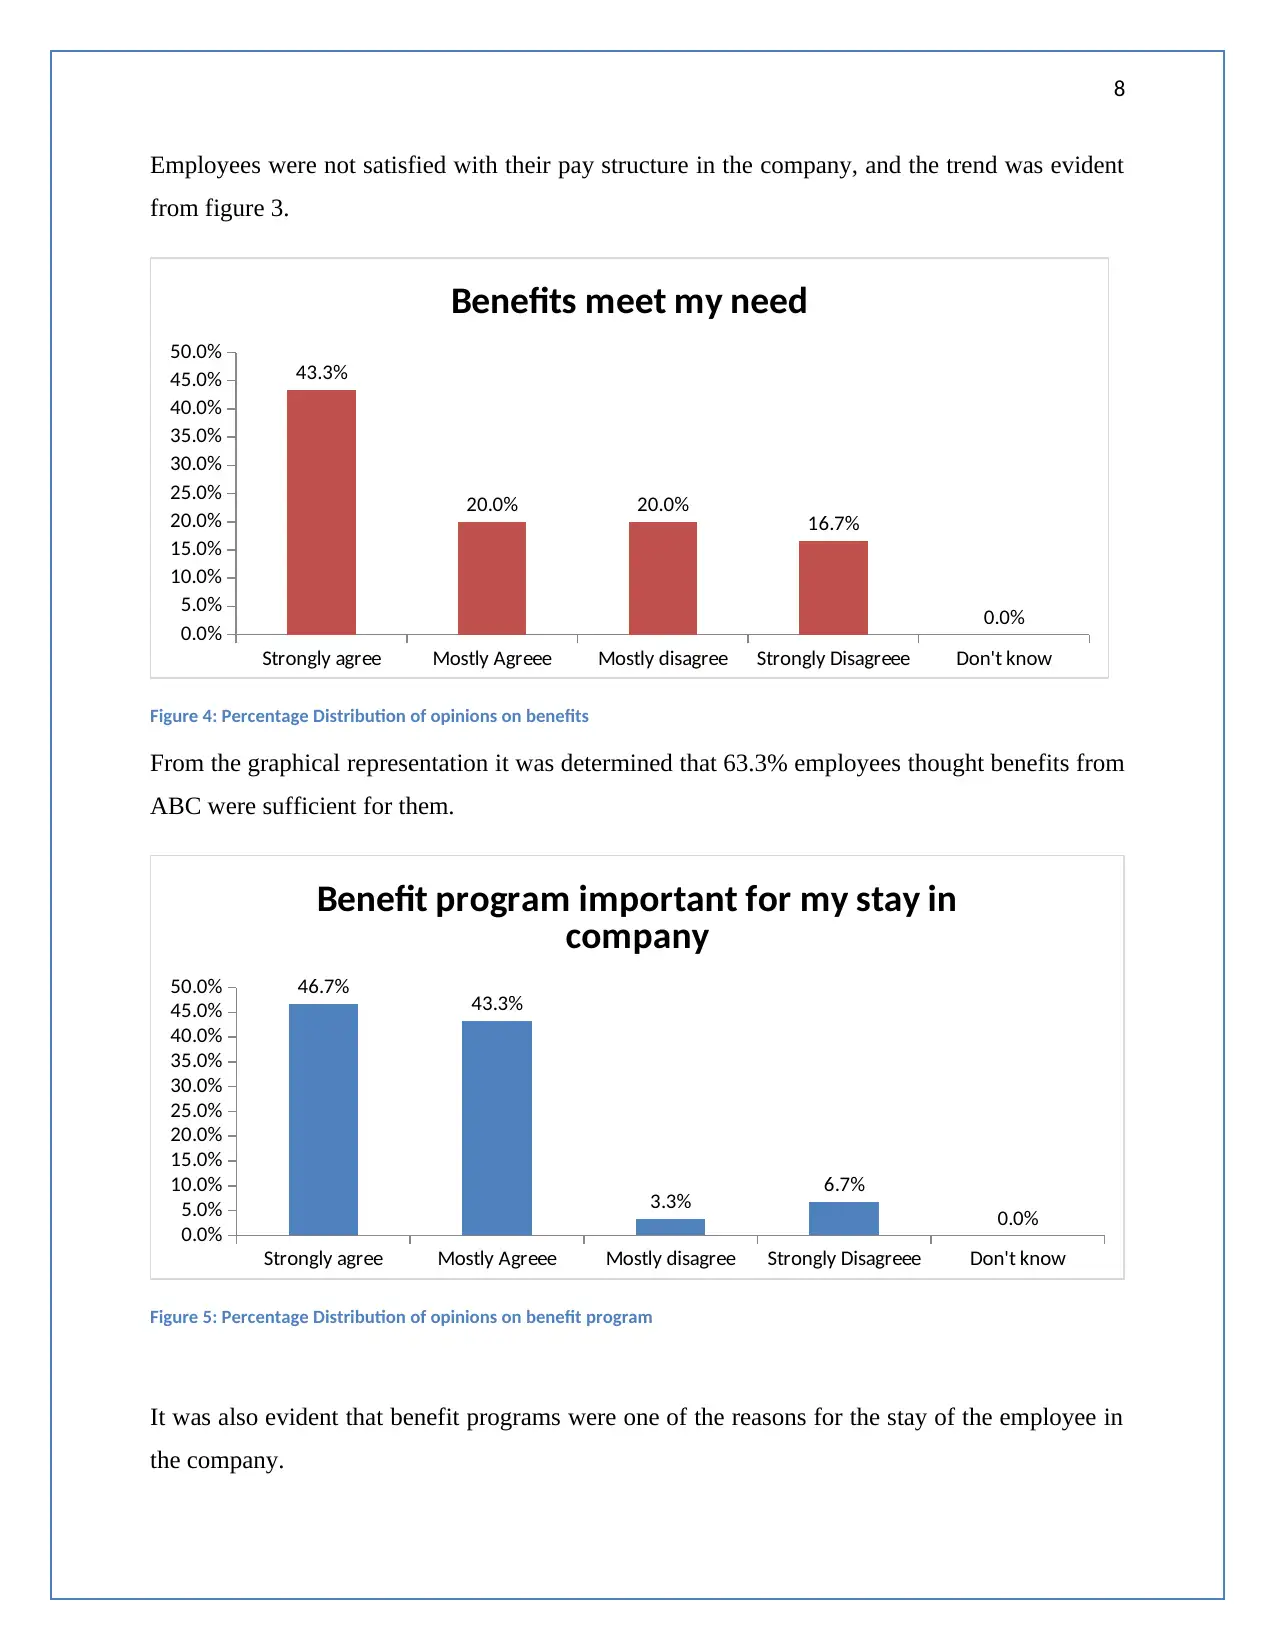
Employees were not satisfied with their pay structure in the company, and the trend was evident
from figure 3.
Strongly agree Mostly Agreee Mostly disagree Strongly Disagreee Don't know
0.0%
5.0%
10.0%
15.0%
20.0%
25.0%
30.0%
35.0%
40.0%
45.0%
50.0%
43.3%
20.0% 20.0% 16.7%
0.0%
Benefits meet my need
Figure 4: Percentage Distribution of opinions on benefits
From the graphical representation it was determined that 63.3% employees thought benefits from
ABC were sufficient for them.
Strongly agree Mostly Agreee Mostly disagree Strongly Disagreee Don't know
0.0%
5.0%
10.0%
15.0%
20.0%
25.0%
30.0%
35.0%
40.0%
45.0%
50.0% 46.7% 43.3%
3.3% 6.7%
0.0%
Benefit program important for my stay in
company
Figure 5: Percentage Distribution of opinions on benefit program
It was also evident that benefit programs were one of the reasons for the stay of the employee in
the company.
9
Strongly agree Mostly Agreee Mostly disagree Strongly Disagreee Don't know
0.0%
5.0%
10.0%
15.0%
20.0%
25.0%
30.0%
35.0% 33.3% 33.3%
20.0%
10.0%
3.3%
Adequate recognition for accomplishments
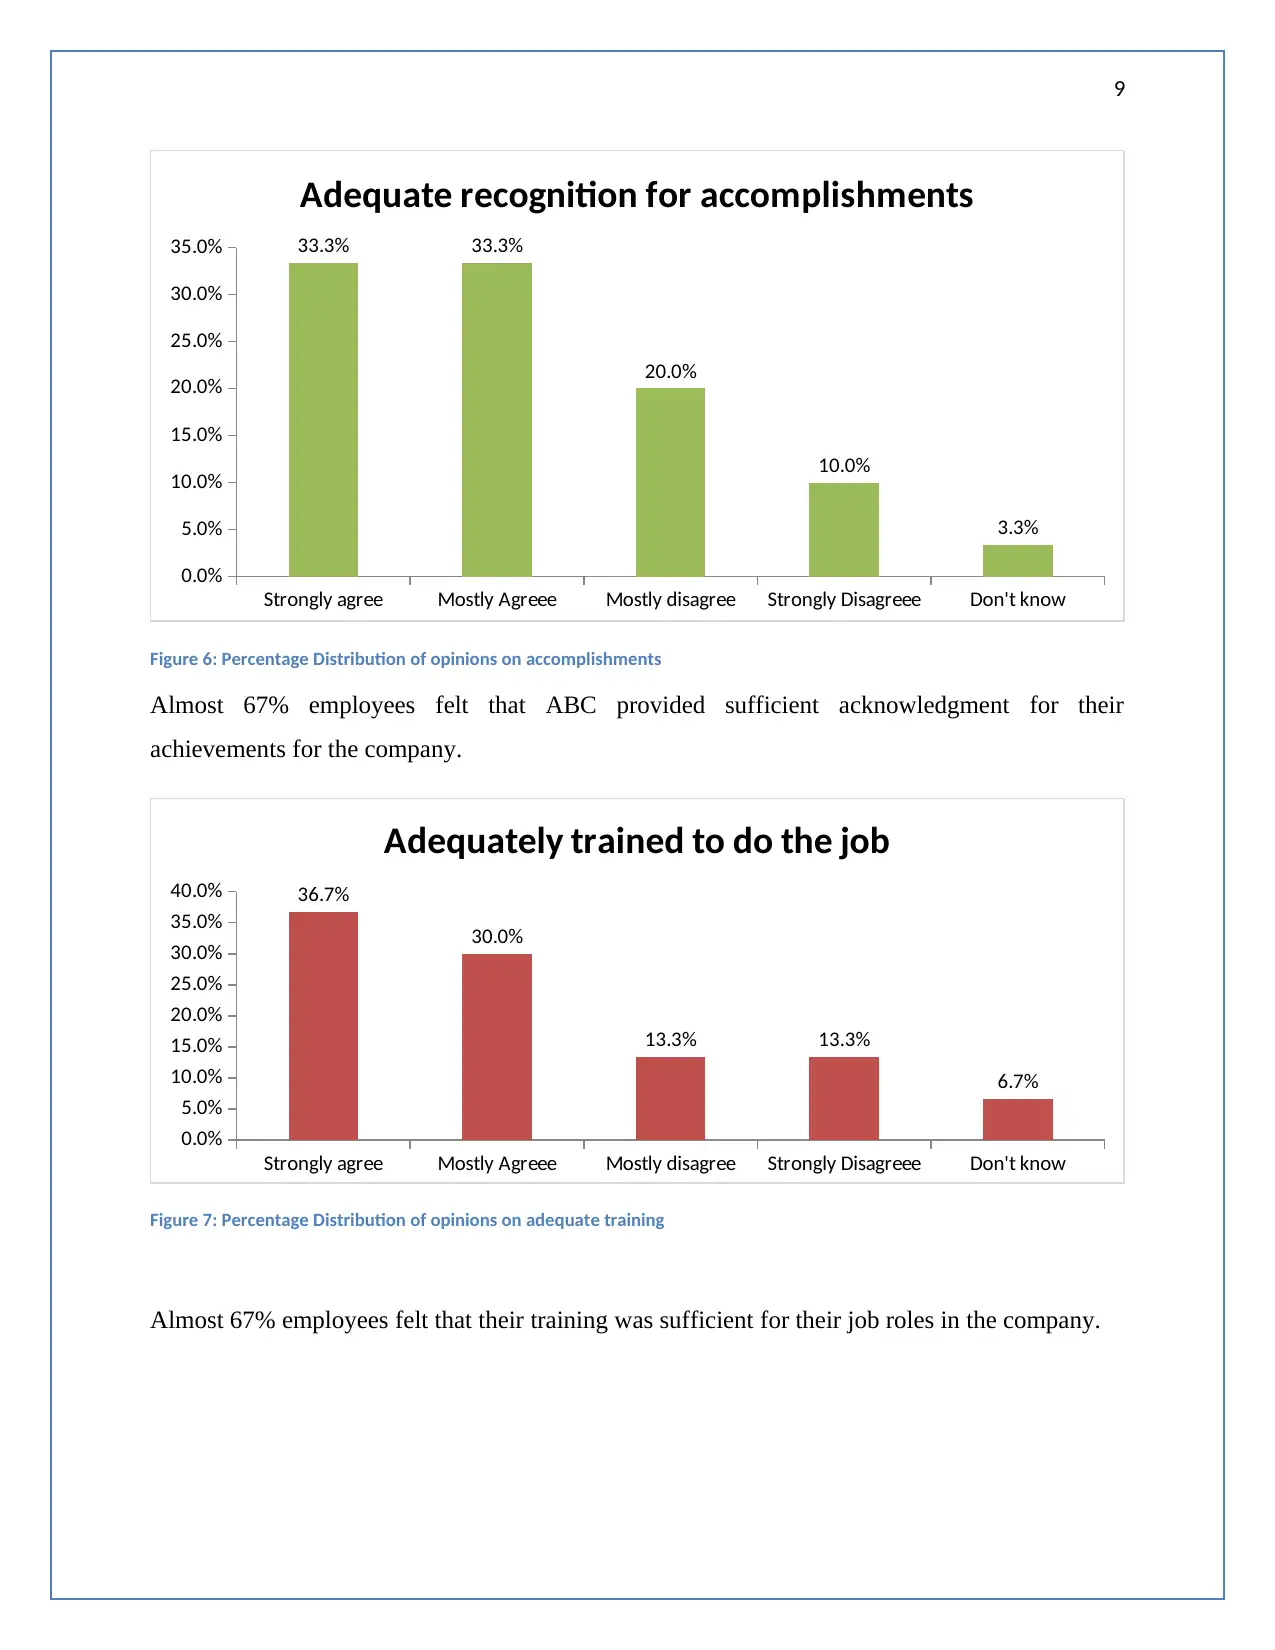
Figure 6: Percentage Distribution of opinions on accomplishments
Almost 67% employees felt that ABC provided sufficient acknowledgment for their
achievements for the company.
Strongly agree Mostly Agreee Mostly disagree Strongly Disagreee Don't know
0.0%
5.0%
10.0%
15.0%
20.0%
25.0%
30.0%
35.0%
40.0% 36.7%
30.0%
13.3% 13.3%
6.7%
Adequately trained to do the job
Figure 7: Percentage Distribution of opinions on adequate training
Almost 67% employees felt that their training was sufficient for their job roles in the company.
Strongly agree Mostly Agreee Mostly disagree Strongly Disagreee Don't know
0.0%
5.0%
10.0%
15.0%
20.0%
25.0%
30.0%
35.0% 33.3% 33.3%
20.0%
10.0%
3.3%
Adequate recognition for accomplishments
Figure 6: Percentage Distribution of opinions on accomplishments
Almost 67% employees felt that ABC provided sufficient acknowledgment for their
achievements for the company.
Strongly agree Mostly Agreee Mostly disagree Strongly Disagreee Don't know
0.0%
5.0%
10.0%
15.0%
20.0%
25.0%
30.0%
35.0%
40.0% 36.7%
30.0%
13.3% 13.3%
6.7%
Adequately trained to do the job
Figure 7: Percentage Distribution of opinions on adequate training
Almost 67% employees felt that their training was sufficient for their job roles in the company.
⊘ This is a preview!⊘
Do you want full access?
Subscribe today to unlock all pages.
Trusted by 1+ million students worldwide
10
Strongly agree Mostly Agreee Mostly disagree Strongly Disagreee Don't know
0.0%
5.0%
10.0%
15.0%
20.0%
25.0%
30.0%
35.0%
40.0%
26.7%
36.7%
23.3%
13.3%
0.0%
ABC supports training and development of
employees
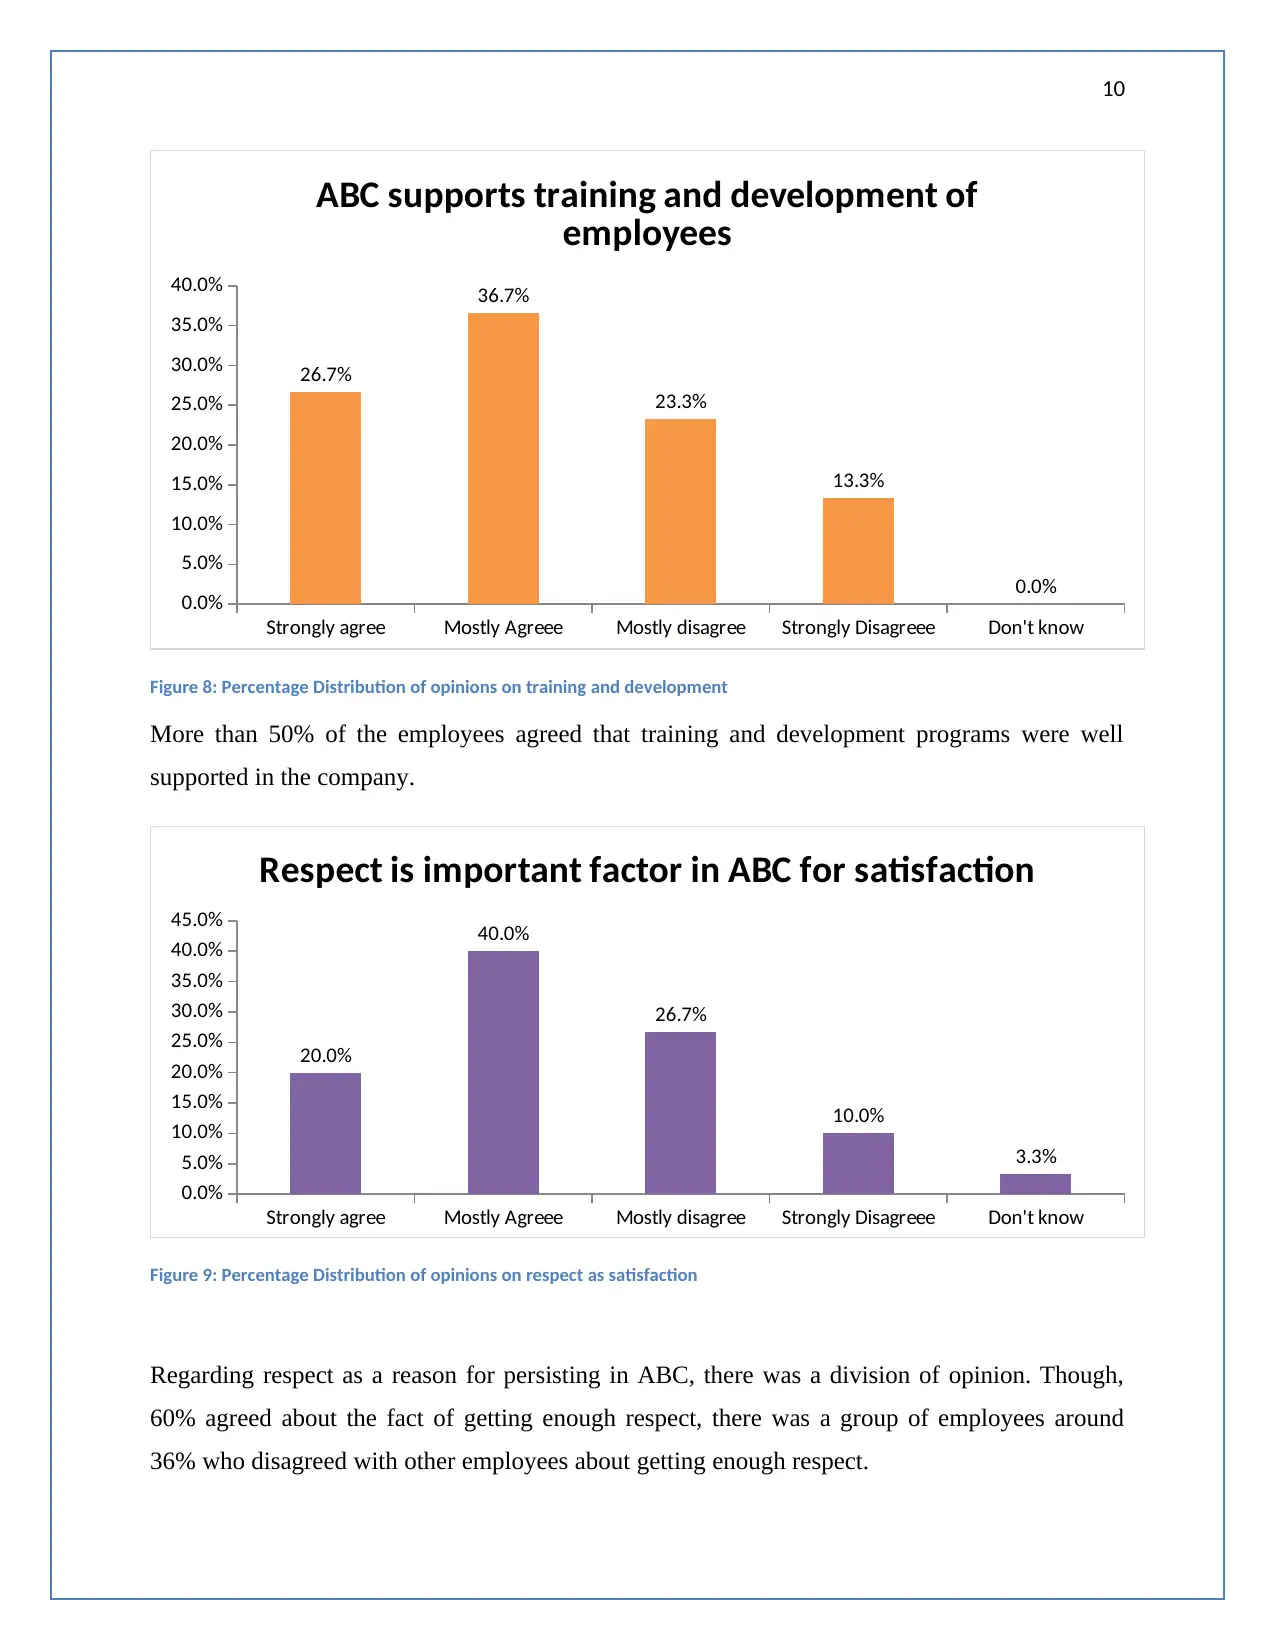
Figure 8: Percentage Distribution of opinions on training and development
More than 50% of the employees agreed that training and development programs were well
supported in the company.
Strongly agree Mostly Agreee Mostly disagree Strongly Disagreee Don't know
0.0%
5.0%
10.0%
15.0%
20.0%
25.0%
30.0%
35.0%
40.0%
45.0%
20.0%
40.0%
26.7%
10.0%
3.3%
Respect is important factor in ABC for satisfaction
Figure 9: Percentage Distribution of opinions on respect as satisfaction
Regarding respect as a reason for persisting in ABC, there was a division of opinion. Though,
60% agreed about the fact of getting enough respect, there was a group of employees around
36% who disagreed with other employees about getting enough respect.
Strongly agree Mostly Agreee Mostly disagree Strongly Disagreee Don't know
0.0%
5.0%
10.0%
15.0%
20.0%
25.0%
30.0%
35.0%
40.0%
26.7%
36.7%
23.3%
13.3%
0.0%
ABC supports training and development of
employees
Figure 8: Percentage Distribution of opinions on training and development
More than 50% of the employees agreed that training and development programs were well
supported in the company.
Strongly agree Mostly Agreee Mostly disagree Strongly Disagreee Don't know
0.0%
5.0%
10.0%
15.0%
20.0%
25.0%
30.0%
35.0%
40.0%
45.0%
20.0%
40.0%
26.7%
10.0%
3.3%
Respect is important factor in ABC for satisfaction
Figure 9: Percentage Distribution of opinions on respect as satisfaction
Regarding respect as a reason for persisting in ABC, there was a division of opinion. Though,
60% agreed about the fact of getting enough respect, there was a group of employees around
36% who disagreed with other employees about getting enough respect.
Paraphrase This Document
Need a fresh take? Get an instant paraphrase of this document with our AI Paraphraser
11
Strongly agree Mostly Agreee Mostly disagree Strongly Disagreee Don't know
0.0%
5.0%
10.0%
15.0%
20.0%
25.0%
30.0%
35.0%
40.0%
45.0%
50.0%
3.3%
16.7%
46.7%
33.3%
0.0%
Treated with respect at work
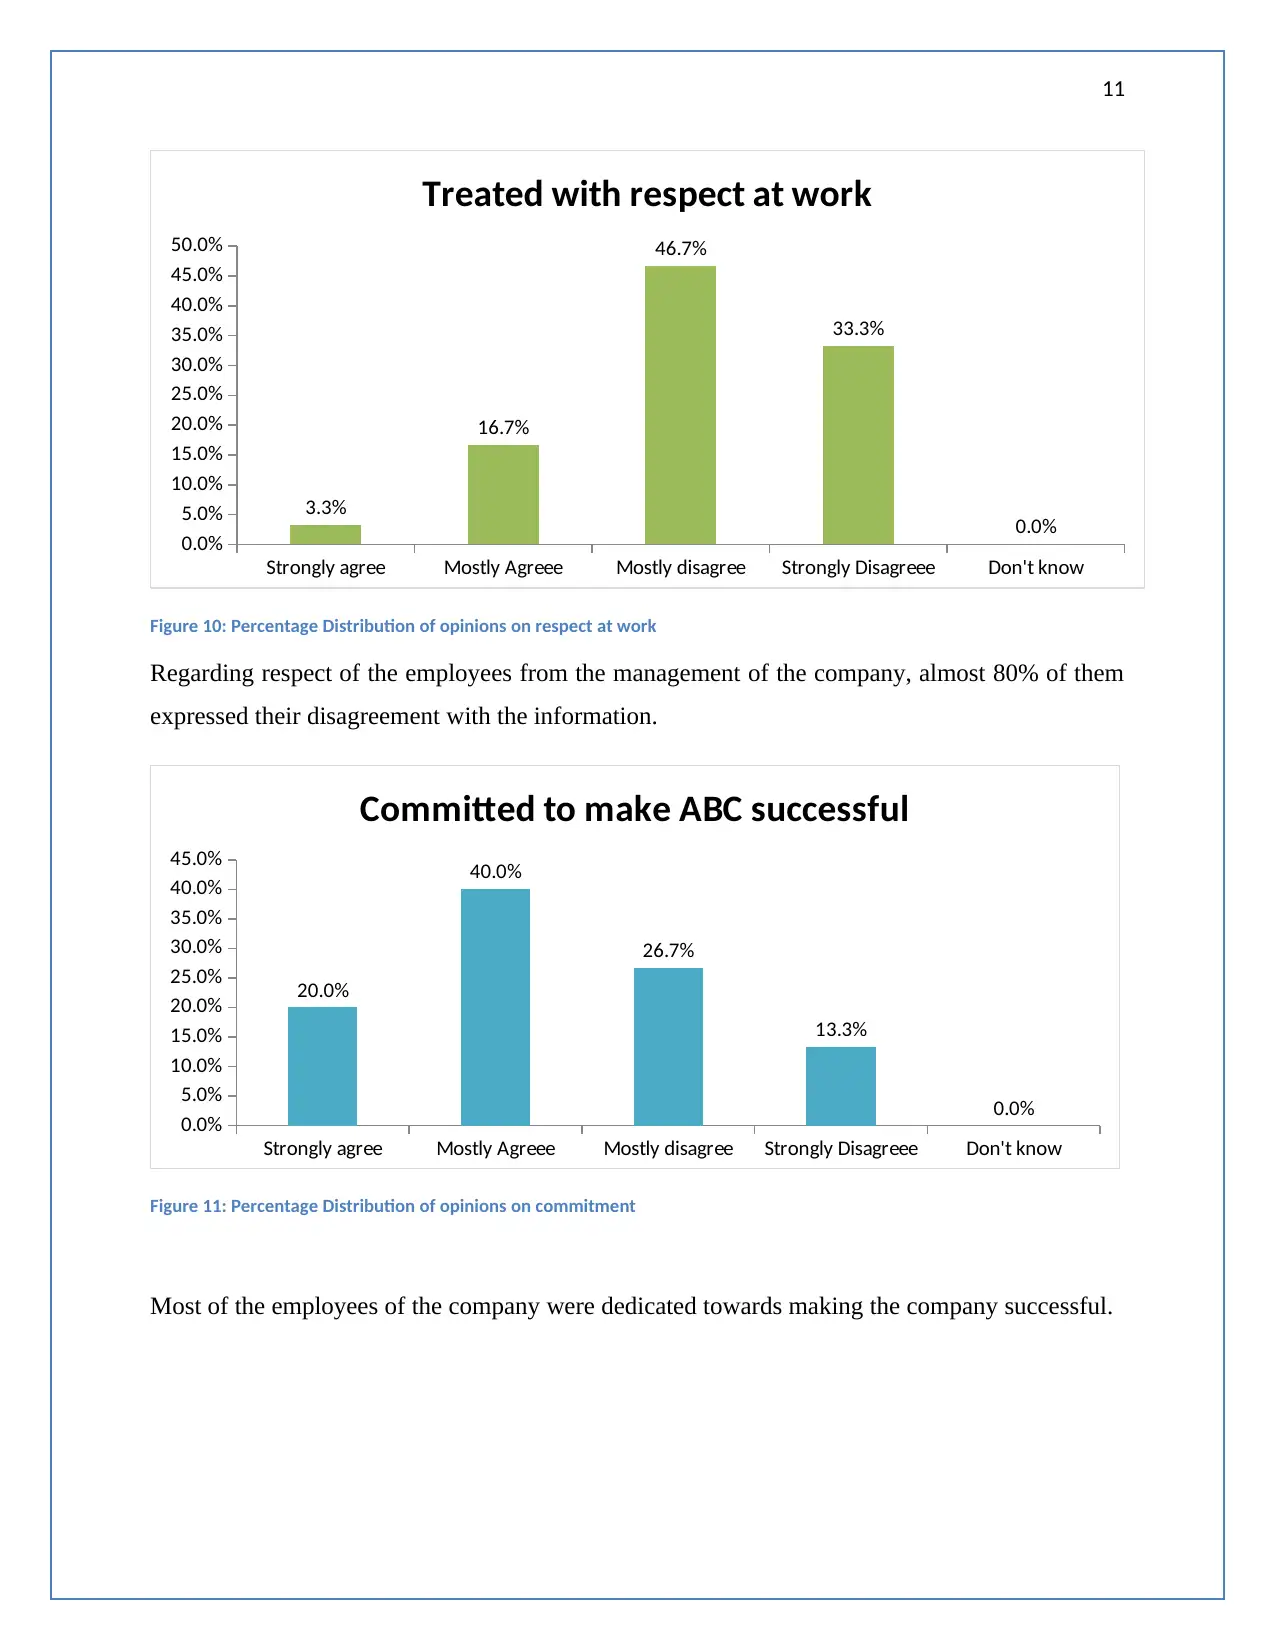
Figure 10: Percentage Distribution of opinions on respect at work
Regarding respect of the employees from the management of the company, almost 80% of them
expressed their disagreement with the information.
Strongly agree Mostly Agreee Mostly disagree Strongly Disagreee Don't know
0.0%
5.0%
10.0%
15.0%
20.0%
25.0%
30.0%
35.0%
40.0%
45.0%
20.0%
40.0%
26.7%
13.3%
0.0%
Committed to make ABC successful
Figure 11: Percentage Distribution of opinions on commitment
Most of the employees of the company were dedicated towards making the company successful.
Strongly agree Mostly Agreee Mostly disagree Strongly Disagreee Don't know
0.0%
5.0%
10.0%
15.0%
20.0%
25.0%
30.0%
35.0%
40.0%
45.0%
50.0%
3.3%
16.7%
46.7%
33.3%
0.0%
Treated with respect at work
Figure 10: Percentage Distribution of opinions on respect at work
Regarding respect of the employees from the management of the company, almost 80% of them
expressed their disagreement with the information.
Strongly agree Mostly Agreee Mostly disagree Strongly Disagreee Don't know
0.0%
5.0%
10.0%
15.0%
20.0%
25.0%
30.0%
35.0%
40.0%
45.0%
20.0%
40.0%
26.7%
13.3%
0.0%
Committed to make ABC successful
Figure 11: Percentage Distribution of opinions on commitment
Most of the employees of the company were dedicated towards making the company successful.
12
Strongly agree Mostly Agreee Mostly disagree Strongly Disagreee Don't know
0.0%
5.0%
10.0%
15.0%
20.0%
25.0%
30.0%
35.0%
40.0%
45.0%
10.0%
36.7% 40.0%
13.3%
0.0%
Would recommend to a friend for employement
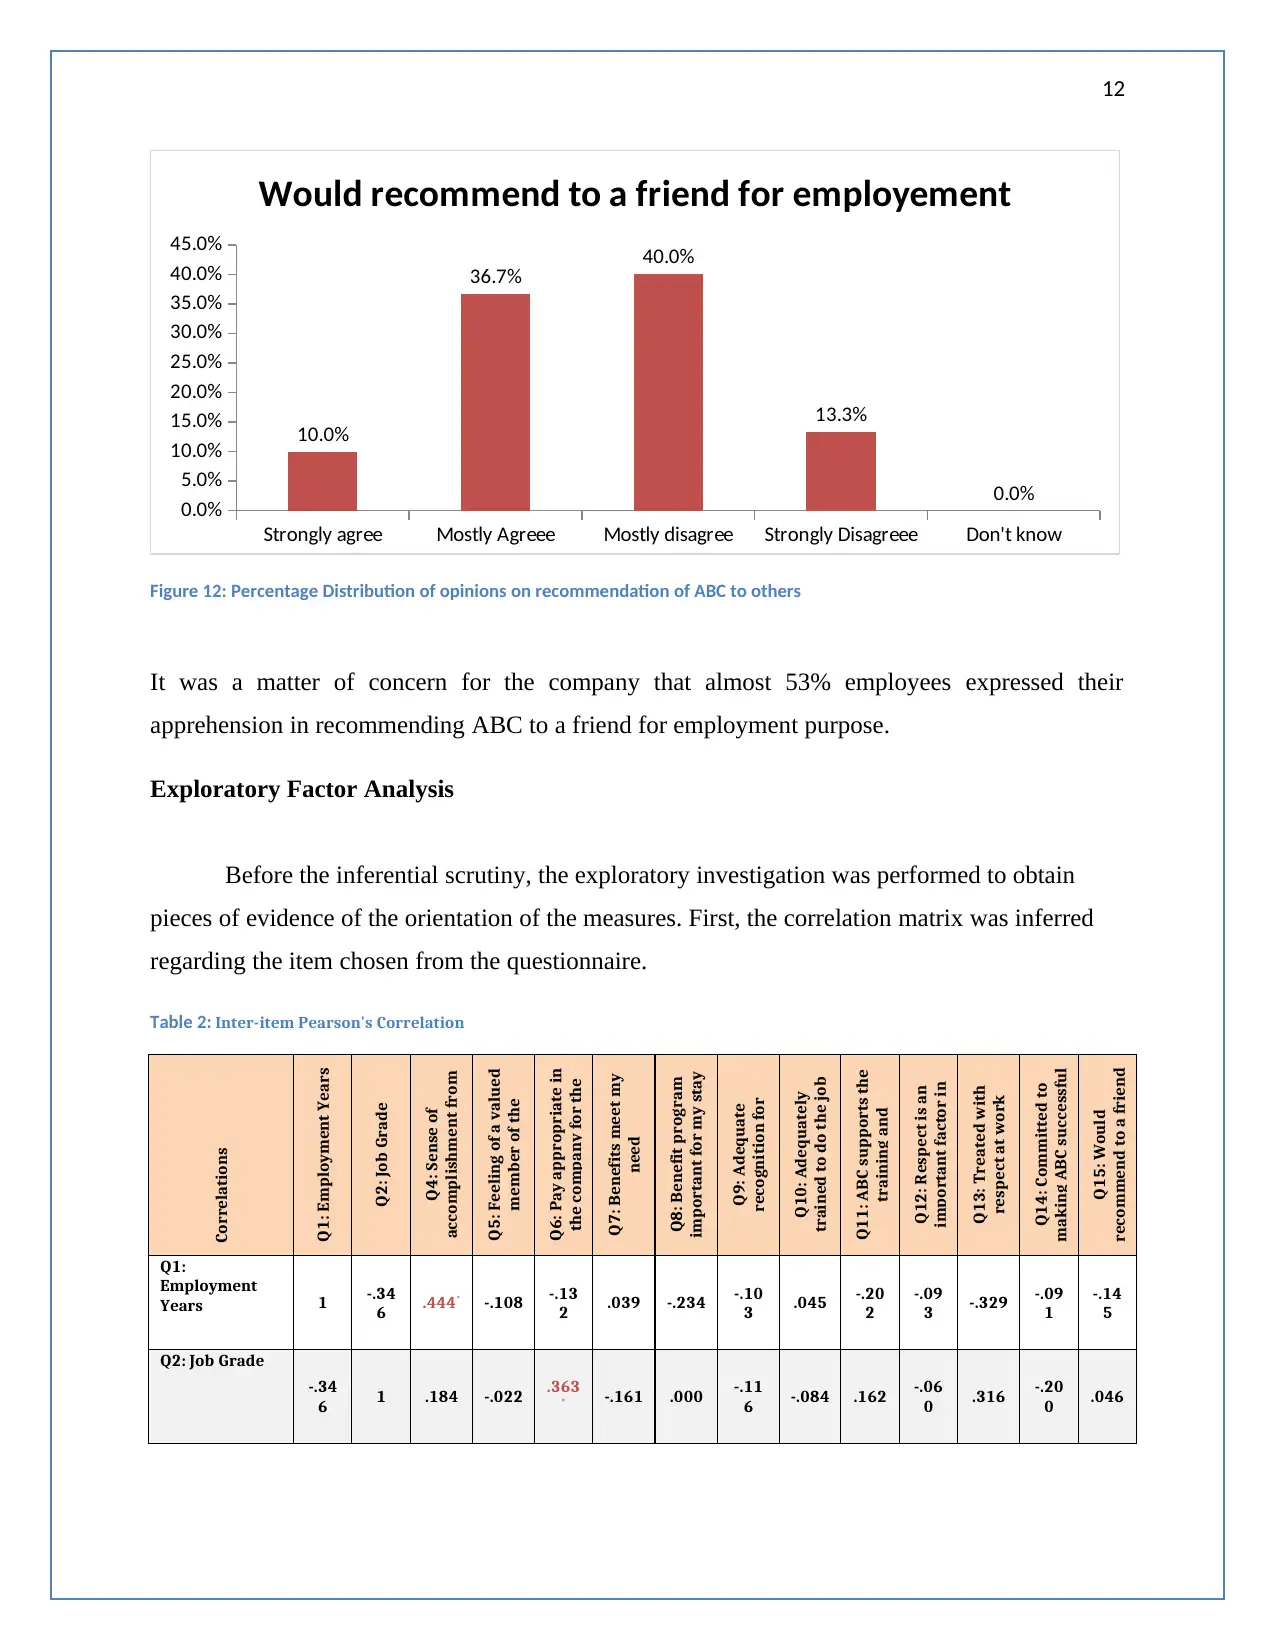
Figure 12: Percentage Distribution of opinions on recommendation of ABC to others
It was a matter of concern for the company that almost 53% employees expressed their
apprehension in recommending ABC to a friend for employment purpose.
Exploratory Factor Analysis
Before the inferential scrutiny, the exploratory investigation was performed to obtain
pieces of evidence of the orientation of the measures. First, the correlation matrix was inferred
regarding the item chosen from the questionnaire.
Table 2: Inter-item Pearson's Correlation
Correlations
Q1: Employment Years
Q2: Job Grade
Q4: Sense of
accomplishment from
work
Q5: Feeling of a valued
member of the
Q6: Pay appropriate in
the company for the
Q7: Benefits meet my
need
Q8: Benefit program
important for my stay
in the company
Q9: Adequate
recognition for
Q10: Adequately
trained to do the job
Q11: ABC supports the
training and
Q12: Respect is an
important factor in
Q13: Treated with
respect at work
Q14: Committed to
making ABC successful
Q15: Would
recommend to a friend
Q1:
Employment
Years 1 -.34
6 .444* -.108 -.13
2 .039 -.234 -.10
3 .045 -.20
2
-.09
3 -.329 -.09
1
-.14
5
Q2: Job Grade
-.34
6 1 .184 -.022 .363
* -.161 .000 -.11
6 -.084 .162 -.06
0 .316 -.20
0 .046
Strongly agree Mostly Agreee Mostly disagree Strongly Disagreee Don't know
0.0%
5.0%
10.0%
15.0%
20.0%
25.0%
30.0%
35.0%
40.0%
45.0%
10.0%
36.7% 40.0%
13.3%
0.0%
Would recommend to a friend for employement
Figure 12: Percentage Distribution of opinions on recommendation of ABC to others
It was a matter of concern for the company that almost 53% employees expressed their
apprehension in recommending ABC to a friend for employment purpose.
Exploratory Factor Analysis
Before the inferential scrutiny, the exploratory investigation was performed to obtain
pieces of evidence of the orientation of the measures. First, the correlation matrix was inferred
regarding the item chosen from the questionnaire.
Table 2: Inter-item Pearson's Correlation
Correlations
Q1: Employment Years
Q2: Job Grade
Q4: Sense of
accomplishment from
work
Q5: Feeling of a valued
member of the
Q6: Pay appropriate in
the company for the
Q7: Benefits meet my
need
Q8: Benefit program
important for my stay
in the company
Q9: Adequate
recognition for
Q10: Adequately
trained to do the job
Q11: ABC supports the
training and
Q12: Respect is an
important factor in
Q13: Treated with
respect at work
Q14: Committed to
making ABC successful
Q15: Would
recommend to a friend
Q1:
Employment
Years 1 -.34
6 .444* -.108 -.13
2 .039 -.234 -.10
3 .045 -.20
2
-.09
3 -.329 -.09
1
-.14
5
Q2: Job Grade
-.34
6 1 .184 -.022 .363
* -.161 .000 -.11
6 -.084 .162 -.06
0 .316 -.20
0 .046
⊘ This is a preview!⊘
Do you want full access?
Subscribe today to unlock all pages.
Trusted by 1+ million students worldwide
1 out of 23
Related Documents


Your All-in-One AI-Powered Toolkit for Academic Success.
+13062052269
info@desklib.com
Available 24*7 on WhatsApp / Email
![[object Object]](/_next/static/media/star-bottom.7253800d.svg)
Unlock your academic potential
Copyright © 2020–2026 A2Z Services. All Rights Reserved. Developed and managed by ZUCOL.