Financial Performance Analysis and Budget Report for ABC Pty Ltd
VerifiedAdded on  2022/10/13
|22
|2558
|16
Report
AI Summary
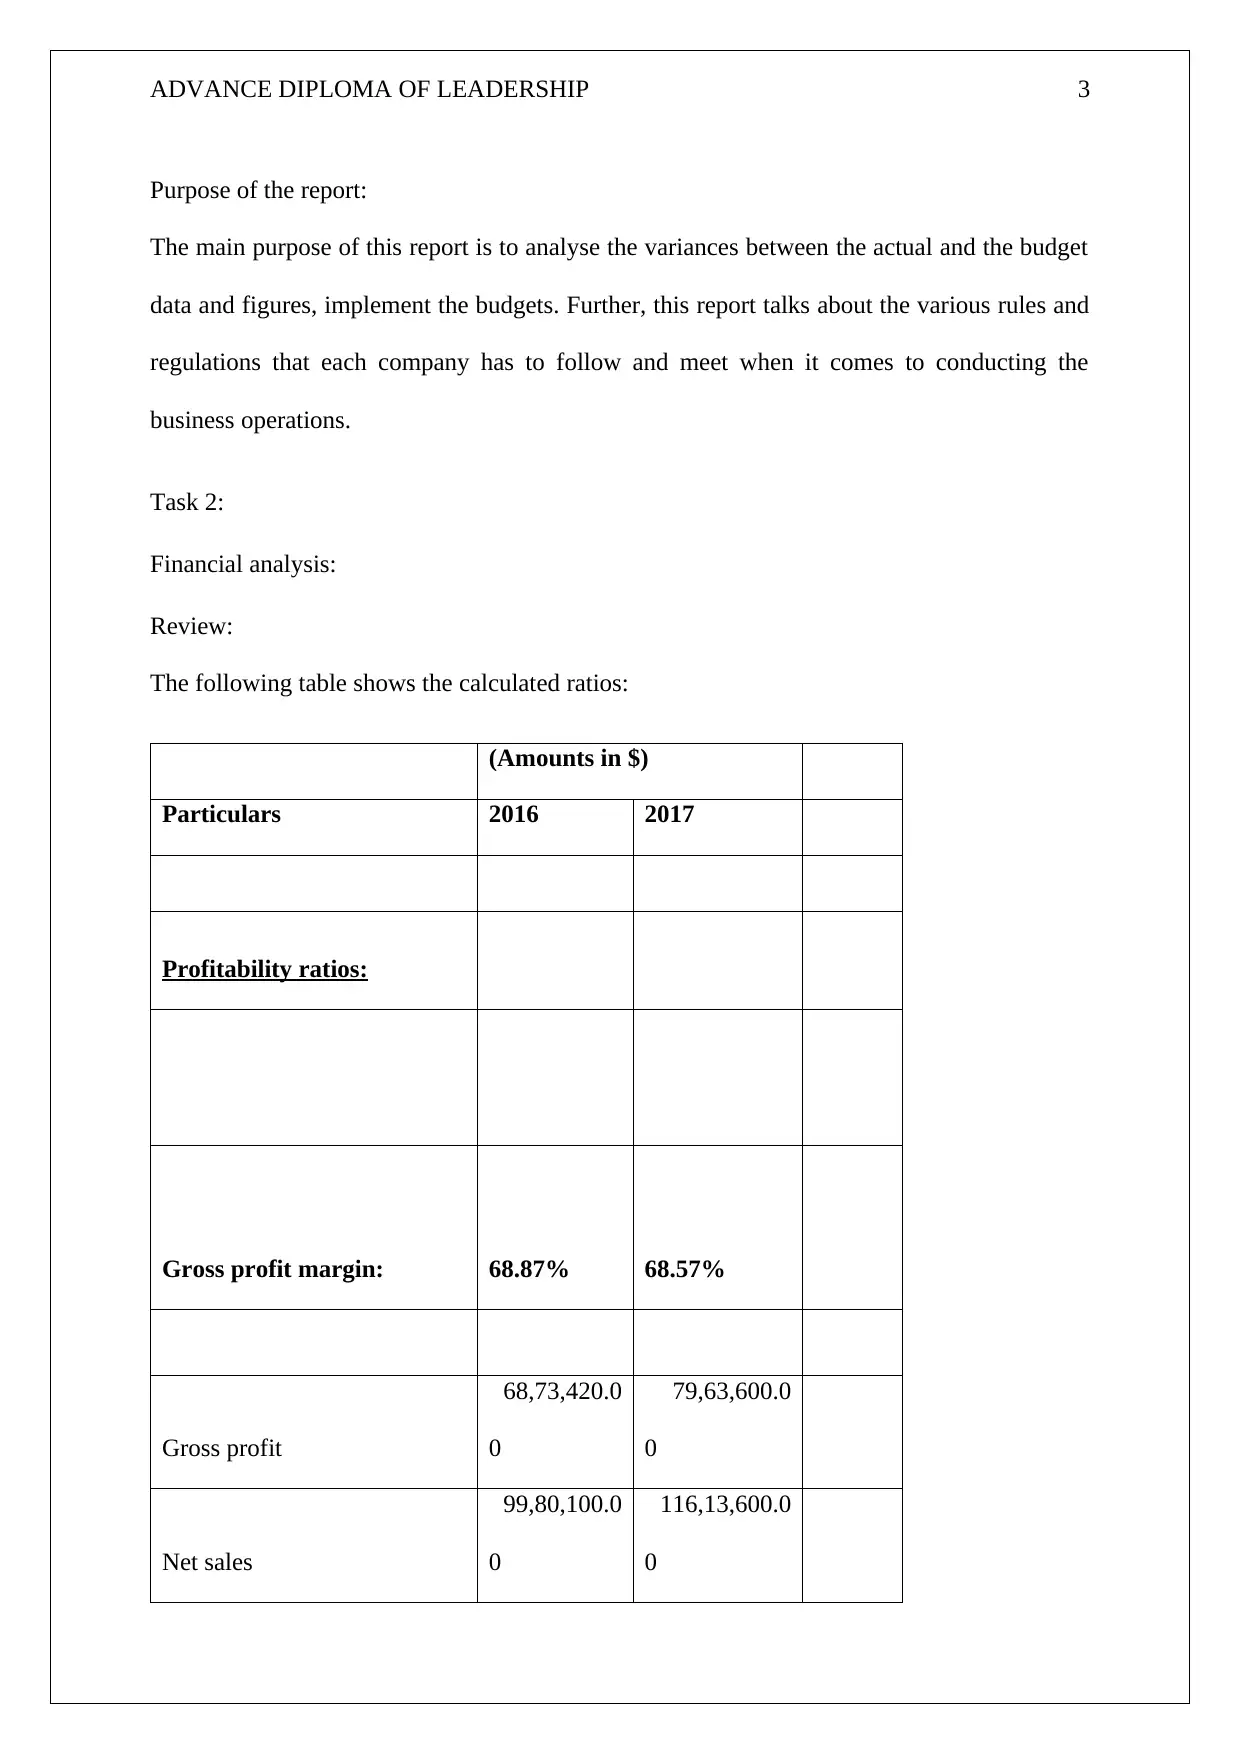
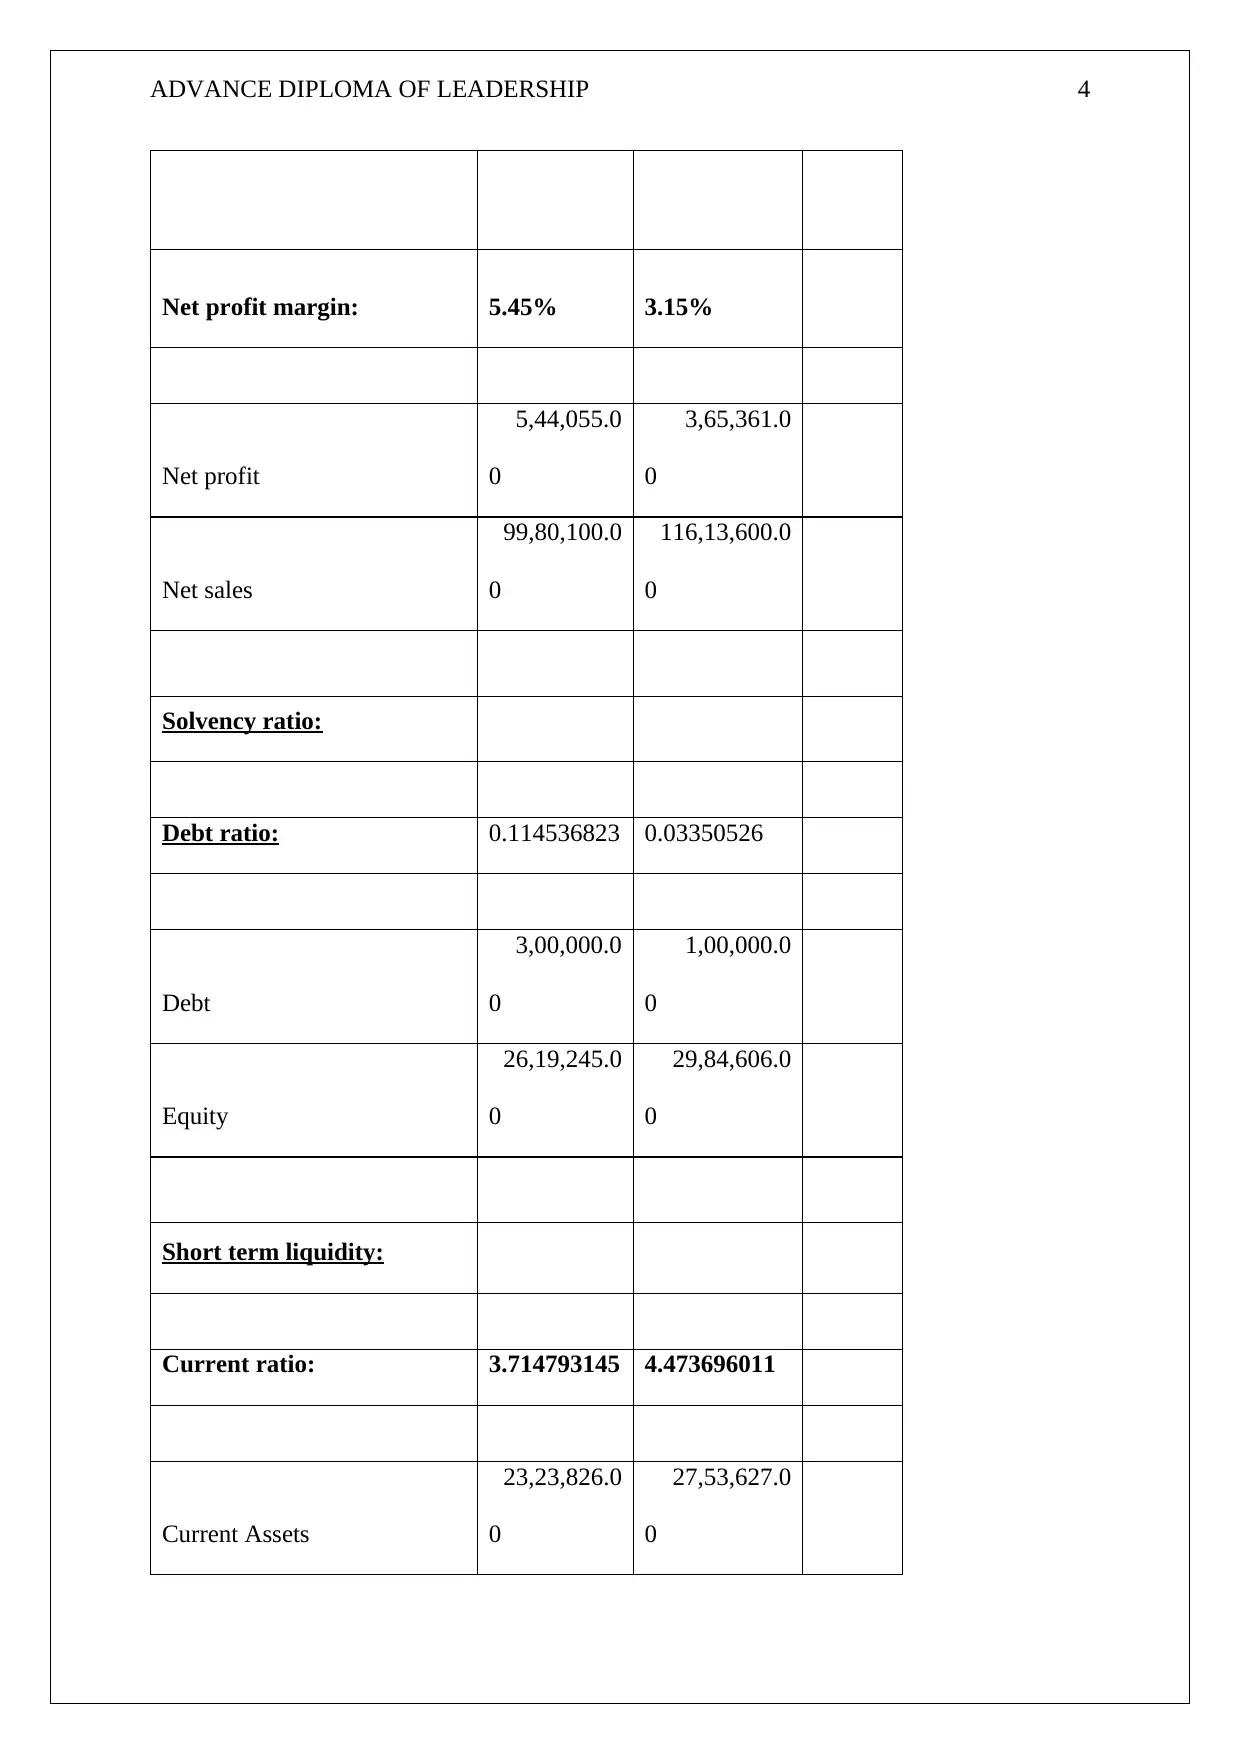
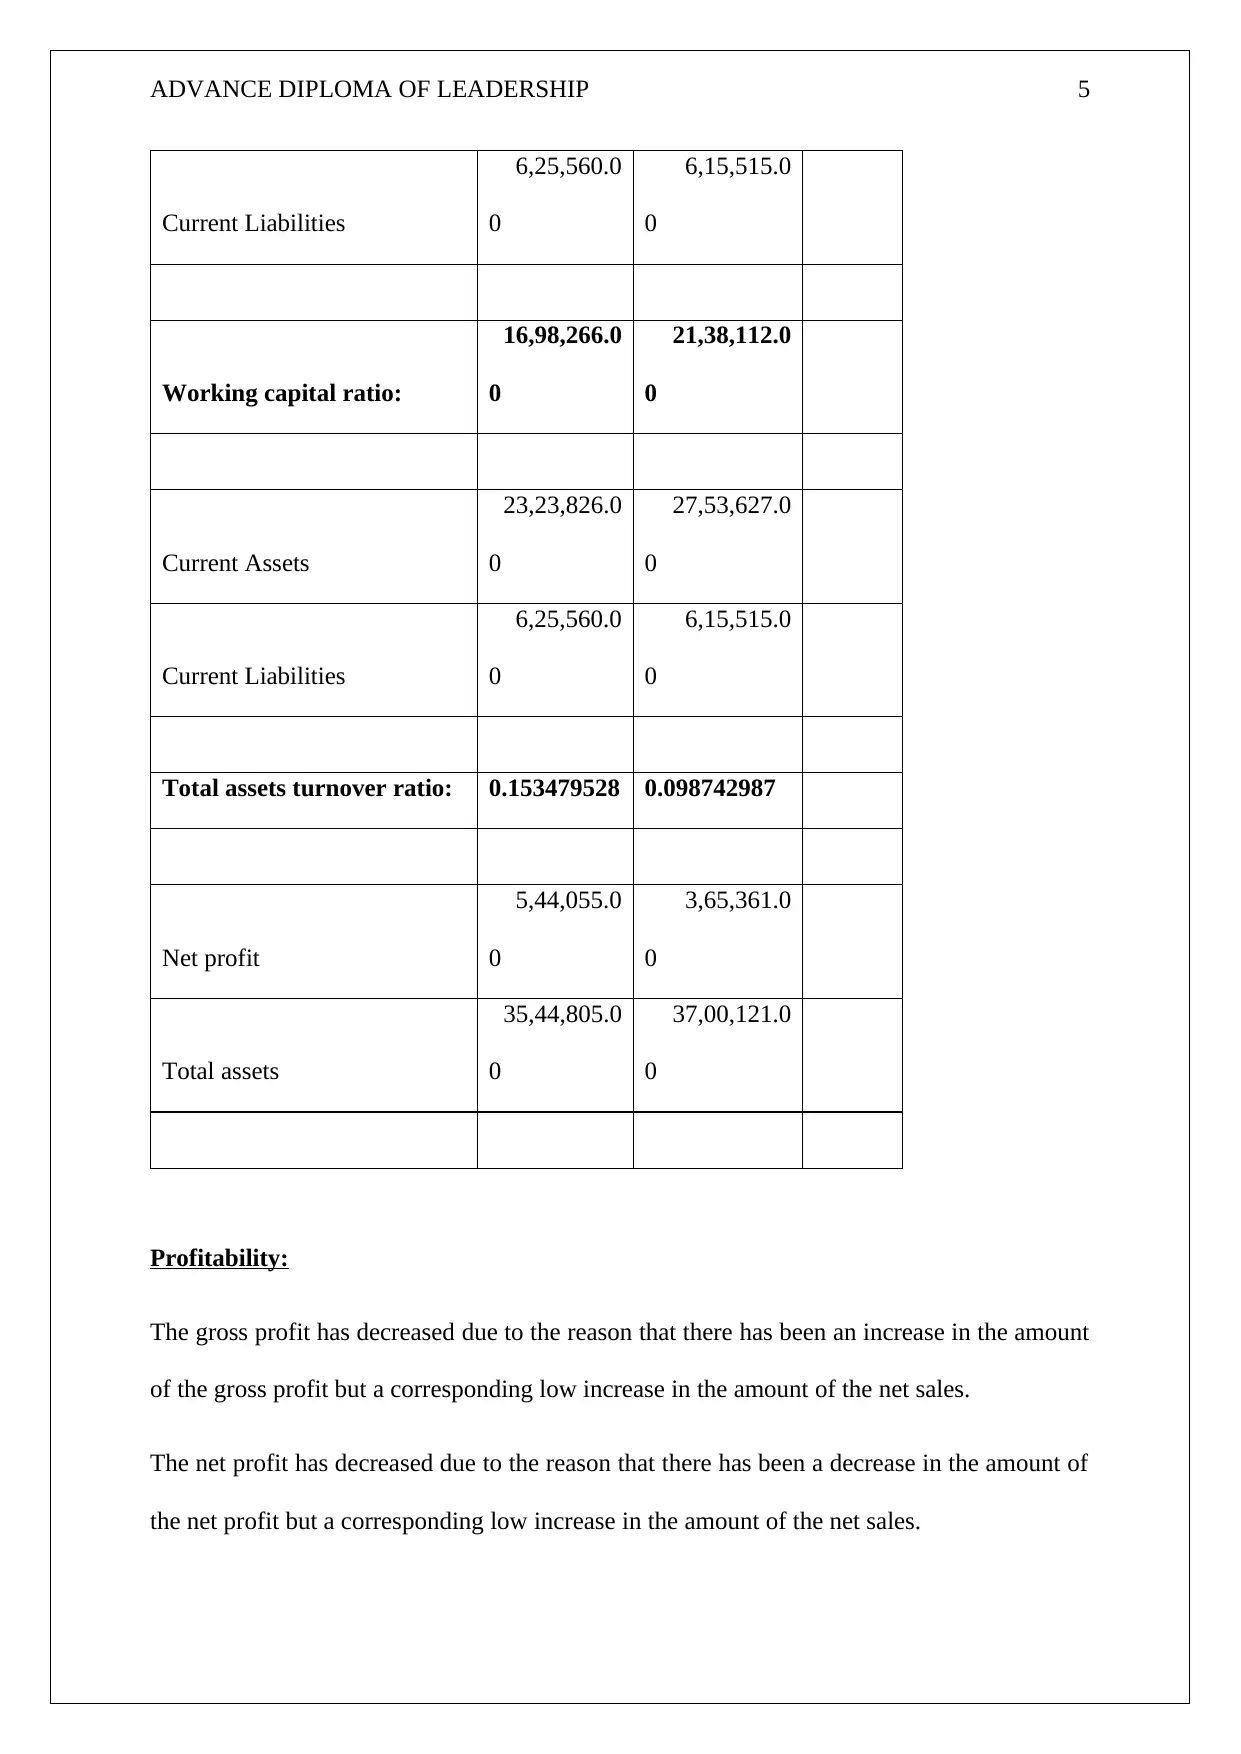
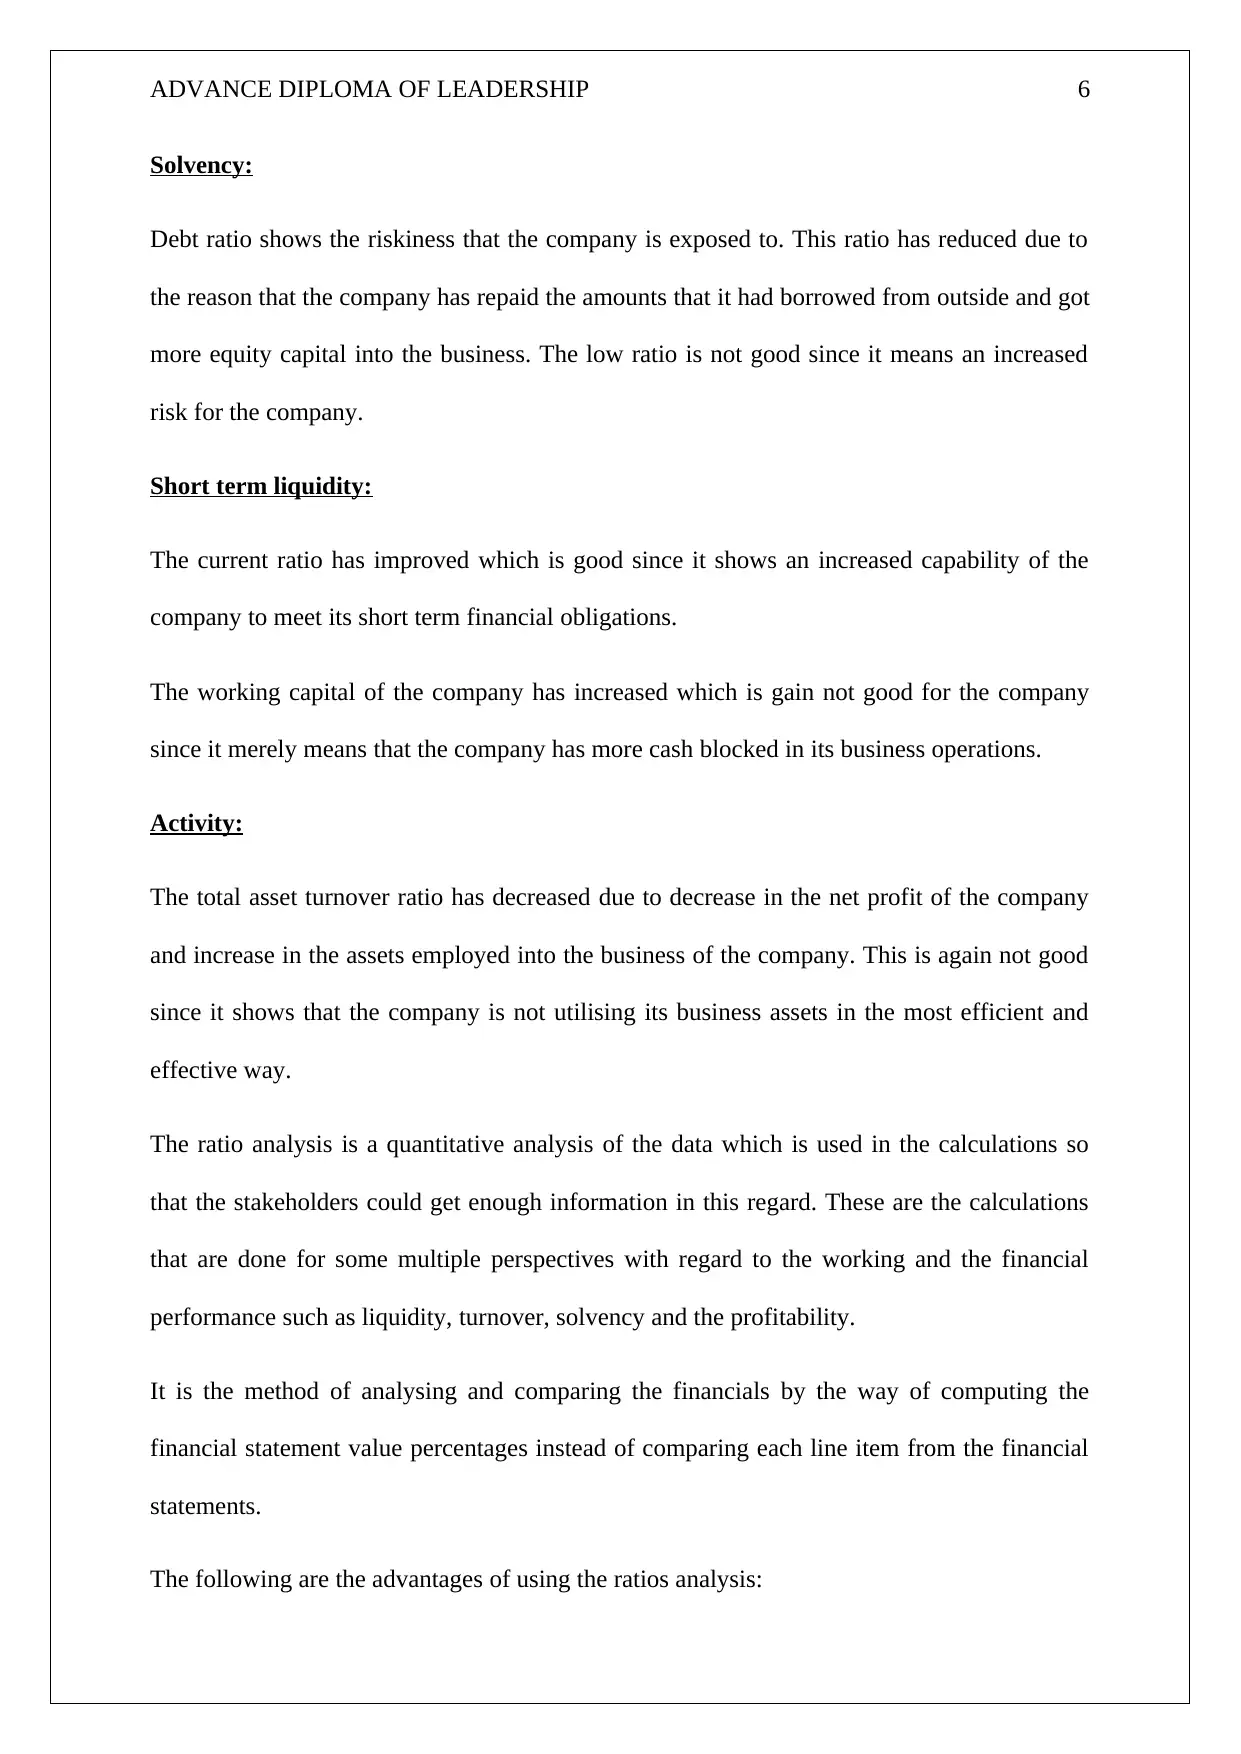
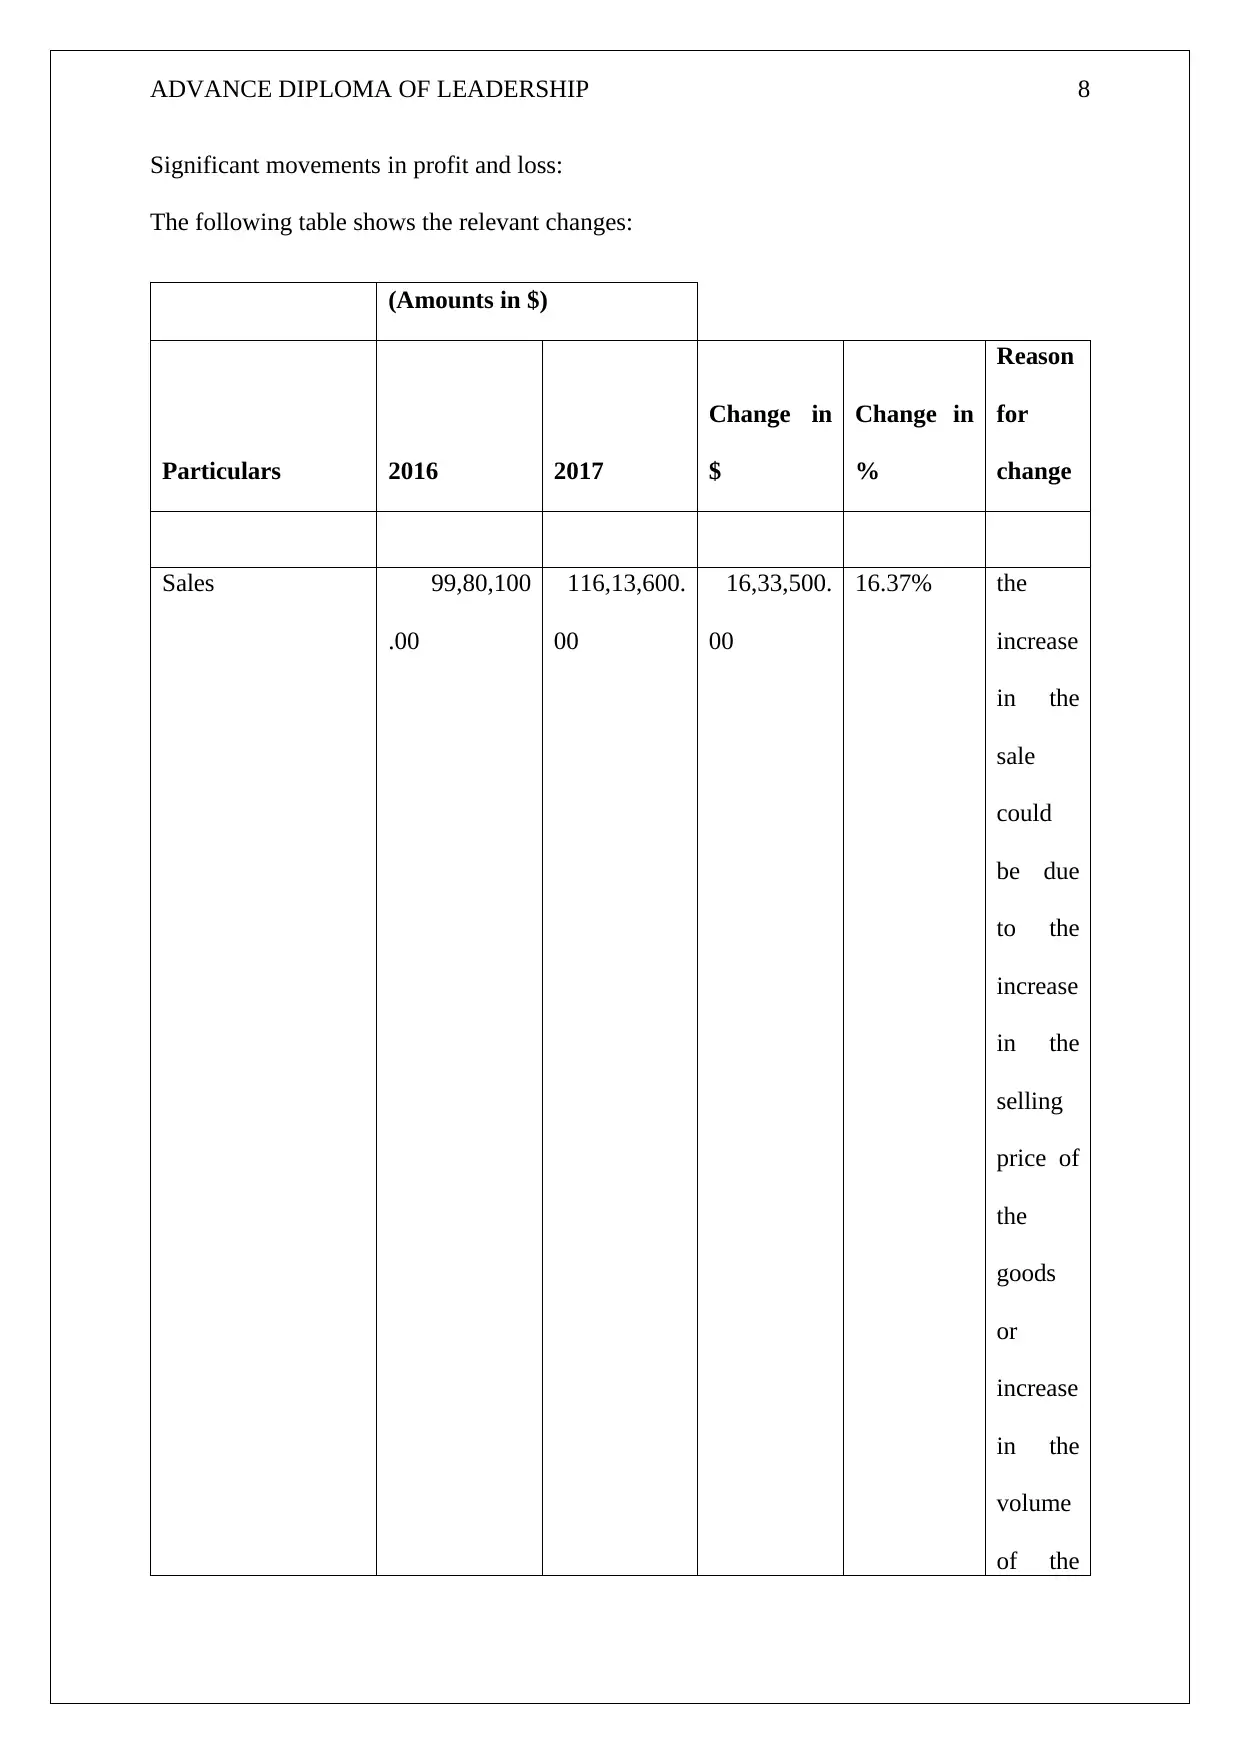
This report provides a comprehensive financial analysis of ABC Pty Ltd, encompassing a review of financial ratios, significant movements in profit and loss, and cash flows. It evaluates the company's financial performance, including profitability, solvency, short-term liquidity, and activity ratios. The report examines the benefits of changing the accounting system from MYOB to XERO and includes a detailed profit and sales budget for 2018, along with relevant assumptions. It also offers recommendations for improvement based on the financial data and reviews the company's business plan, including timelines for various filings such as activity statements, fringe benefit tax returns, goods and services taxes, income taxes, and PAYG withholding taxes. The analysis includes a student declaration, ensuring the work's originality and adherence to academic integrity standards. The report aims to provide a clear understanding of ABC Pty Ltd's financial position and offer strategic insights for enhanced performance.

ADVANCE DIPLOMA OF LEADERSHIP 1
Student declaration:
To be filled out and submitted with responses
 I declare that this task is all my own work and I have not cheated or plagiarised the
work or colluded with any other student(s)
 I understand that if I am found to have plagiarised, cheated or colluded, action will be
taken according to process explained to me
 I have correctly referenced all resources and reference texts throughout these
assessment tasks
 I understand the rights to re-assessment
 I understand the right to appeal the decisions made in the assessment
Paraphrase This Document
Need a fresh take? Get an instant paraphrase of this document with our AI Paraphraser

ADVANCE DIPLOMA OF LEADERSHIP 2
Contents
Purpose of the report:.................................................................................................................3
Task 2:........................................................................................................................................3
Financial analysis:..................................................................................................................3
Review:...................................................................................................................................3
Significant movements in profit and loss:..............................................................................8
Significant movements in cash flows:..................................................................................15
Recommendations for improvements:..................................................................................16
Review of business plan:..........................................................................................................16
Benefits of changing accounting system from MYOB to XERO:...........................................18
Profit and sales budget:.........................................................................................................19
References:..............................................................................................................................24

ADVANCE DIPLOMA OF LEADERSHIP 3
Purpose of the report:
The main purpose of this report is to analyse the variances between the actual and the budget
data and figures, implement the budgets. Further, this report talks about the various rules and
regulations that each company has to follow and meet when it comes to conducting the
business operations.
Task 2:
Financial analysis:
Review:
The following table shows the calculated ratios:
(Amounts in $)
Particulars 2016 2017
Profitability ratios:
Gross profit margin: 68.87% 68.57%
Gross profit
68,73,420.0
0
79,63,600.0
0
Net sales
99,80,100.0
0
116,13,600.0
0
⊘ This is a preview!⊘
Do you want full access?
Subscribe today to unlock all pages.

Trusted by 1+ million students worldwide

ADVANCE DIPLOMA OF LEADERSHIP 4
Net profit margin: 5.45% 3.15%
Net profit
5,44,055.0
0
3,65,361.0
0
Net sales
99,80,100.0
0
116,13,600.0
0
Solvency ratio:
Debt ratio: 0.114536823 0.03350526
Debt
3,00,000.0
0
1,00,000.0
0
Equity
26,19,245.0
0
29,84,606.0
0
Short term liquidity:
Current ratio: 3.714793145 4.473696011
Current Assets
23,23,826.0
0
27,53,627.0
0
Paraphrase This Document
Need a fresh take? Get an instant paraphrase of this document with our AI Paraphraser

ADVANCE DIPLOMA OF LEADERSHIP 5
Current Liabilities
6,25,560.0
0
6,15,515.0
0
Working capital ratio:
16,98,266.0
0
21,38,112.0
0
Current Assets
23,23,826.0
0
27,53,627.0
0
Current Liabilities
6,25,560.0
0
6,15,515.0
0
Total assets turnover ratio: 0.153479528 0.098742987
Net profit
5,44,055.0
0
3,65,361.0
0
Total assets
35,44,805.0
0
37,00,121.0
0
Profitability:
The gross profit has decreased due to the reason that there has been an increase in the amount
of the gross profit but a corresponding low increase in the amount of the net sales.
The net profit has decreased due to the reason that there has been a decrease in the amount of
the net profit but a corresponding low increase in the amount of the net sales.
Current Liabilities
6,25,560.0
0
6,15,515.0
0
Working capital ratio:
16,98,266.0
0
21,38,112.0
0
Current Assets
23,23,826.0
0
27,53,627.0
0
Current Liabilities
6,25,560.0
0
6,15,515.0
0
Total assets turnover ratio: 0.153479528 0.098742987
Net profit
5,44,055.0
0
3,65,361.0
0
Total assets
35,44,805.0
0
37,00,121.0
0
Profitability:
The gross profit has decreased due to the reason that there has been an increase in the amount
of the gross profit but a corresponding low increase in the amount of the net sales.
The net profit has decreased due to the reason that there has been a decrease in the amount of
the net profit but a corresponding low increase in the amount of the net sales.

ADVANCE DIPLOMA OF LEADERSHIP 6
Solvency:
Debt ratio shows the riskiness that the company is exposed to. This ratio has reduced due to
the reason that the company has repaid the amounts that it had borrowed from outside and got
more equity capital into the business. The low ratio is not good since it means an increased
risk for the company.
Short term liquidity:
The current ratio has improved which is good since it shows an increased capability of the
company to meet its short term financial obligations.
The working capital of the company has increased which is gain not good for the company
since it merely means that the company has more cash blocked in its business operations.
Activity:
The total asset turnover ratio has decreased due to decrease in the net profit of the company
and increase in the assets employed into the business of the company. This is again not good
since it shows that the company is not utilising its business assets in the most efficient and
effective way.
The ratio analysis is a quantitative analysis of the data which is used in the calculations so
that the stakeholders could get enough information in this regard. These are the calculations
that are done for some multiple perspectives with regard to the working and the financial
performance such as liquidity, turnover, solvency and the profitability.
It is the method of analysing and comparing the financials by the way of computing the
financial statement value percentages instead of comparing each line item from the financial
statements.
The following are the advantages of using the ratios analysis:
⊘ This is a preview!⊘
Do you want full access?
Subscribe today to unlock all pages.

Trusted by 1+ million students worldwide

ADVANCE DIPLOMA OF LEADERSHIP 7
ï‚· The financials are simplified
ï‚· It assist in comparing the companies that are of different sizes
ï‚· It helps in understanding the trend analysis when it incorporates the comparison
between the single company over the period of time
ï‚· With the help of it, the company is able to gather some major data immediately. The
user could decide whether to invest into the company or not merely by looking at the
figures that have been calculated. He could understand the complete financials of the
company ("Ratio Analysis: Meaning, Advantages and Limitations | Accounting",
2019).
The following are the disadvantages of using ratios:
ï‚· The financials become very complicated ("Advantages and Disadvantages of Ratio
Analysis - What is Ratio Analysis?", 2019).
ï‚· There is work in many companies that exists in the enterprises which possess the
different environmental position such as the market structure etc. these are the factors
that affects the comparison which exists between the 2 organisations from the
different industries
ï‚· This financial accounting data is comprised of the views and the hypothesis. The
accounting criteria provides some different methods of accounting which goes on to
reduce the comparability and hence, the ratio analysis become less helpful when it
comes to the circumstances like these
ï‚· The calculations helps in the association between the prior date when are users of
these financials are more concerned about the current and the future data ("Ratio
Analysis: Meaning, Objectives, Advantages, Limitations & Examples", 2019)
Paraphrase This Document
Need a fresh take? Get an instant paraphrase of this document with our AI Paraphraser

ADVANCE DIPLOMA OF LEADERSHIP 8
Significant movements in profit and loss:
The following table shows the relevant changes:
(Amounts in $)
Particulars 2016 2017
Change in
$
Change in
%
Reason
for
change
Sales 99,80,100
.00
116,13,600.
00
16,33,500.
00
16.37% the
increase
in the
sale
could
be due
to the
increase
in the
selling
price of
the
goods
or
increase
in the
volume
of the

ADVANCE DIPLOMA OF LEADERSHIP 9
goods
sold
Less: cost of goods
sold
31,06,680
.00
36,50,000.
00
5,43,320.
00 17.49%
the
increase
is due
to the
increase
in the
sale
which
is
alright
because
when
the
sales
increase
s, the
cost of
goods
sold
will
also
increase
goods
sold
Less: cost of goods
sold
31,06,680
.00
36,50,000.
00
5,43,320.
00 17.49%
the
increase
is due
to the
increase
in the
sale
which
is
alright
because
when
the
sales
increase
s, the
cost of
goods
sold
will
also
increase
⊘ This is a preview!⊘
Do you want full access?
Subscribe today to unlock all pages.

Trusted by 1+ million students worldwide

ADVANCE DIPLOMA OF LEADERSHIP 10
-
Gross profit
68,73,420
.00
79,63,600.
00
10,90,180.
00 15.86%
the
change
is due
to the
increase
in the
sales
and the
cost of
goods
sold
Less: expenses: -
Wages 45,50,000
.00
55,50,000.
00
10,00,000.
00
21.98% the
increase
could
be due
to
increase
in the
number
of
-
Gross profit
68,73,420
.00
79,63,600.
00
10,90,180.
00 15.86%
the
change
is due
to the
increase
in the
sales
and the
cost of
goods
sold
Less: expenses: -
Wages 45,50,000
.00
55,50,000.
00
10,00,000.
00
21.98% the
increase
could
be due
to
increase
in the
number
of
Paraphrase This Document
Need a fresh take? Get an instant paraphrase of this document with our AI Paraphraser

ADVANCE DIPLOMA OF LEADERSHIP 11
workers
workin
g in the
compan
y
Superannuation
4,32,250
.00
5,27,250.
00
95,000.
00 21.98%
the
increase
could
be due
to the
increase
in the
number
of
laboure
rs and
workers
in the
compan
y
Payroll taxes 1,90,363
.00
2,38,863.
00
48,500.
00
25.48% change
in the
number
of
workers
workers
workin
g in the
compan
y
Superannuation
4,32,250
.00
5,27,250.
00
95,000.
00 21.98%
the
increase
could
be due
to the
increase
in the
number
of
laboure
rs and
workers
in the
compan
y
Payroll taxes 1,90,363
.00
2,38,863.
00
48,500.
00
25.48% change
in the
number
of
workers

ADVANCE DIPLOMA OF LEADERSHIP 12
would
increase
the
taxes
payable
on their
salaries
or
wages
too
Rent
4,50,000
.00
4,50,000.
00 - 0.00%
no
change
Advertising
1,20,000
.00
1,50,000.
00
30,000.
00 25.00%
the
change
is due
to
increase
in sales
Repairs 12,600
.00
12,900.
00
300.
00
2.38% the
change
is due
to more
sales of
the
compan
would
increase
the
taxes
payable
on their
salaries
or
wages
too
Rent
4,50,000
.00
4,50,000.
00 - 0.00%
no
change
Advertising
1,20,000
.00
1,50,000.
00
30,000.
00 25.00%
the
change
is due
to
increase
in sales
Repairs 12,600
.00
12,900.
00
300.
00
2.38% the
change
is due
to more
sales of
the
compan
⊘ This is a preview!⊘
Do you want full access?
Subscribe today to unlock all pages.

Trusted by 1+ million students worldwide
1 out of 22
Related Documents

Your All-in-One AI-Powered Toolkit for Academic Success.
 +13062052269
info@desklib.com
Available 24*7 on WhatsApp / Email
Unlock your academic potential
Copyright © 2020–2025 A2Z Services. All Rights Reserved. Developed and managed by ZUCOL.