ABC Retail Company Transaction Analysis Report using SAS Guide
VerifiedAdded on 2023/06/14
|12
|1615
|289
Report
AI Summary
This report presents a comprehensive analysis of ABC Retail Company's transaction data using SAS Enterprise Guide. The analysis identifies key trends related to customer spending habits, product sales across different states, and top-selling products. Findings highlight the importance of classifying customer life stages accurately, focusing on specific shopping weeks, targeting underperforming states like Tasmania, Australian Capital Territory, and West Australia, and strategically marketing non-food items. The report concludes with actionable insights for improving sales performance, optimizing marketing strategies, and enhancing overall business intelligence to drive revenue growth. The SAS codes used for each analysis are included in the appendix.
P a g e | 1
703671
703671
Paraphrase This Document
Need a fresh take? Get an instant paraphrase of this document with our AI Paraphraser
P a g e | 2
Table of Contents
I. Introduction 3
II. Findings (Descriptive Analysis) 4
III. Creative Insights 10
IV. Conclusion 11
Table of Contents
I. Introduction 3
II. Findings (Descriptive Analysis) 4
III. Creative Insights 10
IV. Conclusion 11
P a g e | 3
I. Introduction
Business intelligence is being readily internalized by the organizations via various
cutting-edge statistical softwares to unearth patterns hidden within raw data of the organizations
and derive meaningful insights that act as strategic assets for decision making. Proper decision
making minimizes operational cost and gives a strategic dimension to the organization. In
today’s world of Big Data, business intelligence is crucial and it forays basically into the
following arenas:
Data mining & Data warehousing
Sophisticated reporting of complex and huge datasets
Business automation
Predictive modeling
Dashboard & data visualization
Trend analysis
Among various business intelligence platforms in use by businesses, SAS (Statistical
Analysis System) is a leading business intelligence platform that is the selected choice of large
corporates. SAS is proficient in delivering mainly the following:
Advanced analytics
Multivariate analyses
Data analysis of huge datasets
Predictive analytics
Data management
Advanced reporting
Using SAS Enterprise edition, here our objective is to analyze the transactions of a retail
organization i.e. ABC Retail Company based out of United States of America. We will highlight the
central findings along with the SAS codes necessary to generate the findings.
⊘ This is a preview!⊘
Do you want full access?
Subscribe today to unlock all pages.
Trusted by 1+ million students worldwide
P a g e | 4
II. FINDINGS (Descriptive Analysis)
QUESTION 1
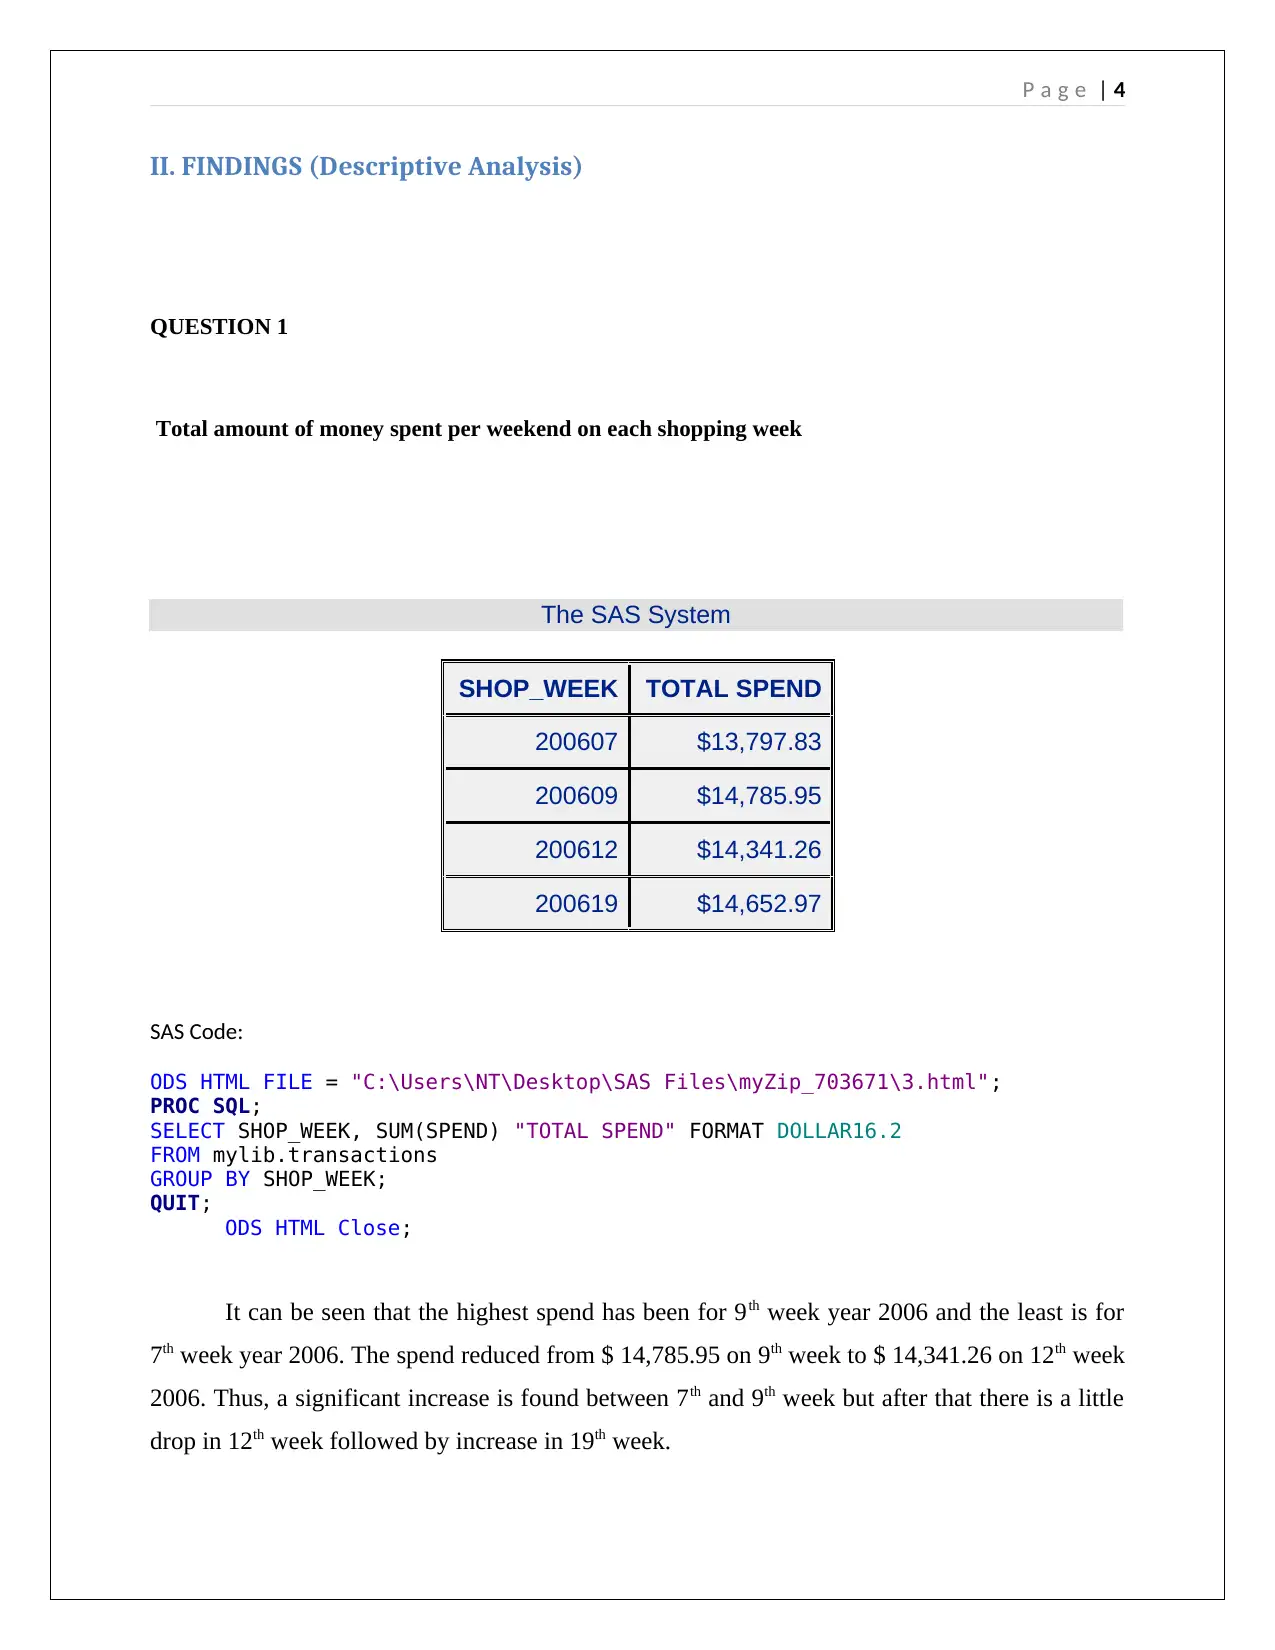
Total amount of money spent per weekend on each shopping week
The SAS System
SHOP_WEEK TOTAL SPEND
200607 $13,797.83
200609 $14,785.95
200612 $14,341.26
200619 $14,652.97
SAS Code:
ODS HTML FILE = "C:\Users\NT\Desktop\SAS Files\myZip_703671\3.html";
PROC SQL;
SELECT SHOP_WEEK, SUM(SPEND) "TOTAL SPEND" FORMAT DOLLAR16.2
FROM mylib.transactions
GROUP BY SHOP_WEEK;
QUIT;
ODS HTML Close;
It can be seen that the highest spend has been for 9th week year 2006 and the least is for
7th week year 2006. The spend reduced from $ 14,785.95 on 9th week to $ 14,341.26 on 12th week
2006. Thus, a significant increase is found between 7th and 9th week but after that there is a little
drop in 12th week followed by increase in 19th week.
II. FINDINGS (Descriptive Analysis)
QUESTION 1
Total amount of money spent per weekend on each shopping week
The SAS System
SHOP_WEEK TOTAL SPEND
200607 $13,797.83
200609 $14,785.95
200612 $14,341.26
200619 $14,652.97
SAS Code:
ODS HTML FILE = "C:\Users\NT\Desktop\SAS Files\myZip_703671\3.html";
PROC SQL;
SELECT SHOP_WEEK, SUM(SPEND) "TOTAL SPEND" FORMAT DOLLAR16.2
FROM mylib.transactions
GROUP BY SHOP_WEEK;
QUIT;
ODS HTML Close;
It can be seen that the highest spend has been for 9th week year 2006 and the least is for
7th week year 2006. The spend reduced from $ 14,785.95 on 9th week to $ 14,341.26 on 12th week
2006. Thus, a significant increase is found between 7th and 9th week but after that there is a little
drop in 12th week followed by increase in 19th week.
Paraphrase This Document
Need a fresh take? Get an instant paraphrase of this document with our AI Paraphraser
P a g e | 5
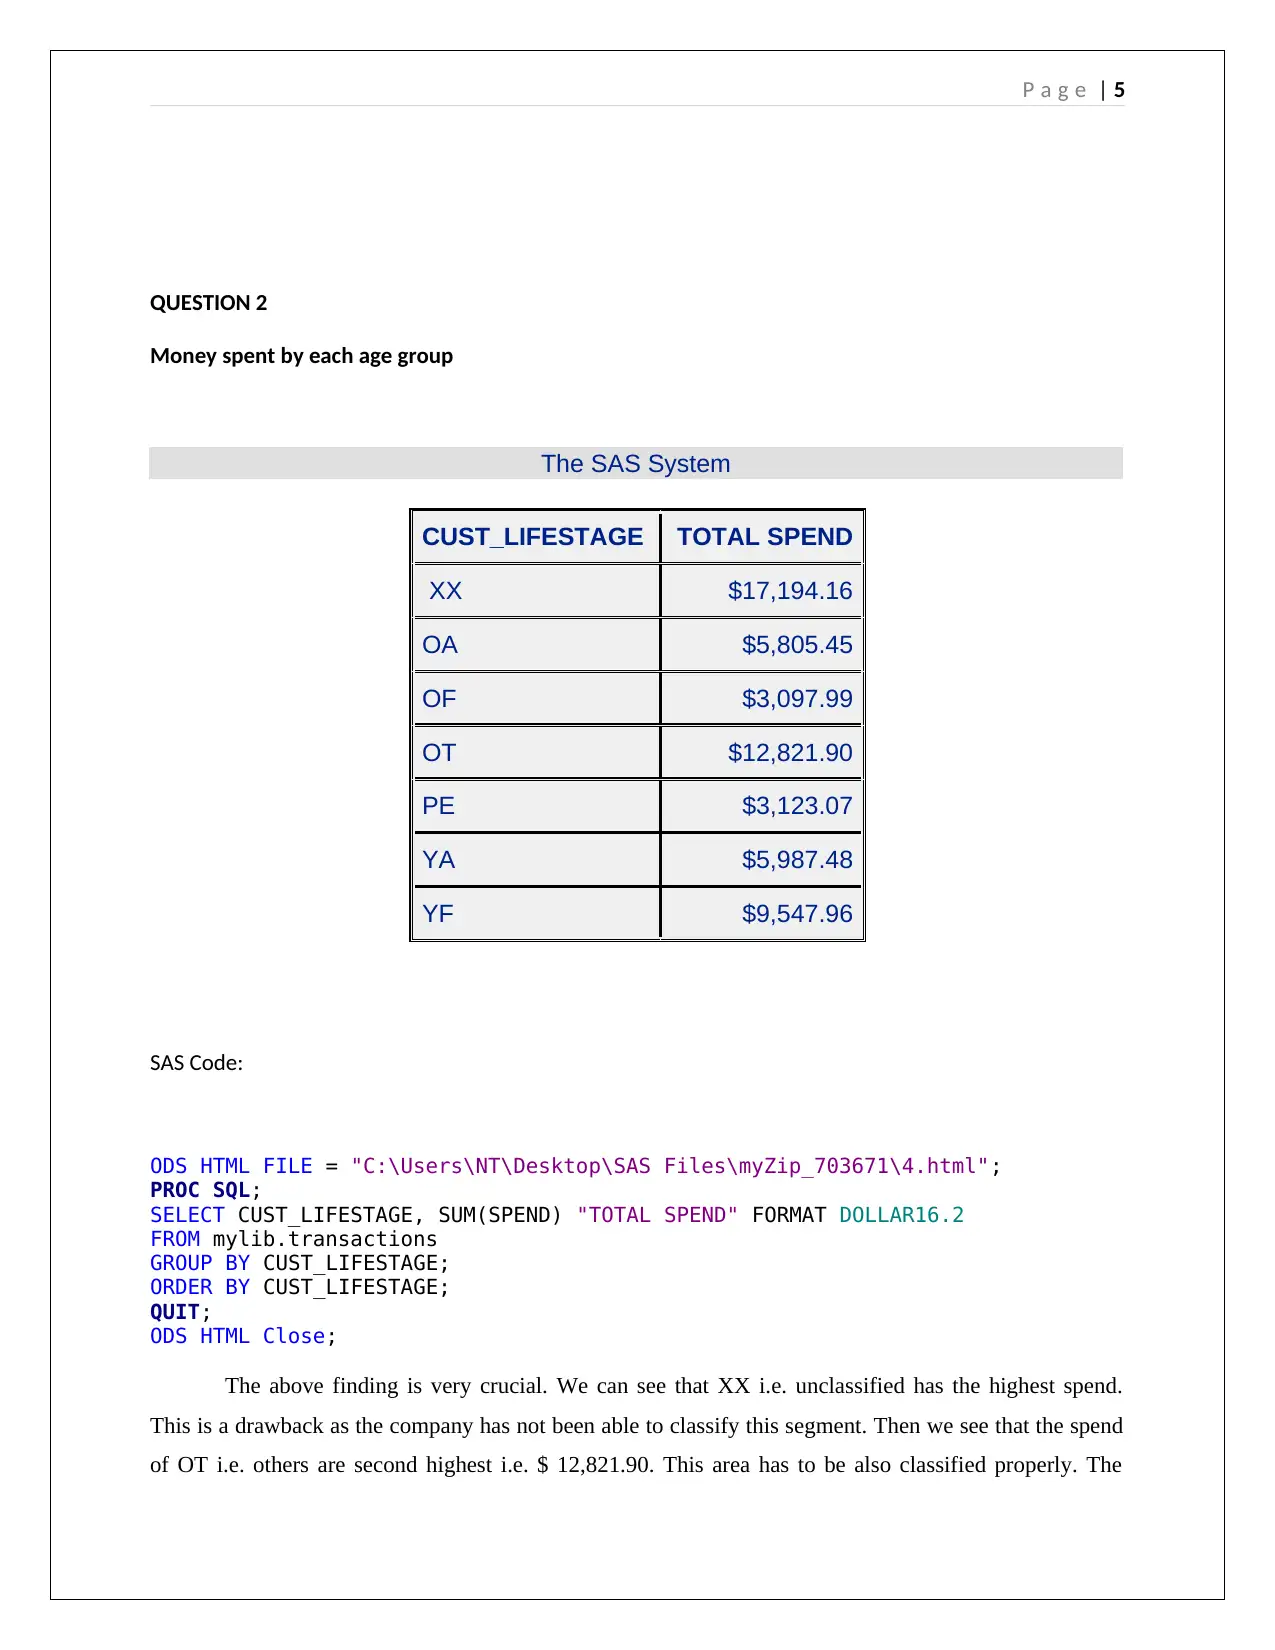
QUESTION 2
Money spent by each age group
The SAS System
CUST_LIFESTAGE TOTAL SPEND
XX $17,194.16
OA $5,805.45
OF $3,097.99
OT $12,821.90
PE $3,123.07
YA $5,987.48
YF $9,547.96
SAS Code:
ODS HTML FILE = "C:\Users\NT\Desktop\SAS Files\myZip_703671\4.html";
PROC SQL;
SELECT CUST_LIFESTAGE, SUM(SPEND) "TOTAL SPEND" FORMAT DOLLAR16.2
FROM mylib.transactions
GROUP BY CUST_LIFESTAGE;
ORDER BY CUST_LIFESTAGE;
QUIT;
ODS HTML Close;
The above finding is very crucial. We can see that XX i.e. unclassified has the highest spend.
This is a drawback as the company has not been able to classify this segment. Then we see that the spend
of OT i.e. others are second highest i.e. $ 12,821.90. This area has to be also classified properly. The
P a g e | 6
young adults i.e. YA spends $ 5,987.48, OA i.e. older adults spend $5,805.45, the young families i.e. YF
spend $ 9,547.96, pensioners spend $ 3,123.07 and older families i.e. OF spend $ 3,097.99.
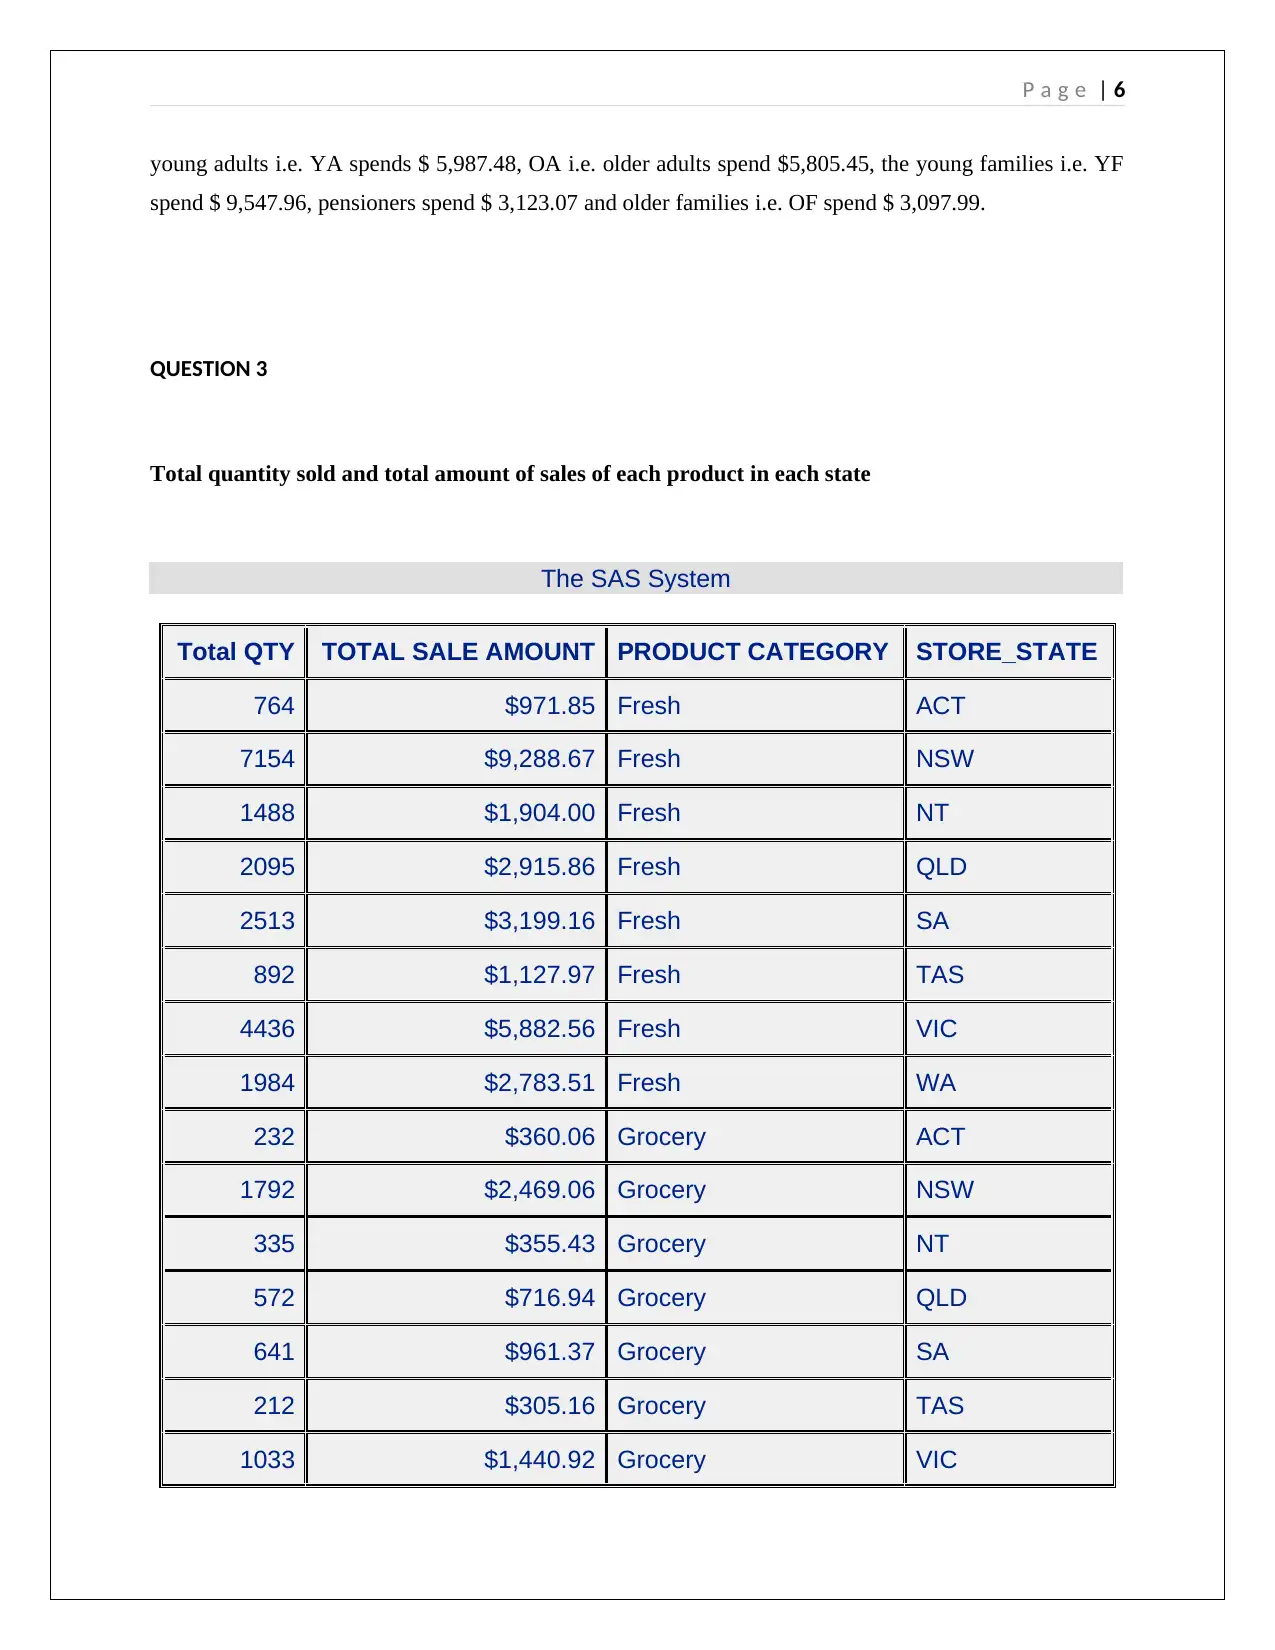
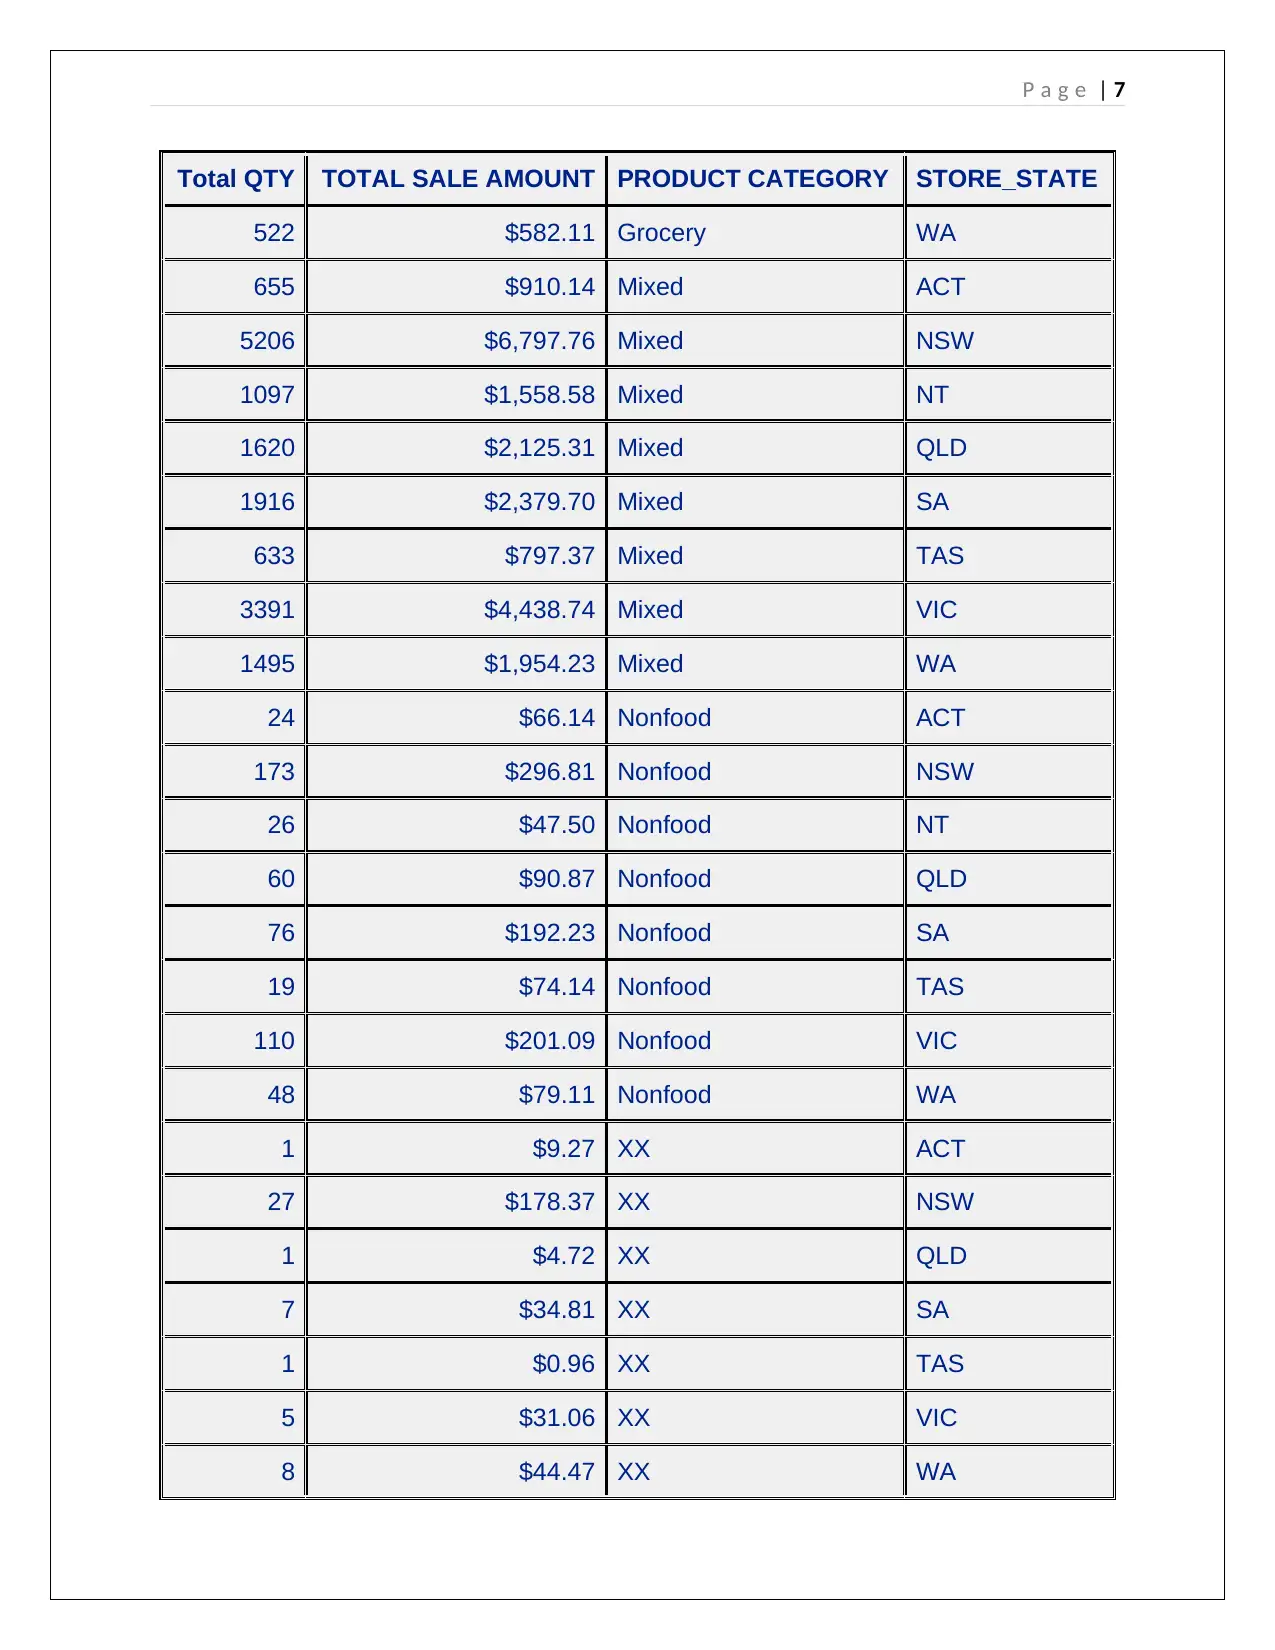
QUESTION 3
Total quantity sold and total amount of sales of each product in each state
The SAS System
Total QTY TOTAL SALE AMOUNT PRODUCT CATEGORY STORE_STATE
764 $971.85 Fresh ACT
7154 $9,288.67 Fresh NSW
1488 $1,904.00 Fresh NT
2095 $2,915.86 Fresh QLD
2513 $3,199.16 Fresh SA
892 $1,127.97 Fresh TAS
4436 $5,882.56 Fresh VIC
1984 $2,783.51 Fresh WA
232 $360.06 Grocery ACT
1792 $2,469.06 Grocery NSW
335 $355.43 Grocery NT
572 $716.94 Grocery QLD
641 $961.37 Grocery SA
212 $305.16 Grocery TAS
1033 $1,440.92 Grocery VIC
young adults i.e. YA spends $ 5,987.48, OA i.e. older adults spend $5,805.45, the young families i.e. YF
spend $ 9,547.96, pensioners spend $ 3,123.07 and older families i.e. OF spend $ 3,097.99.
QUESTION 3
Total quantity sold and total amount of sales of each product in each state
The SAS System
Total QTY TOTAL SALE AMOUNT PRODUCT CATEGORY STORE_STATE
764 $971.85 Fresh ACT
7154 $9,288.67 Fresh NSW
1488 $1,904.00 Fresh NT
2095 $2,915.86 Fresh QLD
2513 $3,199.16 Fresh SA
892 $1,127.97 Fresh TAS
4436 $5,882.56 Fresh VIC
1984 $2,783.51 Fresh WA
232 $360.06 Grocery ACT
1792 $2,469.06 Grocery NSW
335 $355.43 Grocery NT
572 $716.94 Grocery QLD
641 $961.37 Grocery SA
212 $305.16 Grocery TAS
1033 $1,440.92 Grocery VIC
⊘ This is a preview!⊘
Do you want full access?
Subscribe today to unlock all pages.
Trusted by 1+ million students worldwide
P a g e | 7
Total QTY TOTAL SALE AMOUNT PRODUCT CATEGORY STORE_STATE
522 $582.11 Grocery WA
655 $910.14 Mixed ACT
5206 $6,797.76 Mixed NSW
1097 $1,558.58 Mixed NT
1620 $2,125.31 Mixed QLD
1916 $2,379.70 Mixed SA
633 $797.37 Mixed TAS
3391 $4,438.74 Mixed VIC
1495 $1,954.23 Mixed WA
24 $66.14 Nonfood ACT
173 $296.81 Nonfood NSW
26 $47.50 Nonfood NT
60 $90.87 Nonfood QLD
76 $192.23 Nonfood SA
19 $74.14 Nonfood TAS
110 $201.09 Nonfood VIC
48 $79.11 Nonfood WA
1 $9.27 XX ACT
27 $178.37 XX NSW
1 $4.72 XX QLD
7 $34.81 XX SA
1 $0.96 XX TAS
5 $31.06 XX VIC
8 $44.47 XX WA
Paraphrase This Document
Need a fresh take? Get an instant paraphrase of this document with our AI Paraphraser
P a g e | 8
SAS Code:
ODS HTML FILE = "C:\Users\NT\Desktop\SAS Files\myZip_703671\5.html";
PROC SQL;
SELECT SUM(QUANTITY) "Total QTY", SUM(SPEND) "TOTAL SALE AMOUNT" FORMAT
DOLLAR16.2, BASKET_DOMINANT_MISSION "PRODUCT CATEGORY", STORE_STATE
FROM mylib.transactions
GROUP BY BASKET_DOMINANT_MISSION, STORE_STATE;
QUIT;
ODS HTML Close;
It can be seen that the highest selling product is Fresh and it is highest in the state of Victoria
followed by mixed product category which is also highest in the state of Victoria i.e. VIC. The least
selling states are Tasmania i.e. TAS, Australian Capital Territory and West Australia. Thus, the retailer
has to vehemently focus in these areas.
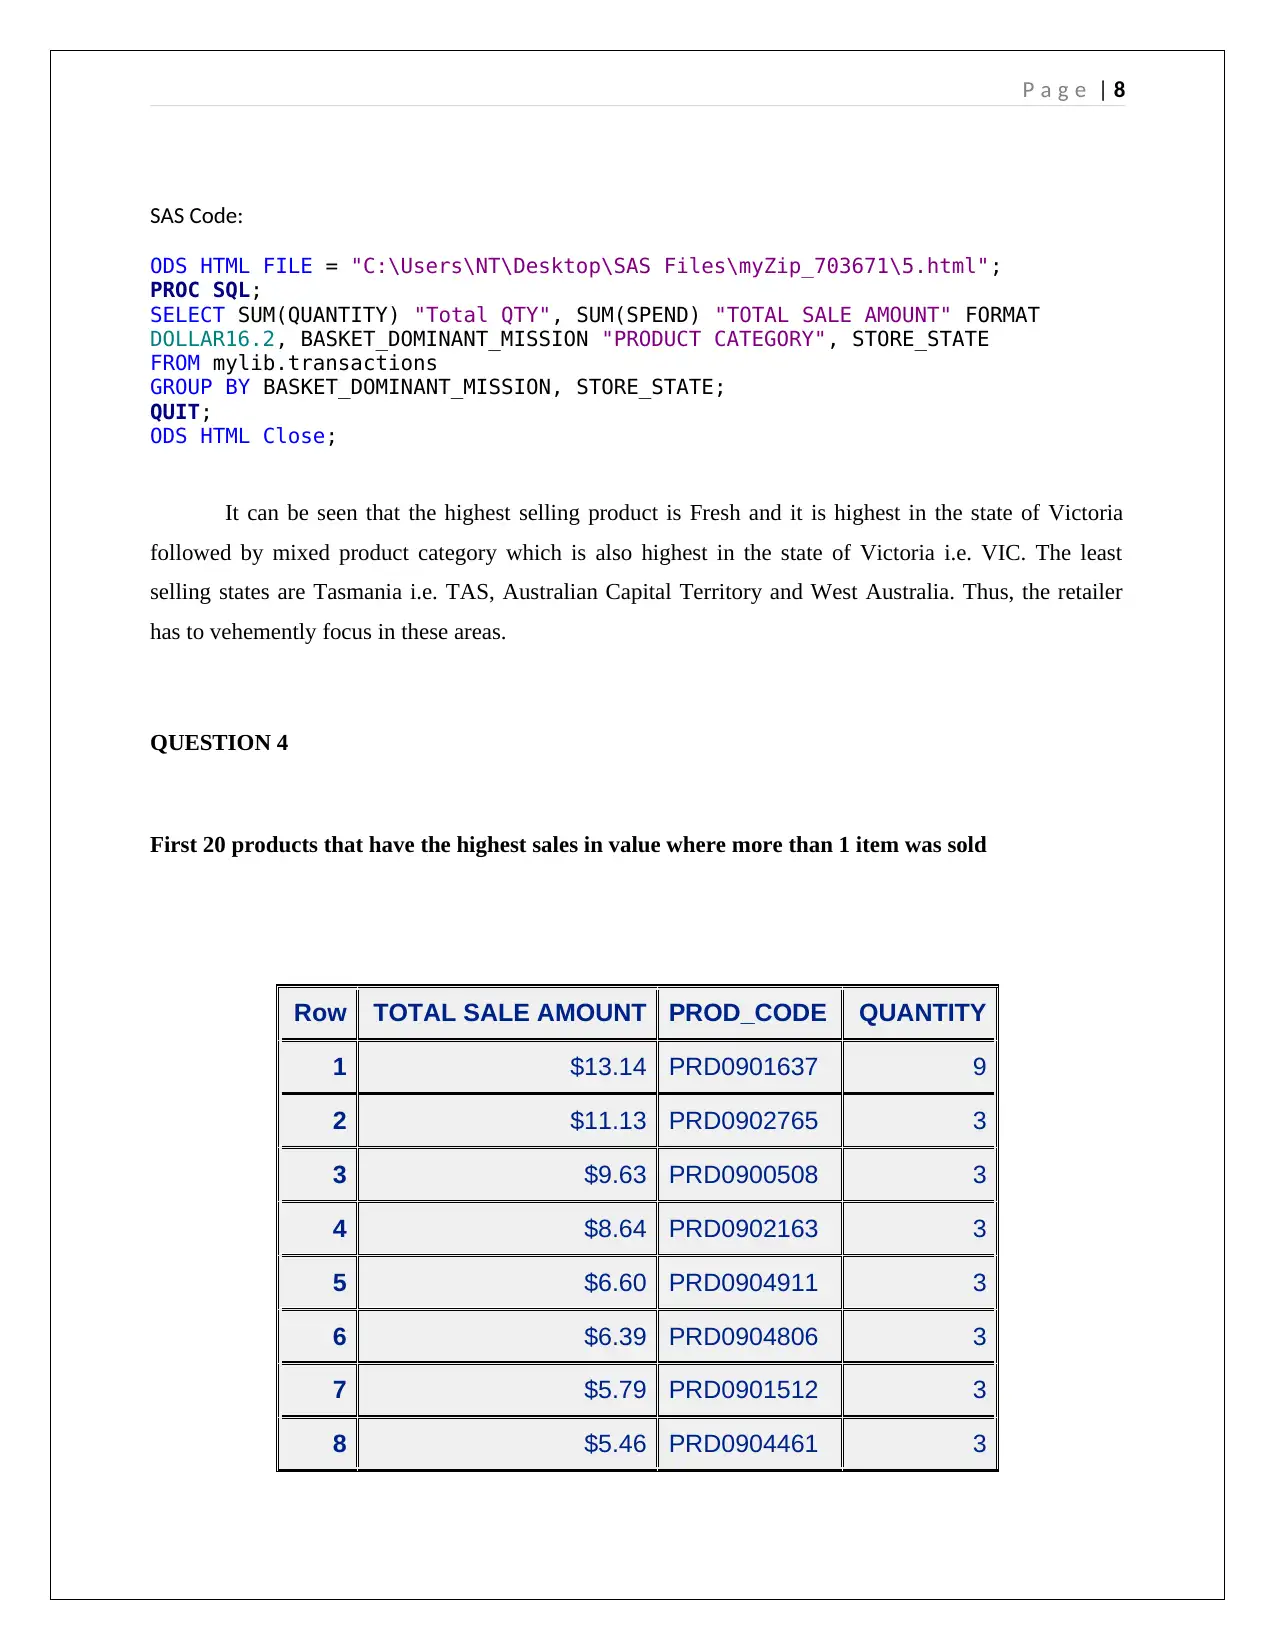
QUESTION 4
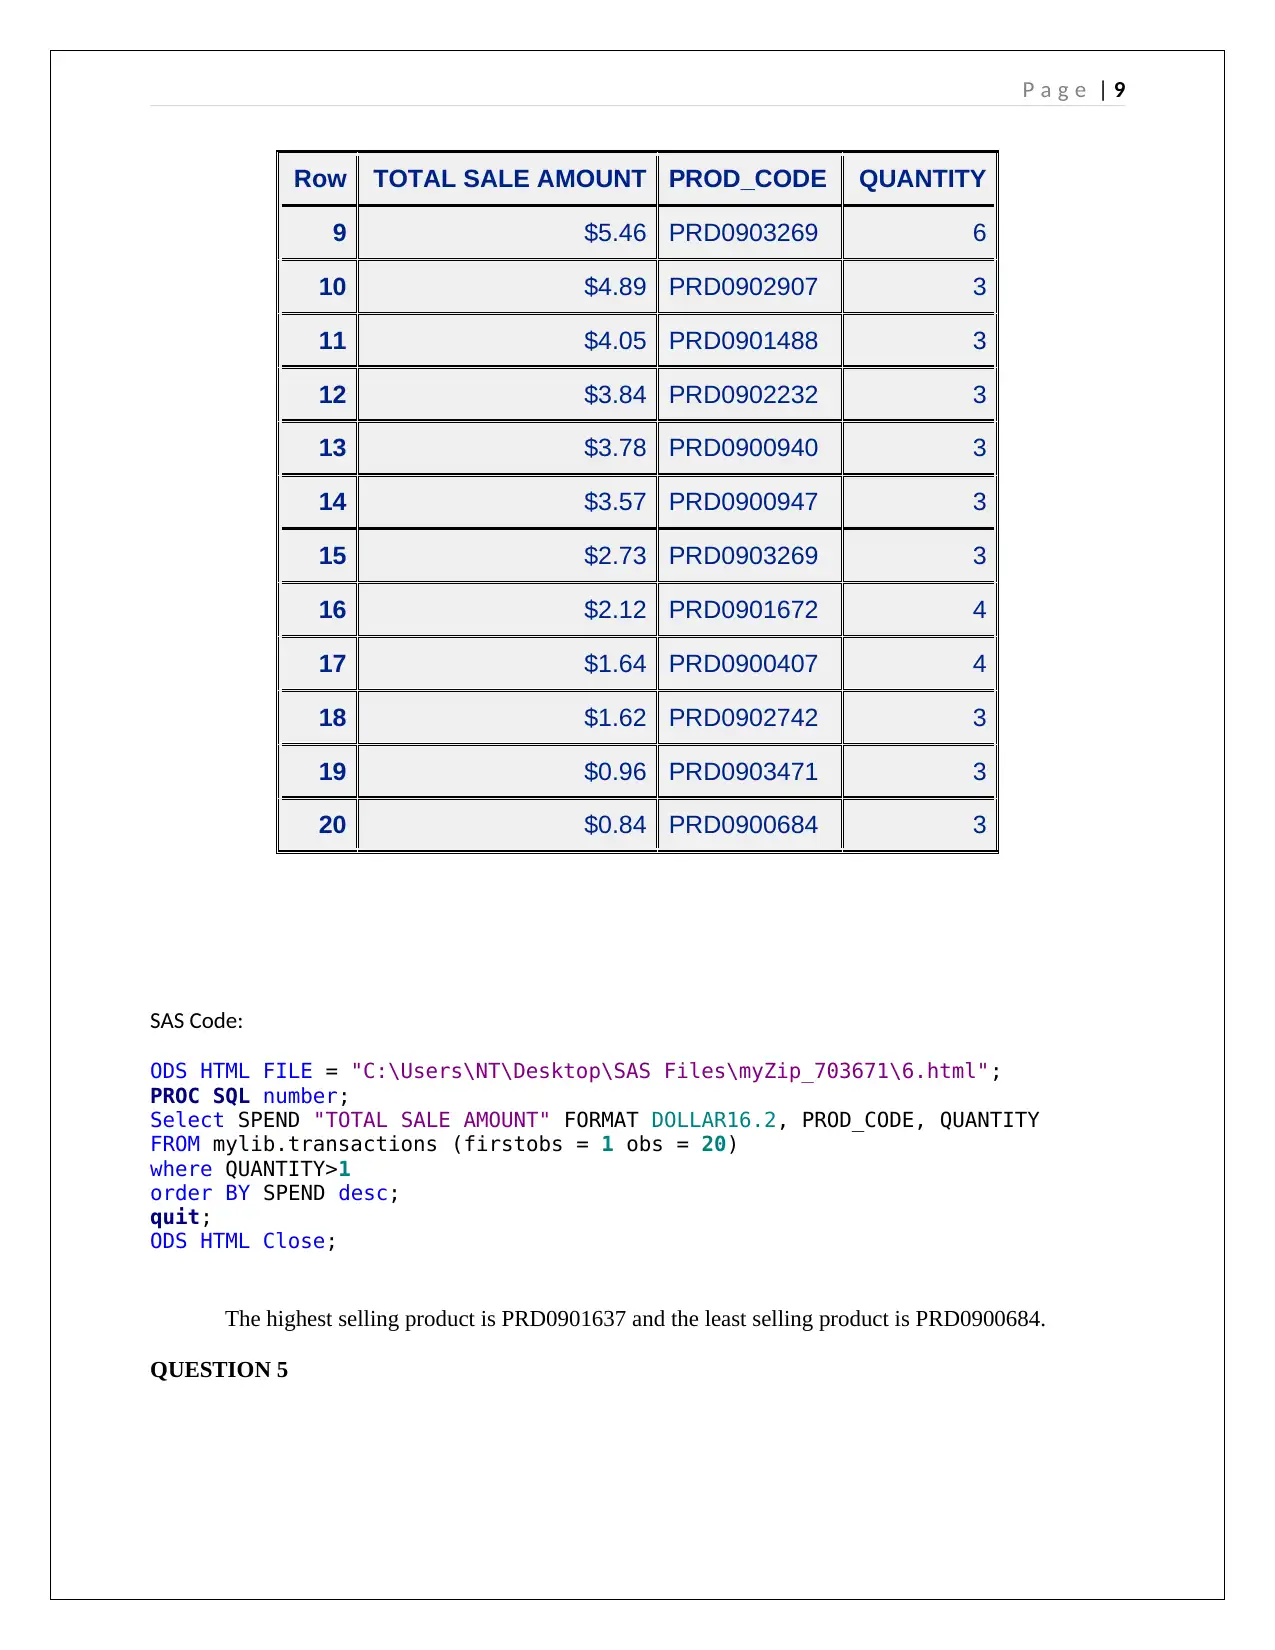
First 20 products that have the highest sales in value where more than 1 item was sold
Row TOTAL SALE AMOUNT PROD_CODE QUANTITY
1 $13.14 PRD0901637 9
2 $11.13 PRD0902765 3
3 $9.63 PRD0900508 3
4 $8.64 PRD0902163 3
5 $6.60 PRD0904911 3
6 $6.39 PRD0904806 3
7 $5.79 PRD0901512 3
8 $5.46 PRD0904461 3
SAS Code:
ODS HTML FILE = "C:\Users\NT\Desktop\SAS Files\myZip_703671\5.html";
PROC SQL;
SELECT SUM(QUANTITY) "Total QTY", SUM(SPEND) "TOTAL SALE AMOUNT" FORMAT
DOLLAR16.2, BASKET_DOMINANT_MISSION "PRODUCT CATEGORY", STORE_STATE
FROM mylib.transactions
GROUP BY BASKET_DOMINANT_MISSION, STORE_STATE;
QUIT;
ODS HTML Close;
It can be seen that the highest selling product is Fresh and it is highest in the state of Victoria
followed by mixed product category which is also highest in the state of Victoria i.e. VIC. The least
selling states are Tasmania i.e. TAS, Australian Capital Territory and West Australia. Thus, the retailer
has to vehemently focus in these areas.
QUESTION 4
First 20 products that have the highest sales in value where more than 1 item was sold
Row TOTAL SALE AMOUNT PROD_CODE QUANTITY
1 $13.14 PRD0901637 9
2 $11.13 PRD0902765 3
3 $9.63 PRD0900508 3
4 $8.64 PRD0902163 3
5 $6.60 PRD0904911 3
6 $6.39 PRD0904806 3
7 $5.79 PRD0901512 3
8 $5.46 PRD0904461 3
P a g e | 9
Row TOTAL SALE AMOUNT PROD_CODE QUANTITY
9 $5.46 PRD0903269 6
10 $4.89 PRD0902907 3
11 $4.05 PRD0901488 3
12 $3.84 PRD0902232 3
13 $3.78 PRD0900940 3
14 $3.57 PRD0900947 3
15 $2.73 PRD0903269 3
16 $2.12 PRD0901672 4
17 $1.64 PRD0900407 4
18 $1.62 PRD0902742 3
19 $0.96 PRD0903471 3
20 $0.84 PRD0900684 3
SAS Code:
ODS HTML FILE = "C:\Users\NT\Desktop\SAS Files\myZip_703671\6.html";
PROC SQL number;
Select SPEND "TOTAL SALE AMOUNT" FORMAT DOLLAR16.2, PROD_CODE, QUANTITY
FROM mylib.transactions (firstobs = 1 obs = 20)
where QUANTITY>1
order BY SPEND desc;
quit;
ODS HTML Close;
The highest selling product is PRD0901637 and the least selling product is PRD0900684.
QUESTION 5
⊘ This is a preview!⊘
Do you want full access?
Subscribe today to unlock all pages.
Trusted by 1+ million students worldwide
P a g e | 10
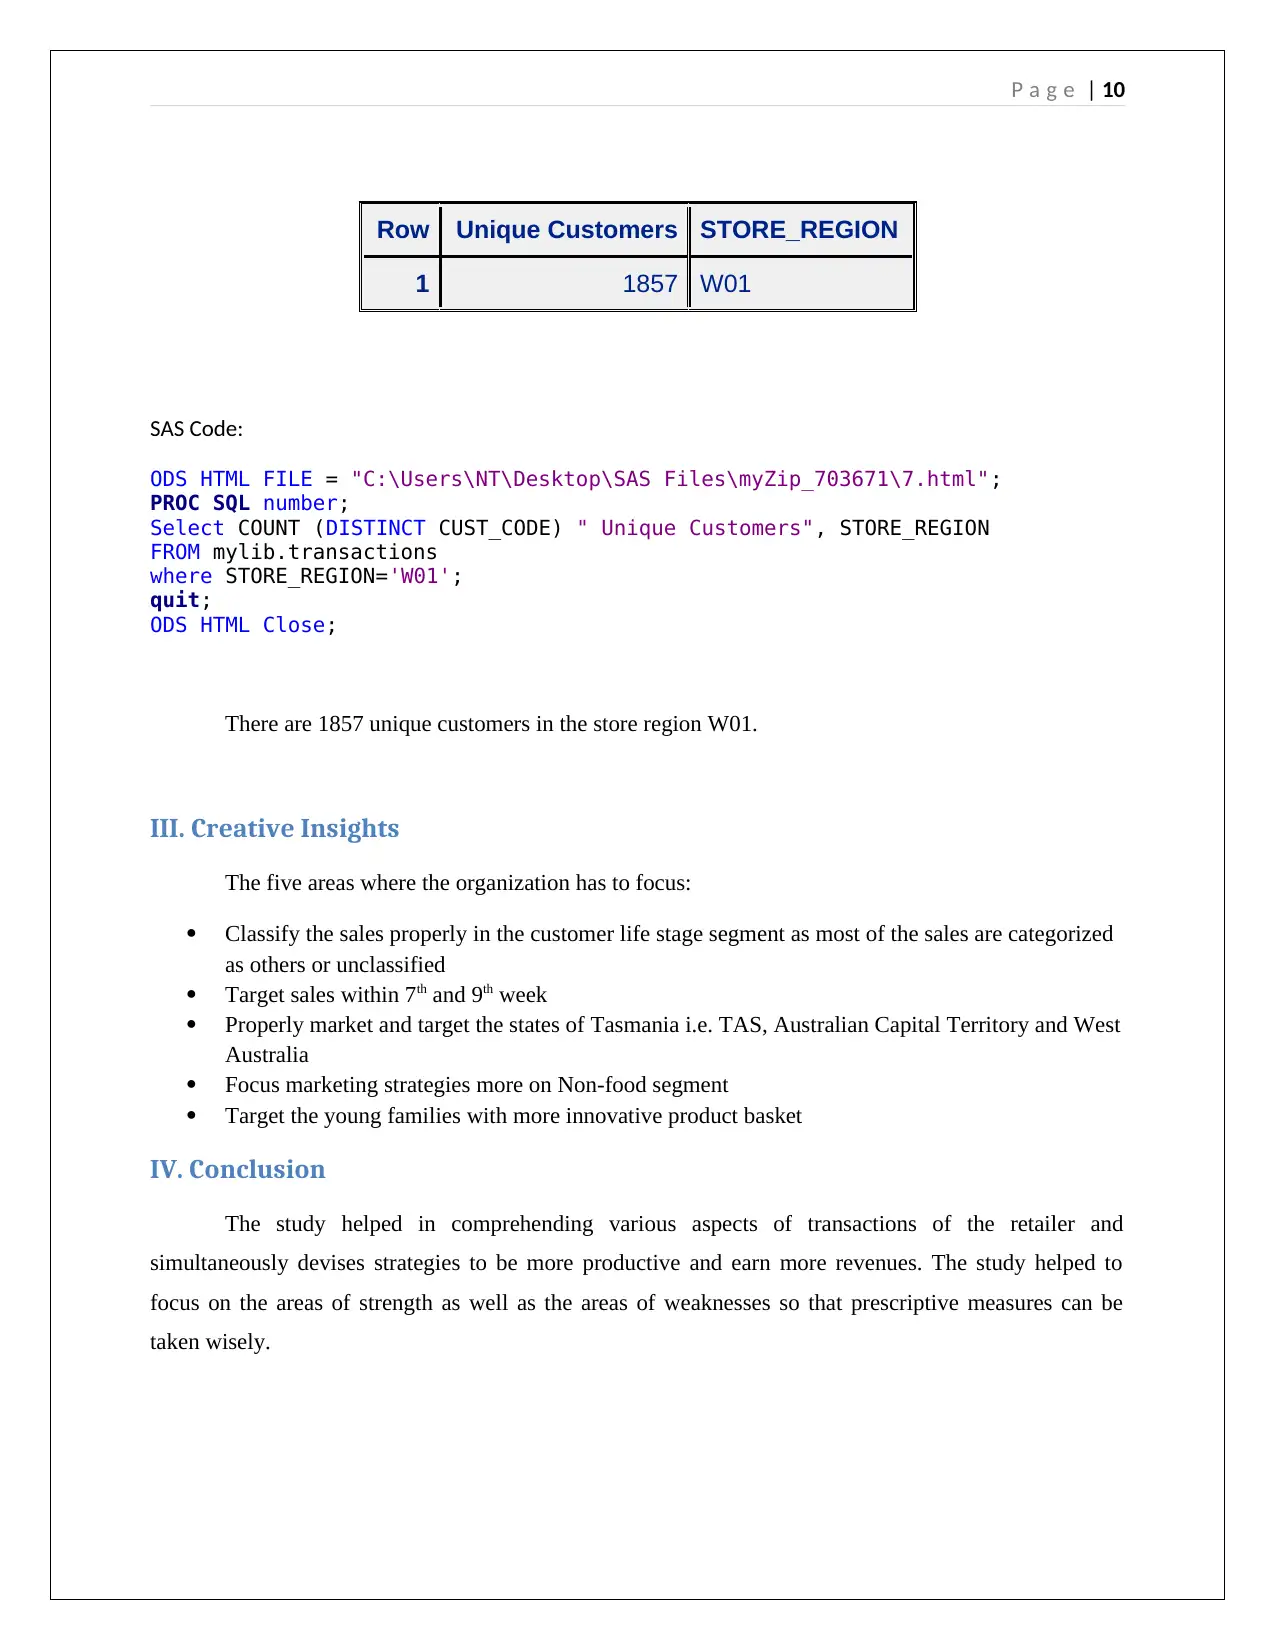
Row Unique Customers STORE_REGION
1 1857 W01
SAS Code:
ODS HTML FILE = "C:\Users\NT\Desktop\SAS Files\myZip_703671\7.html";
PROC SQL number;
Select COUNT (DISTINCT CUST_CODE) " Unique Customers", STORE_REGION
FROM mylib.transactions
where STORE_REGION='W01';
quit;
ODS HTML Close;
There are 1857 unique customers in the store region W01.
III. Creative Insights
The five areas where the organization has to focus:
Classify the sales properly in the customer life stage segment as most of the sales are categorized
as others or unclassified
Target sales within 7th and 9th week
Properly market and target the states of Tasmania i.e. TAS, Australian Capital Territory and West
Australia
Focus marketing strategies more on Non-food segment
Target the young families with more innovative product basket
IV. Conclusion
The study helped in comprehending various aspects of transactions of the retailer and
simultaneously devises strategies to be more productive and earn more revenues. The study helped to
focus on the areas of strength as well as the areas of weaknesses so that prescriptive measures can be
taken wisely.
Paraphrase This Document
Need a fresh take? Get an instant paraphrase of this document with our AI Paraphraser
P a g e | 11
Appendix
SAS Codes
QUESTION 1
ODS HTML FILE = "C:\Users\NT\Desktop\SAS Files\myZip_703671\3.html";
PROC SQL;
SELECT SHOP_WEEK, SUM(SPEND) "TOTAL SPEND" FORMAT DOLLAR16.2
FROM mylib.transactions
GROUP BY SHOP_WEEK;
QUIT;
ODS HTML Close;
QUESTION 2
ODS HTML FILE = "C:\Users\NT\Desktop\SAS Files\myZip_703671\4.html";
PROC SQL;
SELECT CUST_LIFESTAGE, SUM(SPEND) "TOTAL SPEND" FORMAT DOLLAR16.2
FROM mylib.transactions
GROUP BY CUST_LIFESTAGE;
ORDER BY CUST_LIFESTAGE;
QUIT;
ODS HTML Close;
QUESTION 3
ODS HTML FILE = "C:\Users\NT\Desktop\SAS Files\myZip_703671\5.html";
PROC SQL;
SELECT SUM(QUANTITY) "Total QTY", SUM(SPEND) "TOTAL SALE AMOUNT" FORMAT
DOLLAR16.2, BASKET_DOMINANT_MISSION "PRODUCT CATEGORY", STORE_STATE
FROM mylib.transactions
GROUP BY BASKET_DOMINANT_MISSION, STORE_STATE;
QUIT;
ODS HTML Close;
QUESTION 4
ODS HTML FILE = "C:\Users\NT\Desktop\SAS Files\myZip_703671\6.html";
PROC SQL number;
Select SPEND "TOTAL SALE AMOUNT" FORMAT DOLLAR16.2, PROD_CODE, QUANTITY
FROM mylib.transactions (firstobs = 1 obs = 20)
where QUANTITY>1
order BY SPEND desc;
quit;
ODS HTML Close;
P a g e | 12
QUESTION 5
ODS HTML FILE = "C:\Users\NT\Desktop\SAS Files\myZip_703671\7.html";
PROC SQL number;
Select COUNT (DISTINCT CUST_CODE) " Unique Customers", STORE_REGION
FROM mylib.transactions
where STORE_REGION='W01';
quit;
ODS HTML Close;
QUESTION 5
ODS HTML FILE = "C:\Users\NT\Desktop\SAS Files\myZip_703671\7.html";
PROC SQL number;
Select COUNT (DISTINCT CUST_CODE) " Unique Customers", STORE_REGION
FROM mylib.transactions
where STORE_REGION='W01';
quit;
ODS HTML Close;
⊘ This is a preview!⊘
Do you want full access?
Subscribe today to unlock all pages.
Trusted by 1+ million students worldwide
1 out of 12
Your All-in-One AI-Powered Toolkit for Academic Success.
+13062052269
info@desklib.com
Available 24*7 on WhatsApp / Email
![[object Object]](/_next/static/media/star-bottom.7253800d.svg)
Unlock your academic potential
Copyright © 2020–2026 A2Z Services. All Rights Reserved. Developed and managed by ZUCOL.