Supply Chain Strategy and Cost Analysis for ABC Company
VerifiedAdded on 2022/09/28
|10
|2078
|22
Report
AI Summary
This report presents an analysis of ABC Company's US supply chain, focusing on its distribution network and cost structure. The report begins by mapping the current supply chain, illustrating the flow of goods from China and Taiwan to the US, through ports in Seattle and Los Angeles, and then to a central distribution center in Kansas before reaching various warehouses. The report then calculates the annual running costs of this system, considering processing, freight, and quality control expenses. A proposed alternative supply chain map is then introduced, which reconfigures the distribution flow to potentially reduce costs. The report then compares the costs of the current and proposed systems, evaluating the potential savings and the impact of incorporating additional distribution centers. Finally, the report discusses other supply chain strategies that can be incorporated to improve the design, along with factors that have not been considered in moving to the new supply chain configurations.
1
SUPPLY CHAIN STRATEGIES
SUPPLY CHAIN STRATEGY
NAME OF STUDENT
NAME OF UNIVERSITY
SUPPLY CHAIN STRATEGIES
SUPPLY CHAIN STRATEGY
NAME OF STUDENT
NAME OF UNIVERSITY
Paraphrase This Document
Need a fresh take? Get an instant paraphrase of this document with our AI Paraphraser
2
SUPPLY CHAIN STRATEGIES
Q1.
Supply map.
(Supply Chain Mapping,2019)
Legend
Ocean freight
Rail freight
Road /trucks
WKC Kansas City Warehouse
WG Greenville Warehouse
WC Cleveland Warehouse
WL Los Angeles Warehouse
WD Dallas Warehouse
WM Memphis Warehouse
WNJ New Jersey Warehouse
WJ Jacksonville Warehouse
WCI Chicago Warehouse
In this supply map which is a vertical supply model (Box Around The World,2019), freight is
moving from the four ports in China and Taiwan to the two ports in US. The two ports Seattle and
Los Angeles will receive 35% and 65 of the products respectively. From the two ports the products
are processed for customs and are then loaded to rail truck and destined to Kansas City warehouse.
The Kansas City warehouse which is the quality control center and distribution center for the other
nine warehouses. Distribution from Kansas City to other warehouses is through road. (“Supply
Chain Management and Logistics | Introduction to Business”,2019)
Annual running cost of this system is tabulated as below.
Step 1
Variable processing cost in Seattle and Los Angeles at
$5 CBM
3
SUPPLY CHAIN STRATEGIES
Port Name Port share of volume of 190 000 CBM Cost at $5 CBM
Seattle 35% of 190 000 66 500 332 500,00
Los Angeles 65% of 190 000 123 500 617 500,00
Total cost of processing in both US
ports 950 000,00
Step 2
Freight rail cost from Seattle and Los Angeles to Kansas
@ $0,002 CBM
Miles Volume CBM Total cost
Distance from Seattle to
Kansas 1 870 66 500 248 710,00
Distance from Los
Angeles to Kansas 1 620 123 500 400 140,00
Total cost of transport to Kansas 648 850,00
Step 3.
To get the cost of quality control
checks in Kansas at $3 CBM.
Volume Cost Total cost
190000 3,00 570 000,00
Step 4.
To get the cost of freight from Kansas to all warehouses at $0,025 CBM per mile
City
Kansas
City
Clevelan
d
New
Jersey
Jacksonvill
e Chicago
Greenvill
e Memphis Dallas
Los
Angeles
Deman
d
20
900,00 17 100,00
24
700,00 15 200,00
22
800,00
15
200,00
17
100,00
22
800,00 34 200,00
Distanc
e from
Kansas - 800 1200 1150 520 940 510 500 1620
Cost -
342
000,00
741
000,00
437
000,00
296
400,00
357
200,00
218
025,00
285
000,00
1 385
100,00
Total cost of freight to
warehouses 4 061 725,00
Total running cost of the system is the sum of all total costs from step 1 to step 4 which is
$ 6 230 575,00
⊘ This is a preview!⊘
Do you want full access?
Subscribe today to unlock all pages.
Trusted by 1+ million students worldwide
4
SUPPLY CHAIN STRATEGIES
Q2.
Proposed supply chain map
In this supply map, freight is moving from the four ports in China and Taiwan to the two ports in
US. The two ports Seattle and Los Angeles will receive 35% and 65 of the products respectively.
From the two ports the products are processed for customs and are then loaded to rail truck. Seattle
cargo is routed to Los Angeles distribution center which is also the quality control center. The Los
Angeles warehouse will retain their share of requirements and the rest is shipped to Kansa for
onward distribution to the other seven warehouses (“Six Key Trends Changing the Supply Chain
Management Today”,2019)
Step 1
Variable processing cost in Seattle and Los Angeles at $5 CBM
Port Name
Port share of volume of 190 000
CBM
Seattle 35% 66 500 332 500,00
Los Angeles 65% 123 500 617 500,00
Total cost of processing in both
US ports
950
000,00
Step 2
Freight rail cost from Seattle to Los Angeles and Los Angeles to Kansas @ $0,002
CBM
The volume from Los Angeles to Kansas will be less the requirements of Los Angeles
of 18%
Or 34,200 CBM.
Miles
Volume
CBM Total cost
Distance from Seattle to Los
Angeles
1
140 66 500 151 620,00
Distance from Los Angeles to
Kansas
1
620 155 800 504 792,00
Total cost of transport to Kansas and Los 656 412,00
Paraphrase This Document
Need a fresh take? Get an instant paraphrase of this document with our AI Paraphraser
5
SUPPLY CHAIN STRATEGIES
Angeles
Step 3
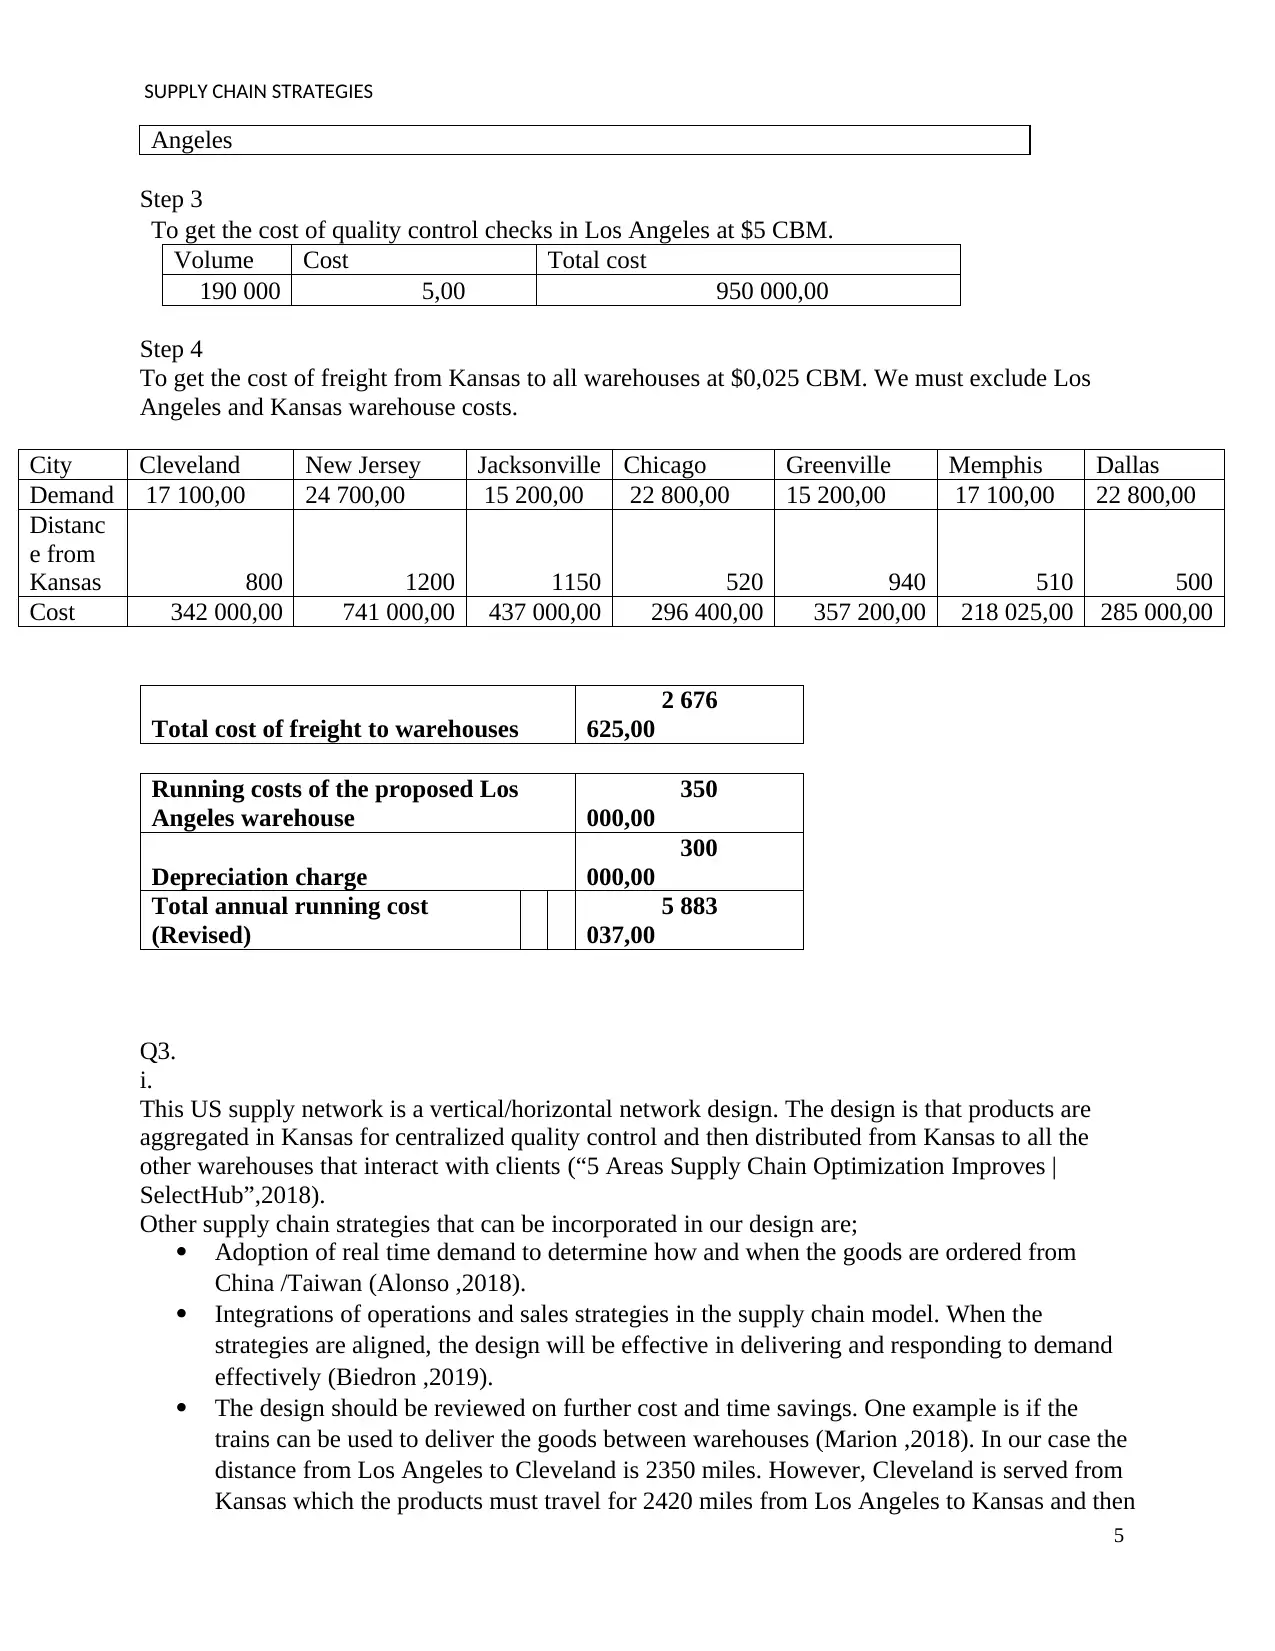
To get the cost of quality control checks in Los Angeles at $5 CBM.
Volume Cost Total cost
190 000 5,00 950 000,00
Step 4
To get the cost of freight from Kansas to all warehouses at $0,025 CBM. We must exclude Los
Angeles and Kansas warehouse costs.
City Cleveland New Jersey Jacksonville Chicago Greenville Memphis Dallas
Demand 17 100,00 24 700,00 15 200,00 22 800,00 15 200,00 17 100,00 22 800,00
Distanc
e from
Kansas 800 1200 1150 520 940 510 500
Cost 342 000,00 741 000,00 437 000,00 296 400,00 357 200,00 218 025,00 285 000,00
Total cost of freight to warehouses
2 676
625,00
Running costs of the proposed Los
Angeles warehouse
350
000,00
Depreciation charge
300
000,00
Total annual running cost
(Revised)
5 883
037,00
Q3.
i.
This US supply network is a vertical/horizontal network design. The design is that products are
aggregated in Kansas for centralized quality control and then distributed from Kansas to all the
other warehouses that interact with clients (“5 Areas Supply Chain Optimization Improves |
SelectHub”,2018).
Other supply chain strategies that can be incorporated in our design are;
Adoption of real time demand to determine how and when the goods are ordered from
China /Taiwan (Alonso ,2018).
Integrations of operations and sales strategies in the supply chain model. When the
strategies are aligned, the design will be effective in delivering and responding to demand
effectively (Biedron ,2019).
The design should be reviewed on further cost and time savings. One example is if the
trains can be used to deliver the goods between warehouses (Marion ,2018). In our case the
distance from Los Angeles to Cleveland is 2350 miles. However, Cleveland is served from
Kansas which the products must travel for 2420 miles from Los Angeles to Kansas and then
SUPPLY CHAIN STRATEGIES
Angeles
Step 3
To get the cost of quality control checks in Los Angeles at $5 CBM.
Volume Cost Total cost
190 000 5,00 950 000,00
Step 4
To get the cost of freight from Kansas to all warehouses at $0,025 CBM. We must exclude Los
Angeles and Kansas warehouse costs.
City Cleveland New Jersey Jacksonville Chicago Greenville Memphis Dallas
Demand 17 100,00 24 700,00 15 200,00 22 800,00 15 200,00 17 100,00 22 800,00
Distanc
e from
Kansas 800 1200 1150 520 940 510 500
Cost 342 000,00 741 000,00 437 000,00 296 400,00 357 200,00 218 025,00 285 000,00
Total cost of freight to warehouses
2 676
625,00
Running costs of the proposed Los
Angeles warehouse
350
000,00
Depreciation charge
300
000,00
Total annual running cost
(Revised)
5 883
037,00
Q3.
i.
This US supply network is a vertical/horizontal network design. The design is that products are
aggregated in Kansas for centralized quality control and then distributed from Kansas to all the
other warehouses that interact with clients (“5 Areas Supply Chain Optimization Improves |
SelectHub”,2018).
Other supply chain strategies that can be incorporated in our design are;
Adoption of real time demand to determine how and when the goods are ordered from
China /Taiwan (Alonso ,2018).
Integrations of operations and sales strategies in the supply chain model. When the
strategies are aligned, the design will be effective in delivering and responding to demand
effectively (Biedron ,2019).
The design should be reviewed on further cost and time savings. One example is if the
trains can be used to deliver the goods between warehouses (Marion ,2018). In our case the
distance from Los Angeles to Cleveland is 2350 miles. However, Cleveland is served from
Kansas which the products must travel for 2420 miles from Los Angeles to Kansas and then
6
SUPPLY CHAIN STRATEGIES
to Cleveland. The distance is not significant but if we used train to deliver the goods to
Cleveland from Los Angeles, the savings can be considered.
The new strategy of having Los Angeles as another distribution center is justified as the costs for
the new system will be lower ((“What Is Supply Chain Management Strategy? | HCL
Technologies”,2019). This is as tabulated in question 1 and 2.
Total annual cost (Proposed) 5 883 037,00
Total annual cost 6 230 575,00
Savings from change in strategy 347 538,00
The savings from annual running costs are $ 347 538,00
If we compare this with the investment of $1 500 000 that is required to achieve this savings, then
my conclusion is that it is worthwhile to invest in the change of strategy (Wang et al.,2019. The
cost $1,5m which can be depreciated over 5 years will give an annual cost of $300 000 .
The strategy still returns a savings of $347 538,00.
ii.
If there was an additional distribution center in Seattle, I would require the running costs of the
Seattle warehouse and investment in the new facility. However, Seattle is on average the farthest
from each of the warehouse. After quality control is done is done in Seattle all the products have to
be routed to Kansas. This will mean the cost of transfer will be compensated by the transfer by rail
to Kansas. From my assumption of the running cost being $350 000 and investment of $1 500 000 .
The investment can be prorated at five years giving us a depreciation of $300 000. So, the
proposition of Seattle being an extra distribution point will only increase costs to $6 414 667
.This strategy is the most expensive and should not be considered (Morris ,2019).
iii.
Factors that have not been considered in moving to the new supply chain configurations are;
a) There are hidden costs in any move that only manifest when moving. Such are relocation
expenses of the human resources, regulatory requirements of setting up and operating in a
new location and cost of general resistance to change from company culture perspective.
These costs can be high when unforeseen challenges crop up.
New human resources may have to be hired and retrained. The regulatory requirements may
make the company incur higher than expected costs.
b) The supply chain strategy impacts the operations and sales value chain adversely. The
current supply chain may be well suited and aligned with operations and sale. The change
in strategy may affect operations and this will lead to challenges in delivering the customer
promise which will impact sales.
⊘ This is a preview!⊘
Do you want full access?
Subscribe today to unlock all pages.
Trusted by 1+ million students worldwide
7
SUPPLY CHAIN STRATEGIES
c) The company may not have the resources whether capital or technical expertise to effect the
change. This may lead to a not so well-done change which can lead the company not
meeting its targets.
d) The strategy may face resistance if the staff think it will impact them negatively. change in
distribution centre may have staff thinking their jobs are in line and the same staff may
sabotage the company operations
e) The staff and stakeholders will need to be trained and properly communicated on the
impending changes to avoid misunderstanding when the change is being affected
(Ahmed,2018).
Paraphrase This Document
Need a fresh take? Get an instant paraphrase of this document with our AI Paraphraser
8
SUPPLY CHAIN STRATEGIES
References
5 Areas Supply Chain Optimization Improves | SelectHub 2018, Selecthub.com, viewed 16 August
2019, <https://selecthub.com/supply-chain-management/5-areas-supply-chain-optimization-
improves/>.
Ahmed, M 2018, Muddassirism, SCMDojo, viewed 16 August 2019, <http://www.scmdojo.com/8-
must-have-supply-chain-competencies/>.
Alonso, M 2018, 10 Ways to Improve Your Supply Chain Strategy | CompuData, Inc. -
Philadelphia Cloud IT Provider, CompuData, Inc. - Philadelphia Cloud IT Provider.
Biedron, R 2019, Ways to Improve Your Supply Chain Management | PurchaseControl Software,
PurchaseControl Software.
Box Around The World 2019, Understanding the Different Types of Supply Chain Models, Box
Around The World, viewed 16 August 2019, <https://boxaroundtheworld.com/supply-chain-
modeling-101/>.
CARTO 2017, What is Supply Chain Network Design and How Does It Work?, Carto.com, viewed
16 August 2019, <https://carto.com/blog/what-is-supply-chain-network-design-how-does-it-work/
>.
Luc Kremers 2017, Supply Chain Network Design, This Complex World, viewed 16 August 2019,
<https://www.thiscomplexworld.com/supply-chain-network-design/>.
Marion, G 2018, 7 Ways To Optimize Your End-to-End Supply Chain, viewed 7 November 2018,
<https://www.thebalancesmb.com/optimize-end-to-end-supply-chain-4022954>.
Morris, J 2017, The Top 10 Supply Chain Improvement Strategies, Multichannel Merchant,
Multichannel Merchant, viewed 16 August 2019,
<https://multichannelmerchant.com/operations/the-top-10-supply-chain-improvement-strategies/>.
Rob,M 2018, Smarter With Gartner, Gartner.com, viewed 16 August 2019,
<https://www.gartner.com/smarterwithgartner/3-steps-to-a-digital-supply-chain/>.
9
SUPPLY CHAIN STRATEGIES
Chopra, S & Meindl, P 2016, Supply Chain Management: Strategy, Planning, and Operation. 6th
edn, Pearson Education, Essex, NE.
Supply & Demand Chain Executive. (2006). Six Key Trends Changing the Supply Chain
Management Today. [online] Available at:
https://www.sdcexec.com/sourcing-procurement/news/10358095/six-key-trends-changing-the-
supply-chain-management-today [Accessed 16 Aug. 2019].
Supply Chain Mapping 2019, Supply Chain Mapping, Supply Chain Mapping, viewed 16 August
2019, <https://www.sourcemap.com/>.
The Next 5 Years Will Change Supply Chain Management | GlobeCon 2018, GlobeCon Freight,
viewed 16 August 2019, <http://www.globeconfreight.com/blog/next-5-years-will-change-supply-
chain-management/>.
Wang, F, Lai, X & Shi, N 2011, ‘A multi-objective optimization for green supply chain network
design’, Decision Support Systems, vol. 51, no. 2, pp. 262–269, viewed 16 August 2019,
<https://www.sciencedirect.com/science/article/pii/S0167923610002010.>.
Hcltech.com. (2019). What is Supply Chain Management Strategy? | HCL Technologies. [online]
Available at: https://www.hcltech.com/technology-qa/what-is-supply-chain-management-strategy
[Accessed 16 Aug. 2019].
⊘ This is a preview!⊘
Do you want full access?
Subscribe today to unlock all pages.
Trusted by 1+ million students worldwide
1
0
SUPPLY CHAIN STRATEGIES
0
SUPPLY CHAIN STRATEGIES
1 out of 10


Your All-in-One AI-Powered Toolkit for Academic Success.
+13062052269
info@desklib.com
Available 24*7 on WhatsApp / Email
![[object Object]](/_next/static/media/star-bottom.7253800d.svg)
Unlock your academic potential
Copyright © 2020–2026 A2Z Services. All Rights Reserved. Developed and managed by ZUCOL.