Comparative Analysis of Absorption and Marginal Costing for JJB Sports

Verified

Added on  2020/12/09

|5
|1141
|330
Report
AI Summary
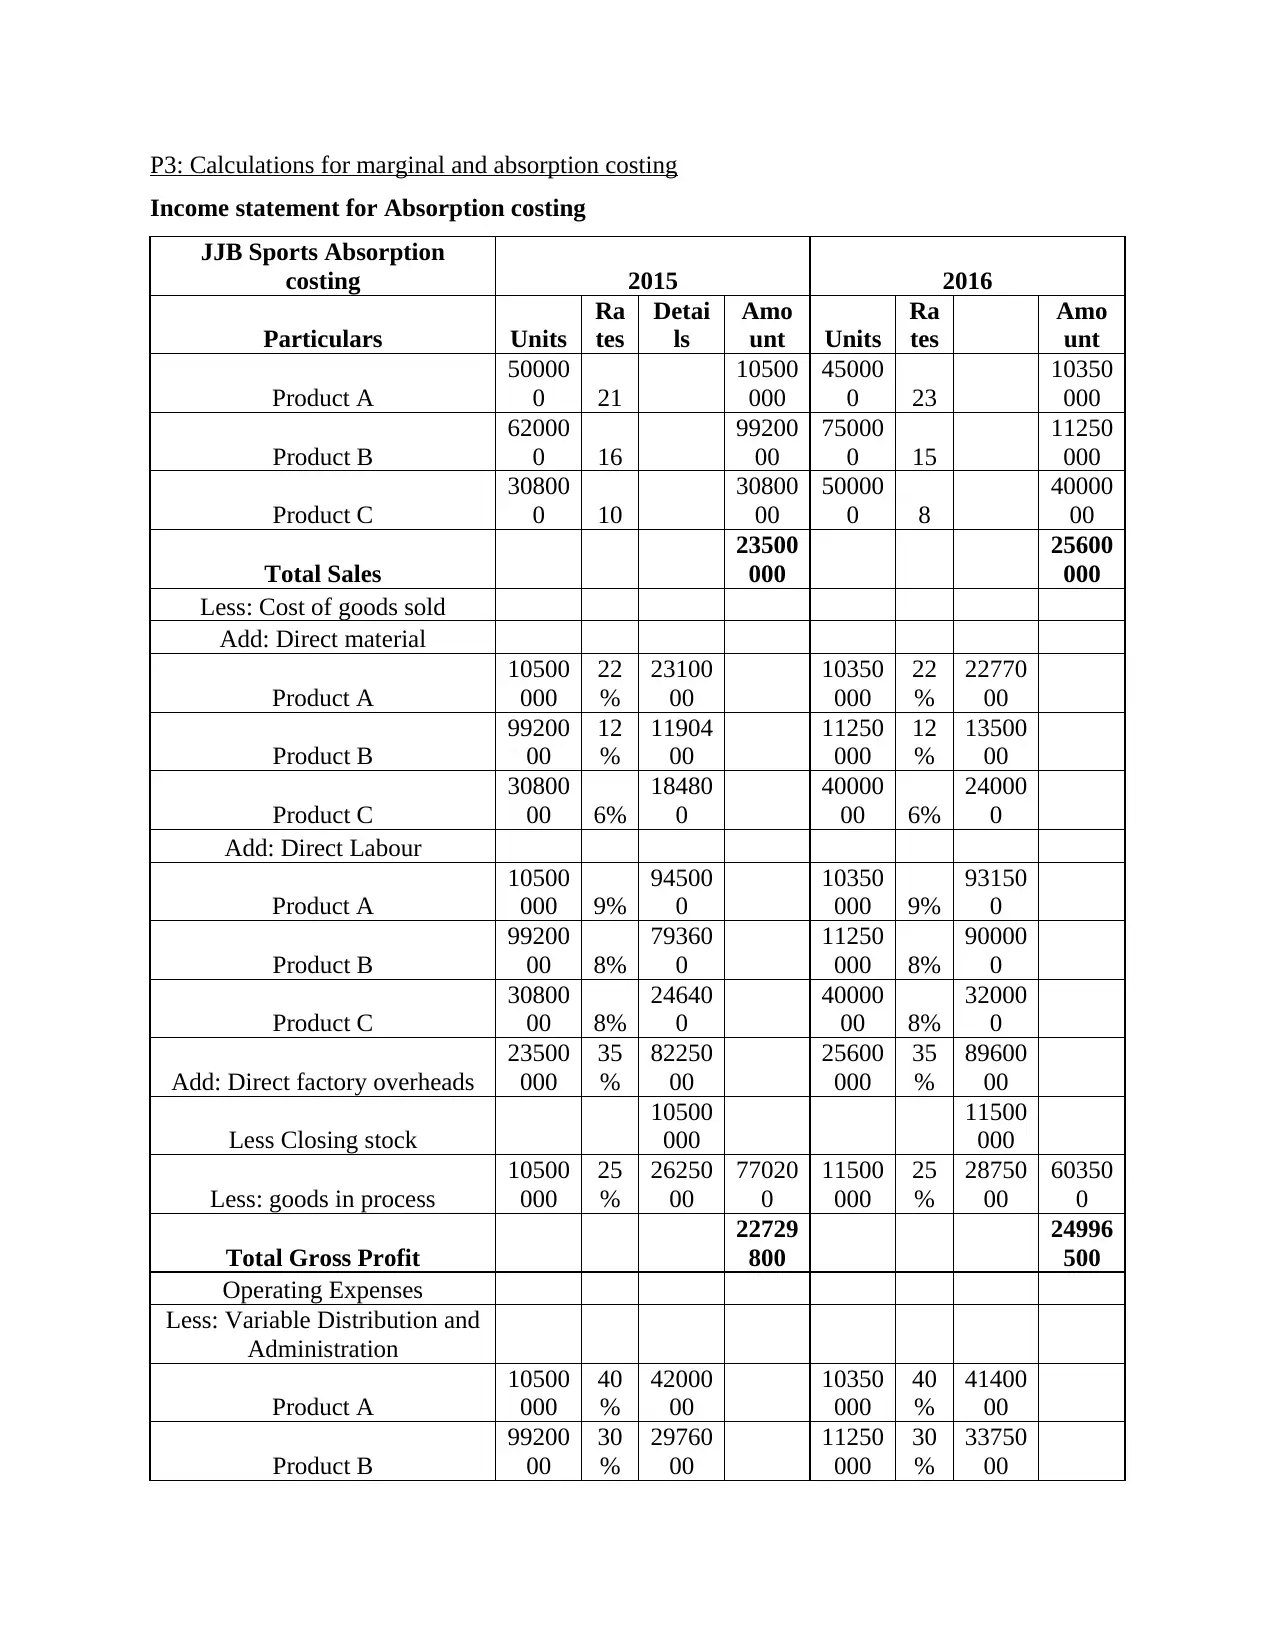
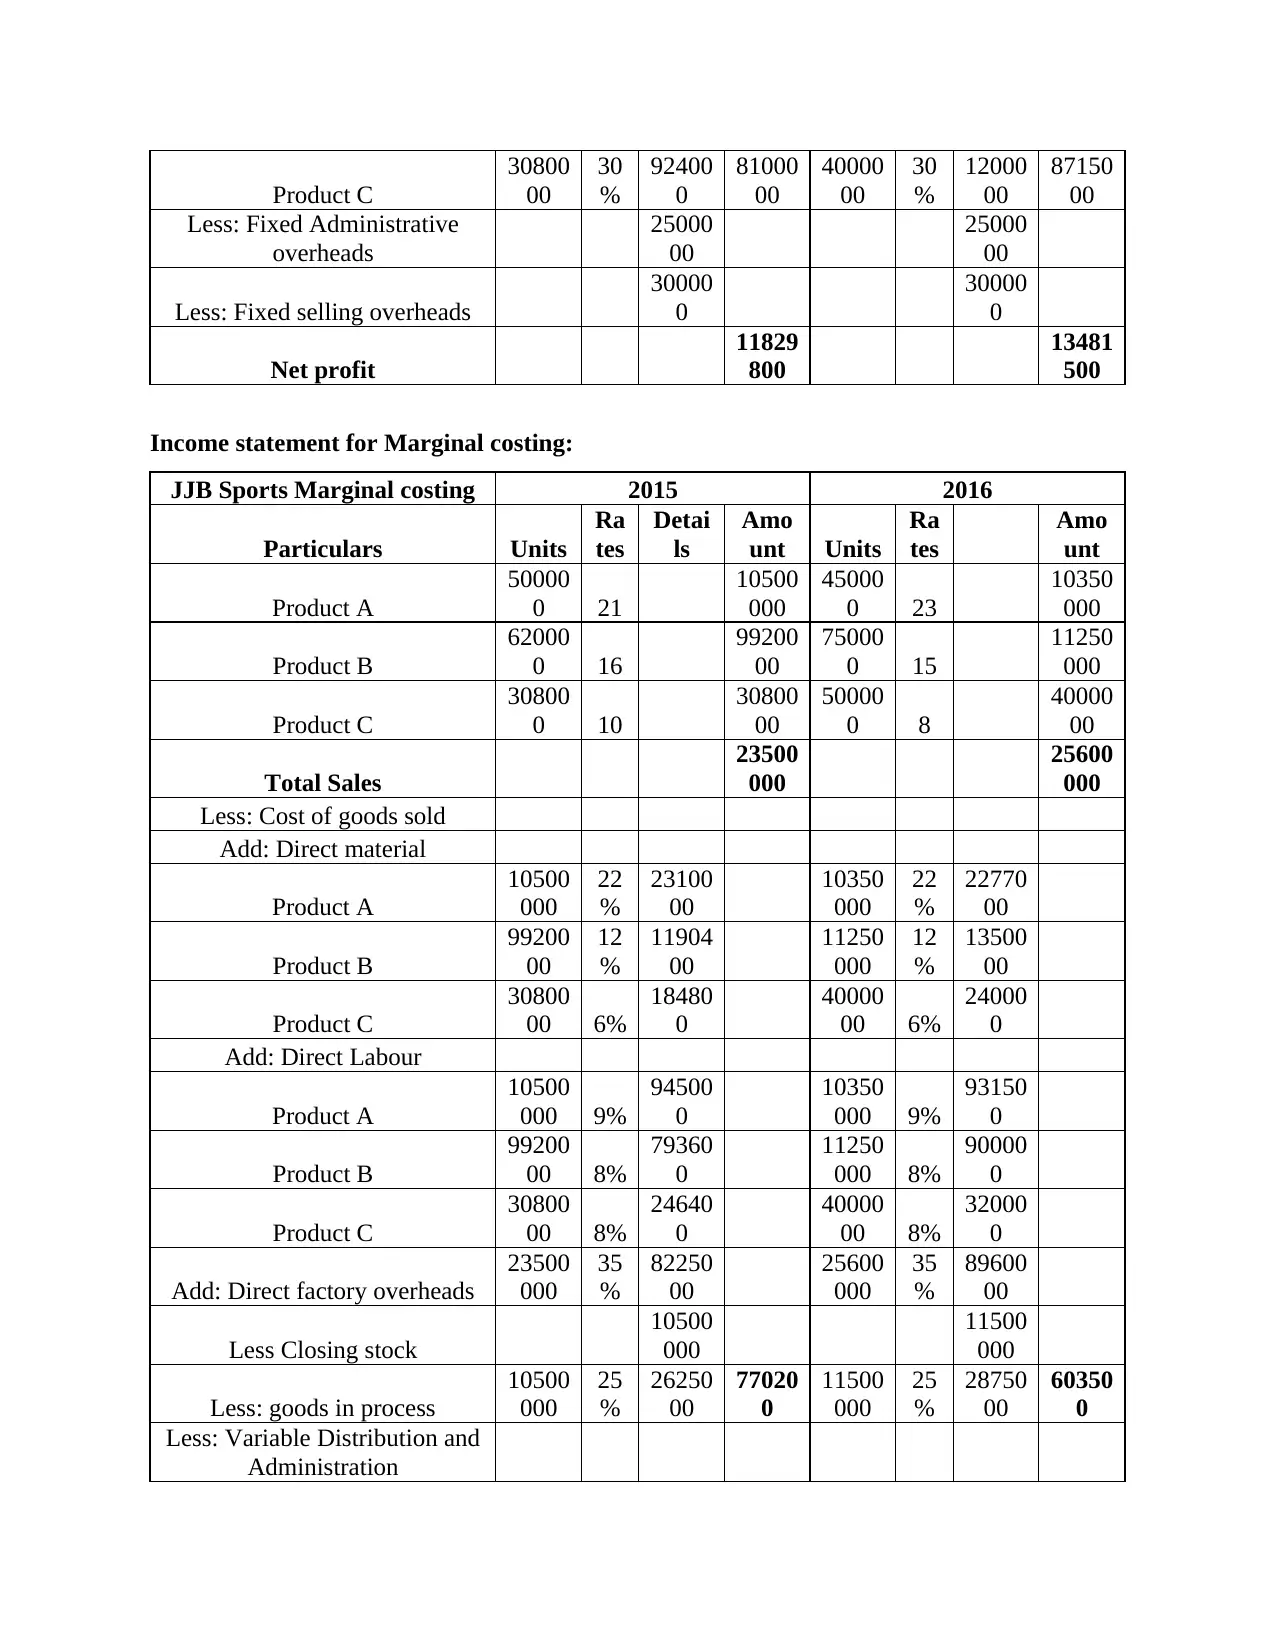
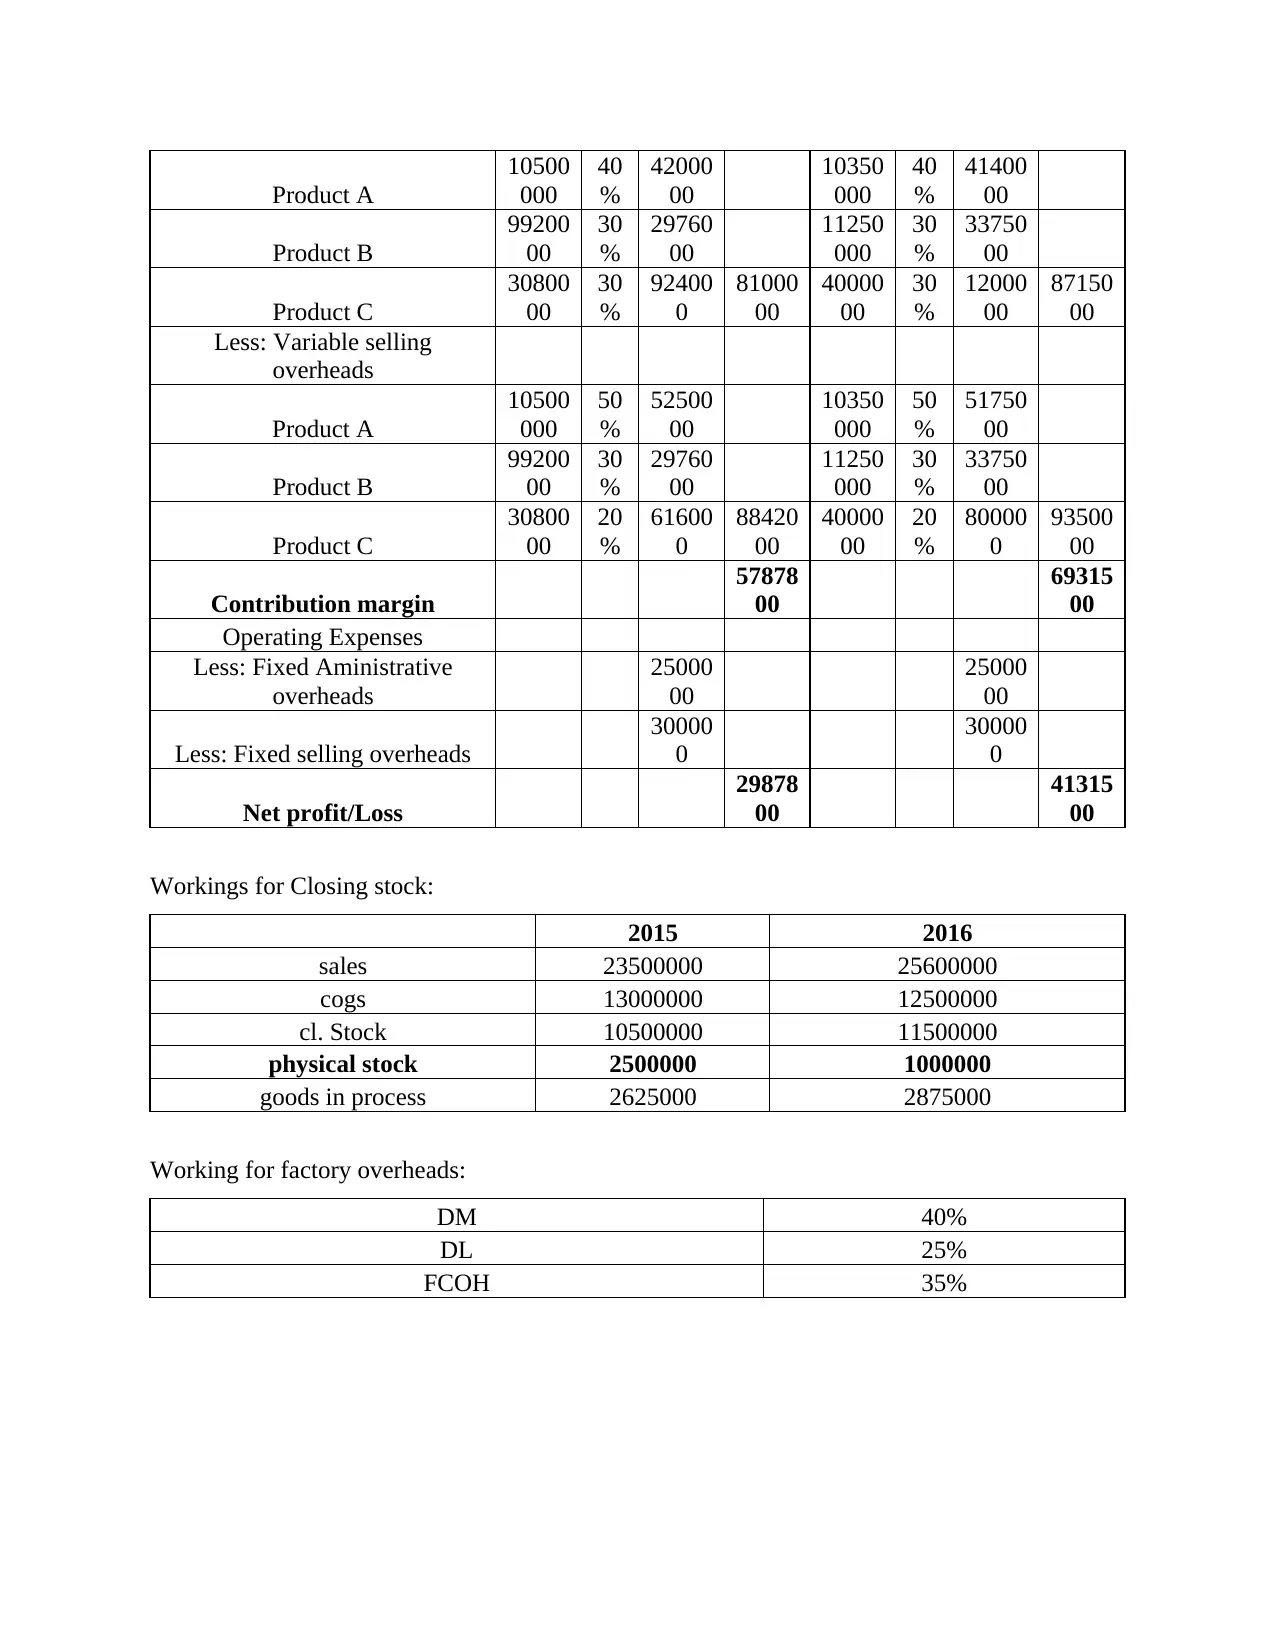
This report presents a comparative analysis of absorption and marginal costing methods, utilizing the financial data of JJB Sports for the years 2015 and 2016. The report begins with income statements prepared under both costing methods, detailing sales, cost of goods sold, direct materials, direct labor, factory overheads, and operating expenses. The analysis further breaks down the calculation of gross profit, contribution margin, and net profit under each method. The document includes detailed workings for closing stock and factory overheads. The report highlights the differences in profit calculation arising from the treatment of fixed manufacturing overheads, offering insights into how each method impacts financial reporting and decision-making. The report covers variable and fixed costs, and explains the differences in the presentation of financial results.
Document Page
INCOME
STATEMENT
tabler-icon-diamond-filled.svg

Paraphrase This Document

Need a fresh take? Get an instant paraphrase of this document with our AI Paraphraser
Document Page
TABLE OF CONTENTS
P3: Calculations for marginal and absorption costing................................................................3
REFERENCES................................................................................................................................5
Document Page
P3: Calculations for marginal and absorption costing
Income statement for Absorption costing
JJB Sports Absorption
costing 2015 2016
Particulars Units
Ra
tes
Detai
ls
Amo
unt Units
Ra
tes
Amo
unt
Product A
50000
0 21
10500
000
45000
0 23
10350
000
Product B
62000
0 16
99200
00
75000
0 15
11250
000
Product C
30800
0 10
30800
00
50000
0 8
40000
00
Total Sales
23500
000
25600
000
Less: Cost of goods sold
Add: Direct material
Product A
10500
000
22
%
23100
00
10350
000
22
%
22770
00
Product B
99200
00
12
%
11904
00
11250
000
12
%
13500
00
Product C
30800
00 6%
18480
0
40000
00 6%
24000
0
Add: Direct Labour
Product A
10500
000 9%
94500
0
10350
000 9%
93150
0
Product B
99200
00 8%
79360
0
11250
000 8%
90000
0
Product C
30800
00 8%
24640
0
40000
00 8%
32000
0
Add: Direct factory overheads
23500
000
35
%
82250
00
25600
000
35
%
89600
00
Less Closing stock
10500
000
11500
000
Less: goods in process
10500
000
25
%
26250
00
77020
0
11500
000
25
%
28750
00
60350
0
Total Gross Profit
22729
800
24996
500
Operating Expenses
Less: Variable Distribution and
Administration
Product A
10500
000
40
%
42000
00
10350
000
40
%
41400
00
Product B
99200
00
30
%
29760
00
11250
000
30
%
33750
00
Document Page
Product C
30800
00
30
%
92400
0
81000
00
40000
00
30
%
12000
00
87150
00
Less: Fixed Administrative
overheads
25000
00
25000
00
Less: Fixed selling overheads
30000
0
30000
0
Net profit
11829
800
13481
500
Income statement for Marginal costing:
JJB Sports Marginal costing 2015 2016
Particulars Units
Ra
tes
Detai
ls
Amo
unt Units
Ra
tes
Amo
unt
Product A
50000
0 21
10500
000
45000
0 23
10350
000
Product B
62000
0 16
99200
00
75000
0 15
11250
000
Product C
30800
0 10
30800
00
50000
0 8
40000
00
Total Sales
23500
000
25600
000
Less: Cost of goods sold
Add: Direct material
Product A
10500
000
22
%
23100
00
10350
000
22
%
22770
00
Product B
99200
00
12
%
11904
00
11250
000
12
%
13500
00
Product C
30800
00 6%
18480
0
40000
00 6%
24000
0
Add: Direct Labour
Product A
10500
000 9%
94500
0
10350
000 9%
93150
0
Product B
99200
00 8%
79360
0
11250
000 8%
90000
0
Product C
30800
00 8%
24640
0
40000
00 8%
32000
0
Add: Direct factory overheads
23500
000
35
%
82250
00
25600
000
35
%
89600
00
Less Closing stock
10500
000
11500
000
Less: goods in process
10500
000
25
%
26250
00
77020
0
11500
000
25
%
28750
00
60350
0
Less: Variable Distribution and
Administration
tabler-icon-diamond-filled.svg

Paraphrase This Document

Need a fresh take? Get an instant paraphrase of this document with our AI Paraphraser
Document Page
Product A
10500
000
40
%
42000
00
10350
000
40
%
41400
00
Product B
99200
00
30
%
29760
00
11250
000
30
%
33750
00
Product C
30800
00
30
%
92400
0
81000
00
40000
00
30
%
12000
00
87150
00
Less: Variable selling
overheads
Product A
10500
000
50
%
52500
00
10350
000
50
%
51750
00
Product B
99200
00
30
%
29760
00
11250
000
30
%
33750
00
Product C
30800
00
20
%
61600
0
88420
00
40000
00
20
%
80000
0
93500
00
Contribution margin
57878
00
69315
00
Operating Expenses
Less: Fixed Aministrative
overheads
25000
00
25000
00
Less: Fixed selling overheads
30000
0
30000
0
Net profit/Loss
29878
00
41315
00
Workings for Closing stock:
2015 2016
sales 23500000 25600000
cogs 13000000 12500000
cl. Stock 10500000 11500000
physical stock 2500000 1000000
goods in process 2625000 2875000
Working for factory overheads:
DM 40%
DL 25%
FCOH 35%
chevron_up_icon
1 out of 5
circle_padding
hide_on_mobile
zoom_out_icon
[object Object]