Statistics Report: Analysis of ABZ Corporation Sales Data
VerifiedAdded on 2023/01/20
|11
|2116
|73
Report
AI Summary
This report presents a statistical analysis of ABZ Corporation's sales and customer data, encompassing 400 days of trading. The analysis focuses on several variables, including age, gender, amount of pay, products purchased, total gross sales, gross profit margins, and revenue. Descriptive statistics, such as measures of central tendency (mean, mode, standard deviation) and variation (range, quartiles, interquartile range), are used to summarize the data. The study compares product performance across different categories (DVD, CD, etc.) and analyzes customer spending patterns by gender. T-tests are used to compare age and amount of pay between genders. Key findings reveal that DVD is the top-selling product, and female customers spend more than males. Based on the analysis, recommendations are provided to improve sales and profit margins, such as focusing on the most profitable product (DVD) and targeting marketing strategies toward male customers.

STATISTICS
Paraphrase This Document
Need a fresh take? Get an instant paraphrase of this document with our AI Paraphraser
STATISTICS
Contents
INTRODUCTION.......................................................................................................................................3
PROBLEM DEFINITION AND BUSINESS INTELLIGENCE REQUIRED............................................4
VARIABLE DESCRIPTION......................................................................................................................4
DESCRIPTIVE STATISTICS.....................................................................................................................6
DATA SUMMARY....................................................................................................................................7
DISCUSSION AND RECOMMENDATIONS.........................................................................................10
REFERENCES..........................................................................................................................................11
2
STATISTICS
INTRODUCTION
ABZ is a media retail company that trades in what can be termed as offline media. The
company sells CDs, DVDs, Bestsellers, Novels, Books, Classical and Politics. This line of media
categories is referred to offline media since the media cannot be accessed over the internet. The
ABZ business model is highly dependent on aesthetics as the major selling point. The clients that
purchase offline and traditional media are generally attracted to a sense of beauty that exists in
offline and traditional media sources (Howard, 2014). The ability to touch a media source gives a
client an aesthetic feeling.
However, the rapid spread of online media has overtime presented growing competition
to offline and traditional media retailers. The online media counters aesthetics with affordable
prices, efficiency and convenience (Pappas, 2016). Accessing a media on an online platform is
relatively cheaper that purchasing a physical media source. Advancements in the field of
technology have ensured the availability of fast and reliable internet with in turn facilitates
efficiency in media accessing (Laudon & Guercio, 2014). Smartphones and other portable
technology devices provide clients with convenient ways of accessing media.
The rapid advancement in the field of technology has meant that companies in offline
media industry, such as ABZ, are faced with challenges in sales and profits. Decrease in the
number of clients leads to a decrease in the sales and consequently decrease in profit margins.
This study focuses in using data analysis and business intelligence techniques in evaluating the
current situation of ABZ and providing possible solutions to the sales and profit margins
challenges facing ABZ.
3
⊘ This is a preview!⊘
Do you want full access?
Subscribe today to unlock all pages.
Trusted by 1+ million students worldwide
STATISTICS
PROBLEM DEFINITION AND BUSINESS INTELLIGENCE REQUIRED
The ABZ company is faced with a challenge of decreasing sales and profit margins.
Through this study, the company hopes to understand both the consumer patterns and trends in
sales so as to inform on the decisions for improving sales and profit margins for the company.
The data analysis process provides the company with informed and actionable alternatives with
regards to their product lines and sales.
The study applies the use of data visualization tools in the analysis of the ABZ data. Data
visualization tools are statistical tools that enable graphical and visual representation of data
attributes (Martinez, Martinez, & Solka, 2010). Data visualization tools are advantageous since
they provide an easily understandable method of data analysis, interpretation and presentation
(Kabacoff, 2017).
The measures of central tendency are also investigated. These measures include the
mean, mode and standard deviations. They provide information on the average values, frequency
and the deviation of values from the mean. This additional information is important in the
inferencing process. The measures of variations evaluated in this study are; Range, Upper
Quartile, Lower Quartile and Interquartile Range.
VARIABLE DESCRIPTION
This study analyses seven different variables from the ABZ data in order to determine
consumer patterns and sales trends. Four of the variables are from the Consumer Attributes
subset (Age, Gender, Amount of Pay and Products Purchased) while the remaining three
4
Paraphrase This Document
Need a fresh take? Get an instant paraphrase of this document with our AI Paraphraser

STATISTICS
variables are from the Sales subset (Total Gross Sales, Gross Profits Margins and Revenue). The
description of the variables is as given below:
1. Age: The Age variable is numerical in nature. It represents information on the age of the
particular customer being observed. The age variable is measured on the ratio scale.
2. Gender: The Gender variable is categorical in nature. It represents information on the
gender of the particular customer being observed. The Gender variable is measured on
the nominal scale.
3. Amount of Pay: The Amount of Pay variable is numerical in nature. It represents
information on the amount that a particular client has paid for the purchases they made.
The Amount of Pay variable is measured on the ratio scale.
4. Products Purchased: The Products Purchased variable is categorical in nature. It
represents information on the category of the product purchased by a particular customer.
The Products Purchased variable is measured on the nominal scale.
5. Total Gross Sales: The Total Gross Sales variable is numerical in nature. It represents
information on the gross sales made on the particular day being observed. The Total
Gross Sales variable is measured on the ratio scale.
6. Gross Profit Margins: The Gross Profit Margins variable is numerical in nature. It
represents information on the gross profits made on the particular day being observed.
The Gross Profit Margins is measured on the ratio scale.
7. Revenue: The Revenue variable is numerical in nature. It represents information on the
revenue of the company as of the particular day being observed.
5
STATISTICS
DESCRIPTIVE STATISTICS
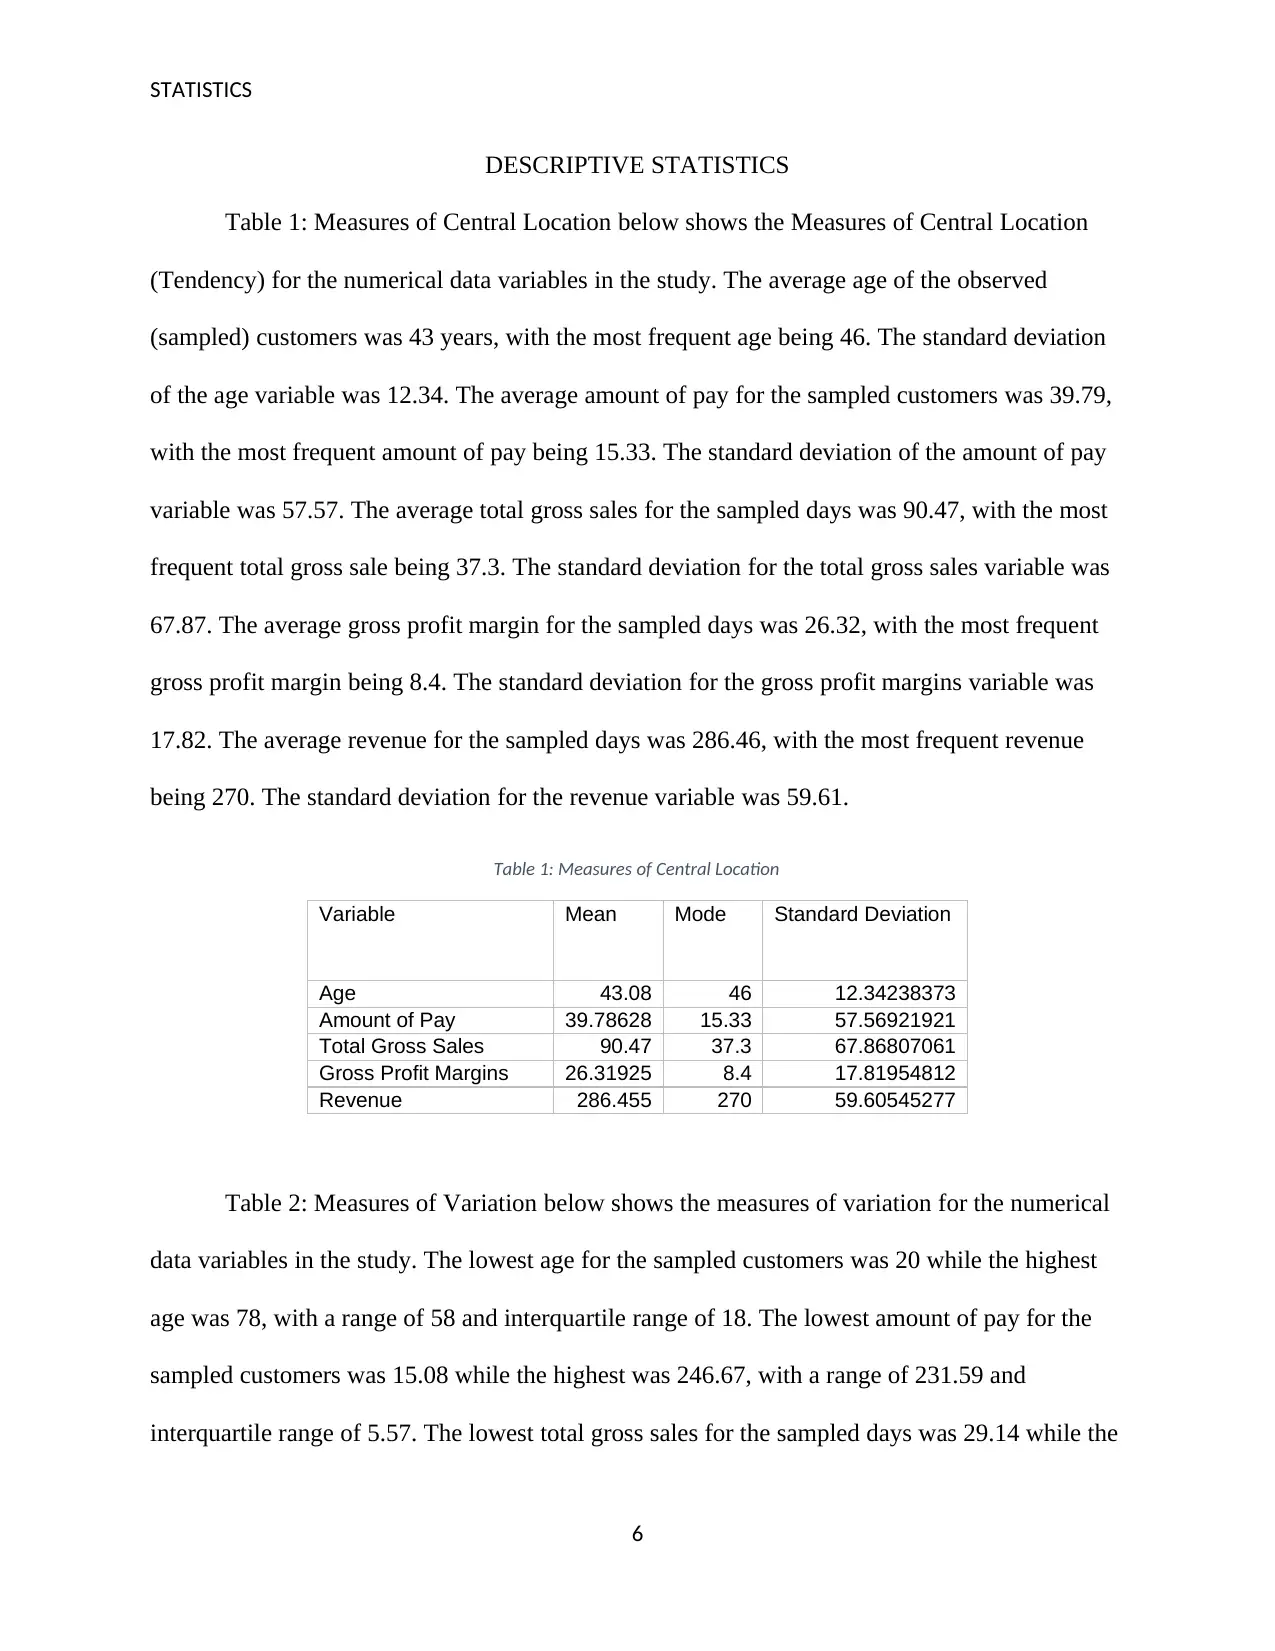
Table 1: Measures of Central Location below shows the Measures of Central Location
(Tendency) for the numerical data variables in the study. The average age of the observed
(sampled) customers was 43 years, with the most frequent age being 46. The standard deviation
of the age variable was 12.34. The average amount of pay for the sampled customers was 39.79,
with the most frequent amount of pay being 15.33. The standard deviation of the amount of pay
variable was 57.57. The average total gross sales for the sampled days was 90.47, with the most
frequent total gross sale being 37.3. The standard deviation for the total gross sales variable was
67.87. The average gross profit margin for the sampled days was 26.32, with the most frequent
gross profit margin being 8.4. The standard deviation for the gross profit margins variable was
17.82. The average revenue for the sampled days was 286.46, with the most frequent revenue
being 270. The standard deviation for the revenue variable was 59.61.
Table 1: Measures of Central Location
Variable Mean Mode Standard Deviation
Age 43.08 46 12.34238373
Amount of Pay 39.78628 15.33 57.56921921
Total Gross Sales 90.47 37.3 67.86807061
Gross Profit Margins 26.31925 8.4 17.81954812
Revenue 286.455 270 59.60545277
Table 2: Measures of Variation below shows the measures of variation for the numerical
data variables in the study. The lowest age for the sampled customers was 20 while the highest
age was 78, with a range of 58 and interquartile range of 18. The lowest amount of pay for the
sampled customers was 15.08 while the highest was 246.67, with a range of 231.59 and
interquartile range of 5.57. The lowest total gross sales for the sampled days was 29.14 while the
6
DESCRIPTIVE STATISTICS
Table 1: Measures of Central Location below shows the Measures of Central Location
(Tendency) for the numerical data variables in the study. The average age of the observed
(sampled) customers was 43 years, with the most frequent age being 46. The standard deviation
of the age variable was 12.34. The average amount of pay for the sampled customers was 39.79,
with the most frequent amount of pay being 15.33. The standard deviation of the amount of pay
variable was 57.57. The average total gross sales for the sampled days was 90.47, with the most
frequent total gross sale being 37.3. The standard deviation for the total gross sales variable was
67.87. The average gross profit margin for the sampled days was 26.32, with the most frequent
gross profit margin being 8.4. The standard deviation for the gross profit margins variable was
17.82. The average revenue for the sampled days was 286.46, with the most frequent revenue
being 270. The standard deviation for the revenue variable was 59.61.
Table 1: Measures of Central Location
Variable Mean Mode Standard Deviation
Age 43.08 46 12.34238373
Amount of Pay 39.78628 15.33 57.56921921
Total Gross Sales 90.47 37.3 67.86807061
Gross Profit Margins 26.31925 8.4 17.81954812
Revenue 286.455 270 59.60545277
Table 2: Measures of Variation below shows the measures of variation for the numerical
data variables in the study. The lowest age for the sampled customers was 20 while the highest
age was 78, with a range of 58 and interquartile range of 18. The lowest amount of pay for the
sampled customers was 15.08 while the highest was 246.67, with a range of 231.59 and
interquartile range of 5.57. The lowest total gross sales for the sampled days was 29.14 while the
6
⊘ This is a preview!⊘
Do you want full access?
Subscribe today to unlock all pages.
Trusted by 1+ million students worldwide
STATISTICS
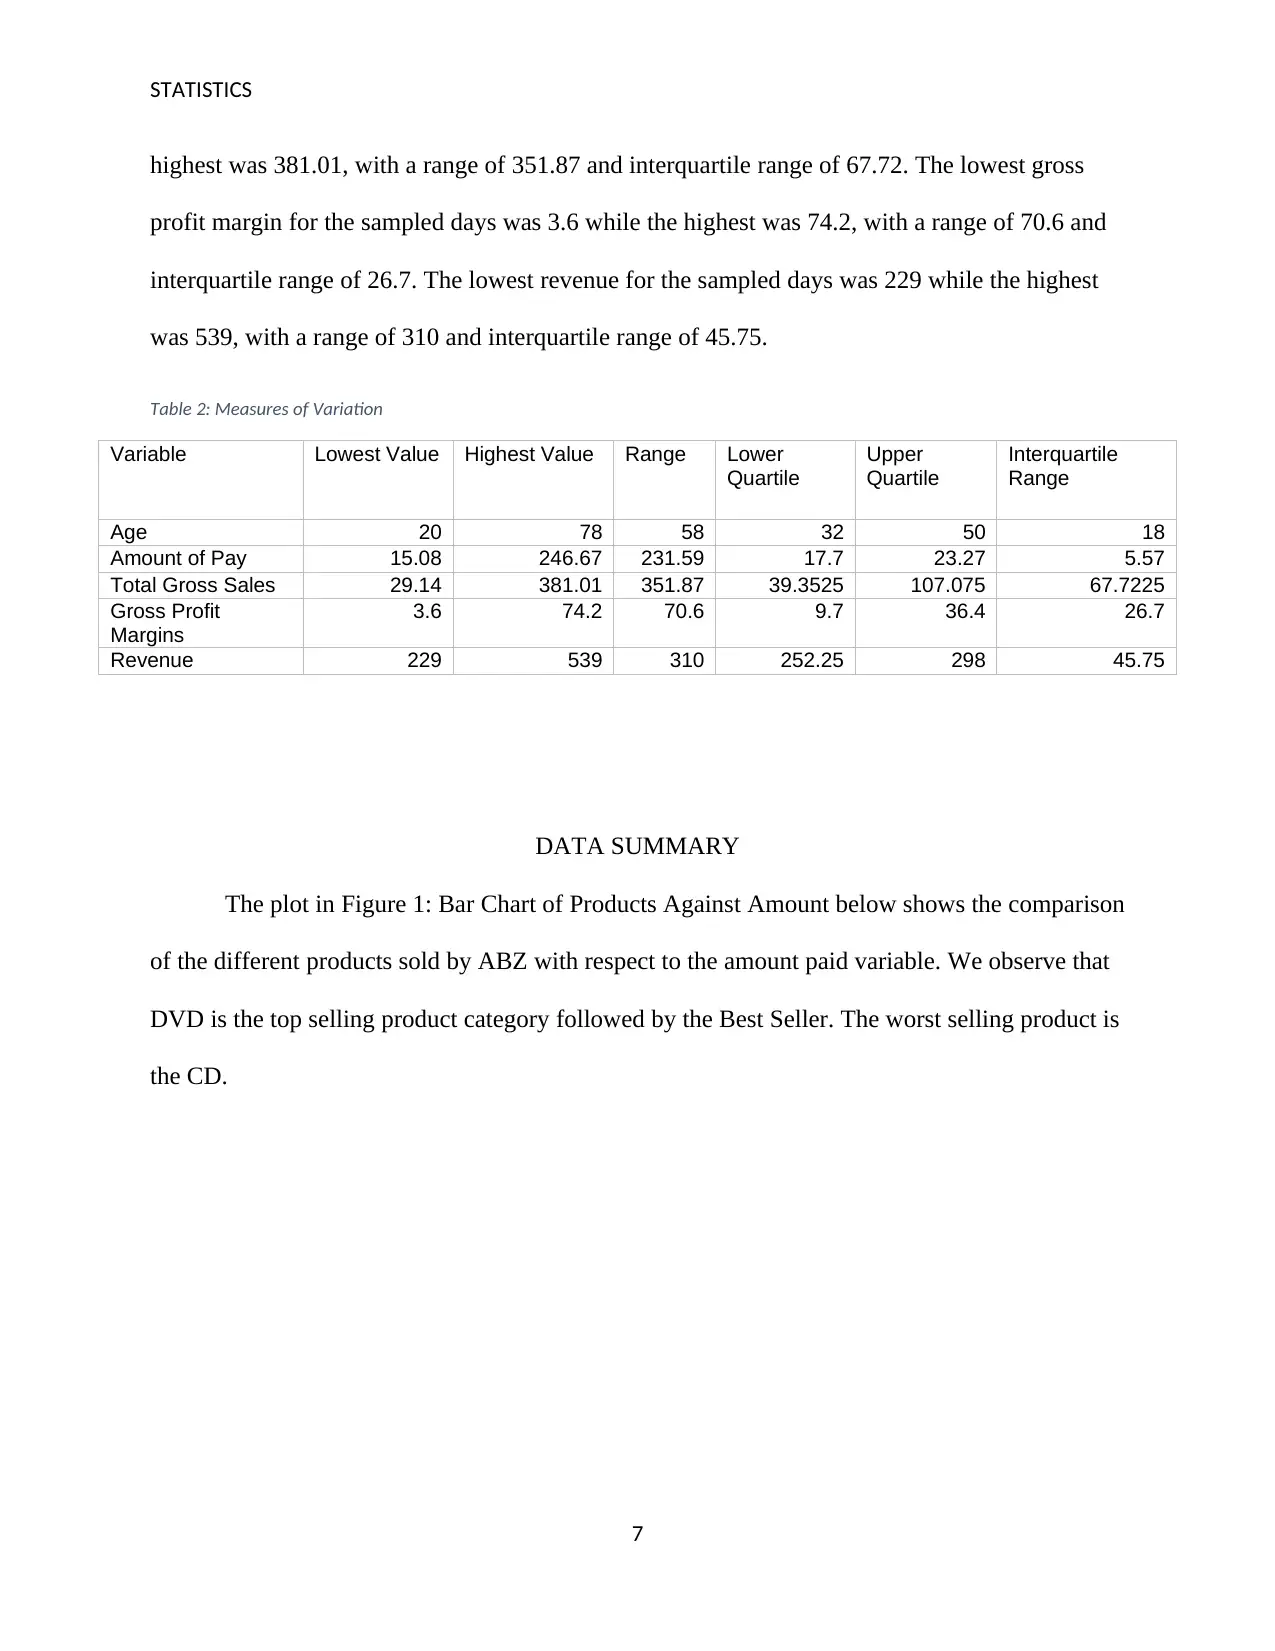
highest was 381.01, with a range of 351.87 and interquartile range of 67.72. The lowest gross
profit margin for the sampled days was 3.6 while the highest was 74.2, with a range of 70.6 and
interquartile range of 26.7. The lowest revenue for the sampled days was 229 while the highest
was 539, with a range of 310 and interquartile range of 45.75.
Table 2: Measures of Variation
Variable Lowest Value Highest Value Range Lower
Quartile
Upper
Quartile
Interquartile
Range
Age 20 78 58 32 50 18
Amount of Pay 15.08 246.67 231.59 17.7 23.27 5.57
Total Gross Sales 29.14 381.01 351.87 39.3525 107.075 67.7225
Gross Profit
Margins
3.6 74.2 70.6 9.7 36.4 26.7
Revenue 229 539 310 252.25 298 45.75
DATA SUMMARY
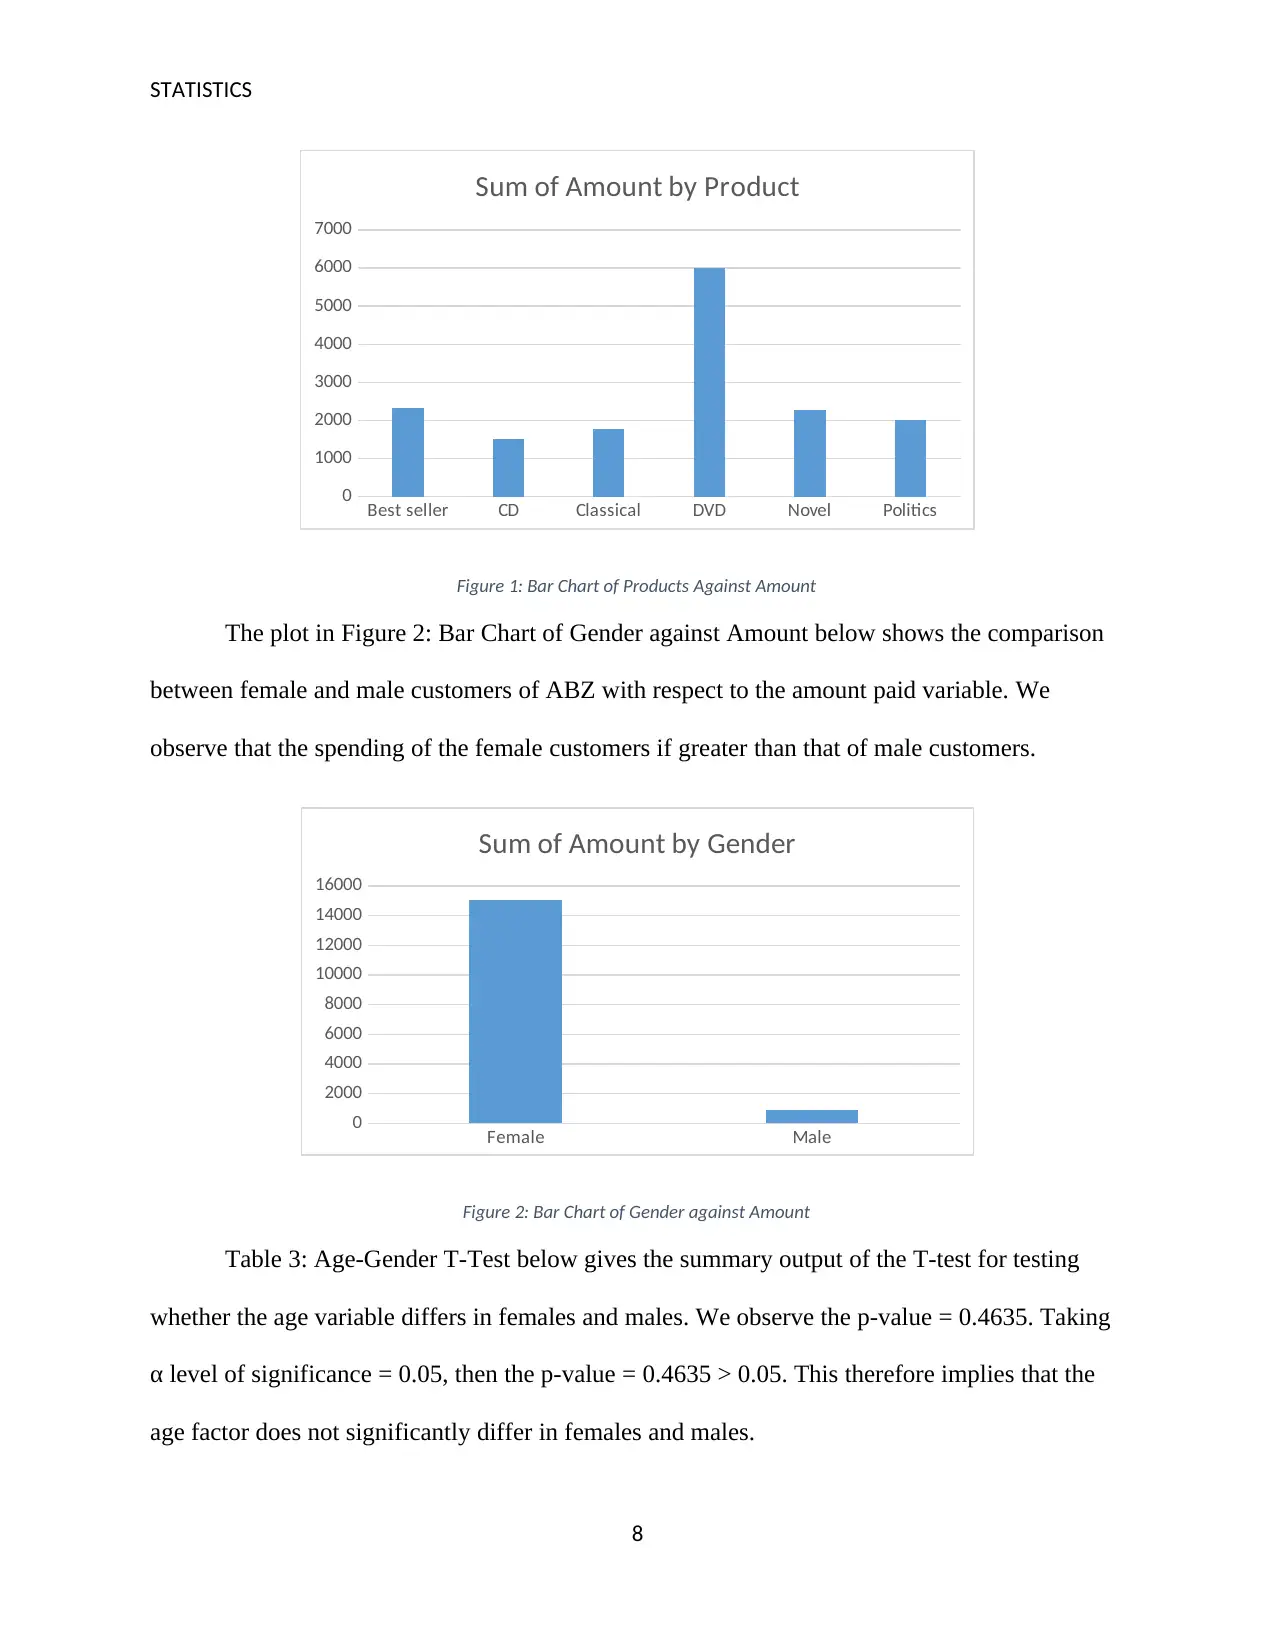
The plot in Figure 1: Bar Chart of Products Against Amount below shows the comparison
of the different products sold by ABZ with respect to the amount paid variable. We observe that
DVD is the top selling product category followed by the Best Seller. The worst selling product is
the CD.
7
highest was 381.01, with a range of 351.87 and interquartile range of 67.72. The lowest gross
profit margin for the sampled days was 3.6 while the highest was 74.2, with a range of 70.6 and
interquartile range of 26.7. The lowest revenue for the sampled days was 229 while the highest
was 539, with a range of 310 and interquartile range of 45.75.
Table 2: Measures of Variation
Variable Lowest Value Highest Value Range Lower
Quartile
Upper
Quartile
Interquartile
Range
Age 20 78 58 32 50 18
Amount of Pay 15.08 246.67 231.59 17.7 23.27 5.57
Total Gross Sales 29.14 381.01 351.87 39.3525 107.075 67.7225
Gross Profit
Margins
3.6 74.2 70.6 9.7 36.4 26.7
Revenue 229 539 310 252.25 298 45.75
DATA SUMMARY
The plot in Figure 1: Bar Chart of Products Against Amount below shows the comparison
of the different products sold by ABZ with respect to the amount paid variable. We observe that
DVD is the top selling product category followed by the Best Seller. The worst selling product is
the CD.
7
Paraphrase This Document
Need a fresh take? Get an instant paraphrase of this document with our AI Paraphraser
STATISTICS
Best seller CD Classical DVD Novel Politics
0
1000
2000
3000
4000
5000
6000
7000
Sum of Amount by Product
Figure 1: Bar Chart of Products Against Amount
The plot in Figure 2: Bar Chart of Gender against Amount below shows the comparison
between female and male customers of ABZ with respect to the amount paid variable. We
observe that the spending of the female customers if greater than that of male customers.
Female Male
0
2000
4000
6000
8000
10000
12000
14000
16000
Sum of Amount by Gender
Figure 2: Bar Chart of Gender against Amount
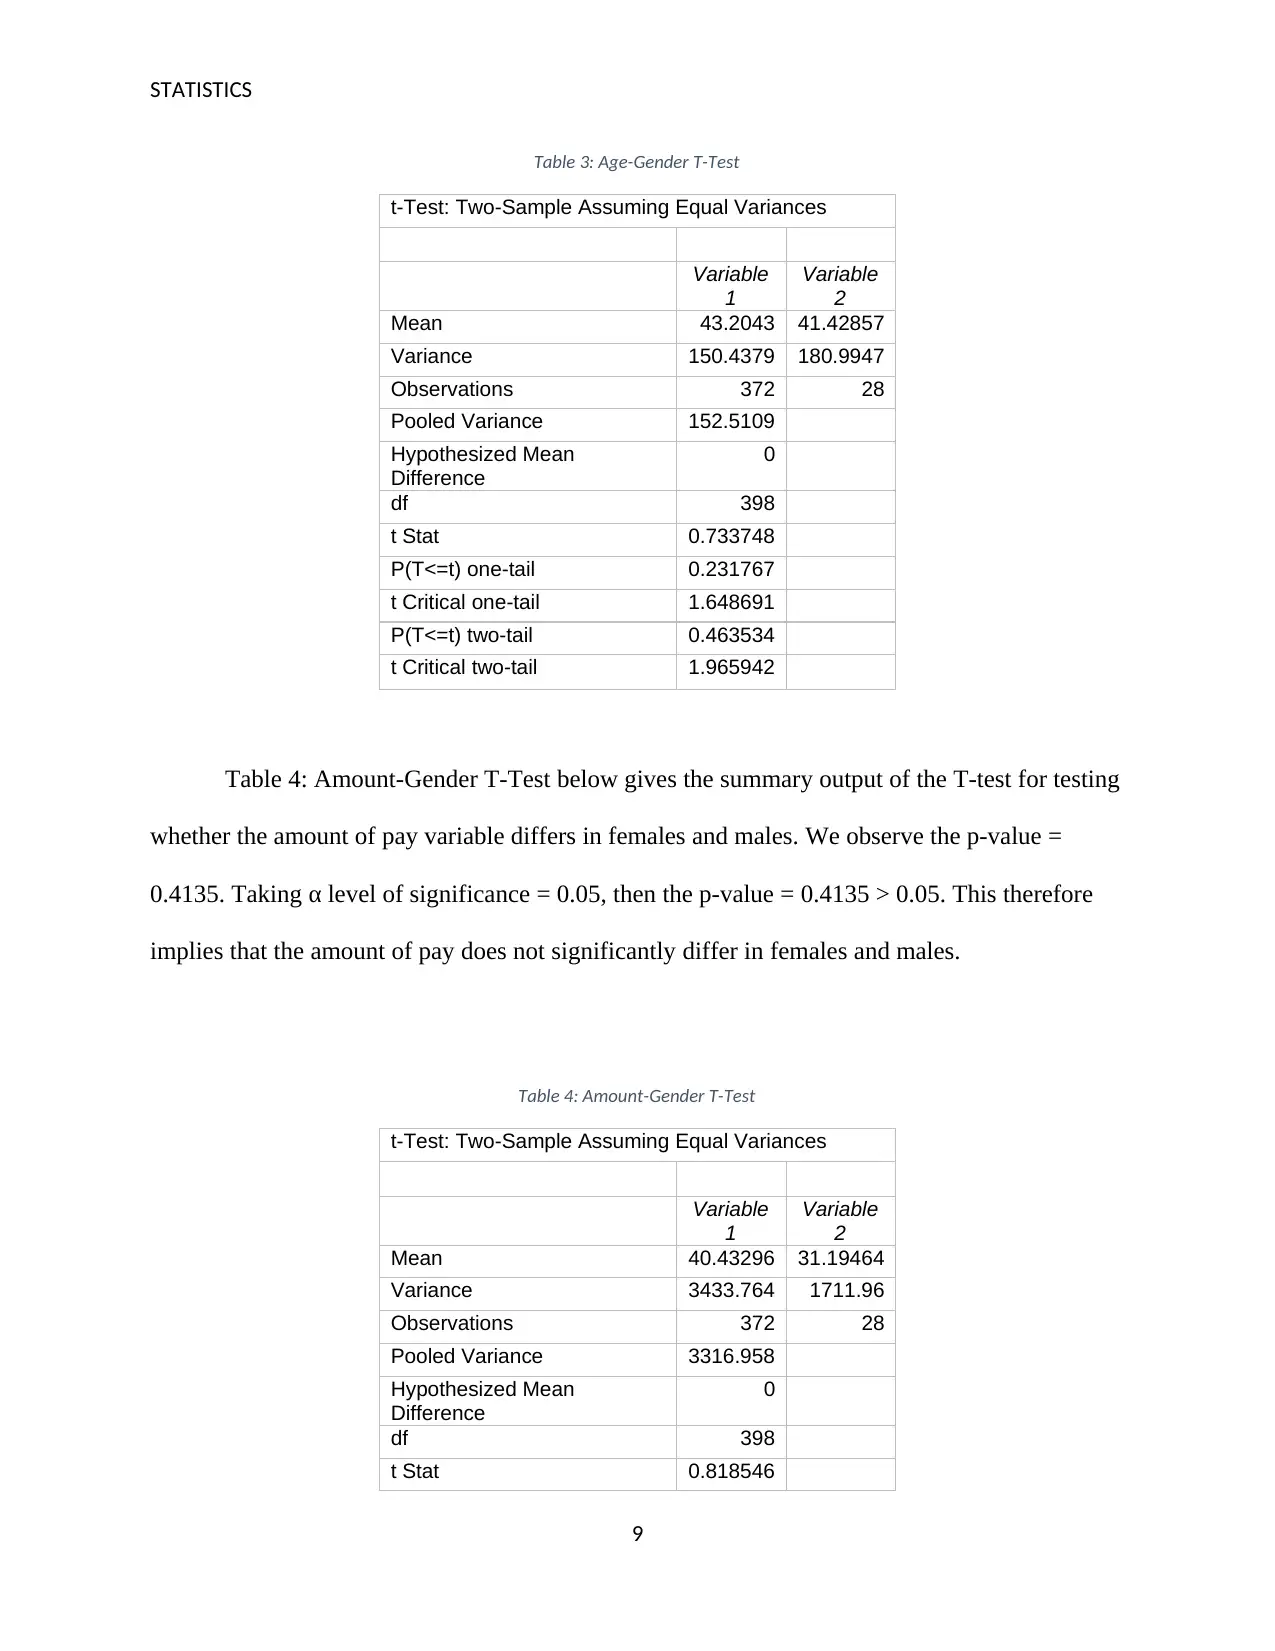
Table 3: Age-Gender T-Test below gives the summary output of the T-test for testing
whether the age variable differs in females and males. We observe the p-value = 0.4635. Taking
α level of significance = 0.05, then the p-value = 0.4635 > 0.05. This therefore implies that the
age factor does not significantly differ in females and males.
8
Best seller CD Classical DVD Novel Politics
0
1000
2000
3000
4000
5000
6000
7000
Sum of Amount by Product
Figure 1: Bar Chart of Products Against Amount
The plot in Figure 2: Bar Chart of Gender against Amount below shows the comparison
between female and male customers of ABZ with respect to the amount paid variable. We
observe that the spending of the female customers if greater than that of male customers.
Female Male
0
2000
4000
6000
8000
10000
12000
14000
16000
Sum of Amount by Gender
Figure 2: Bar Chart of Gender against Amount
Table 3: Age-Gender T-Test below gives the summary output of the T-test for testing
whether the age variable differs in females and males. We observe the p-value = 0.4635. Taking
α level of significance = 0.05, then the p-value = 0.4635 > 0.05. This therefore implies that the
age factor does not significantly differ in females and males.
8
STATISTICS
Table 3: Age-Gender T-Test
t-Test: Two-Sample Assuming Equal Variances
Variable
1
Variable
2
Mean 43.2043 41.42857
Variance 150.4379 180.9947
Observations 372 28
Pooled Variance 152.5109
Hypothesized Mean
Difference
0
df 398
t Stat 0.733748
P(T<=t) one-tail 0.231767
t Critical one-tail 1.648691
P(T<=t) two-tail 0.463534
t Critical two-tail 1.965942
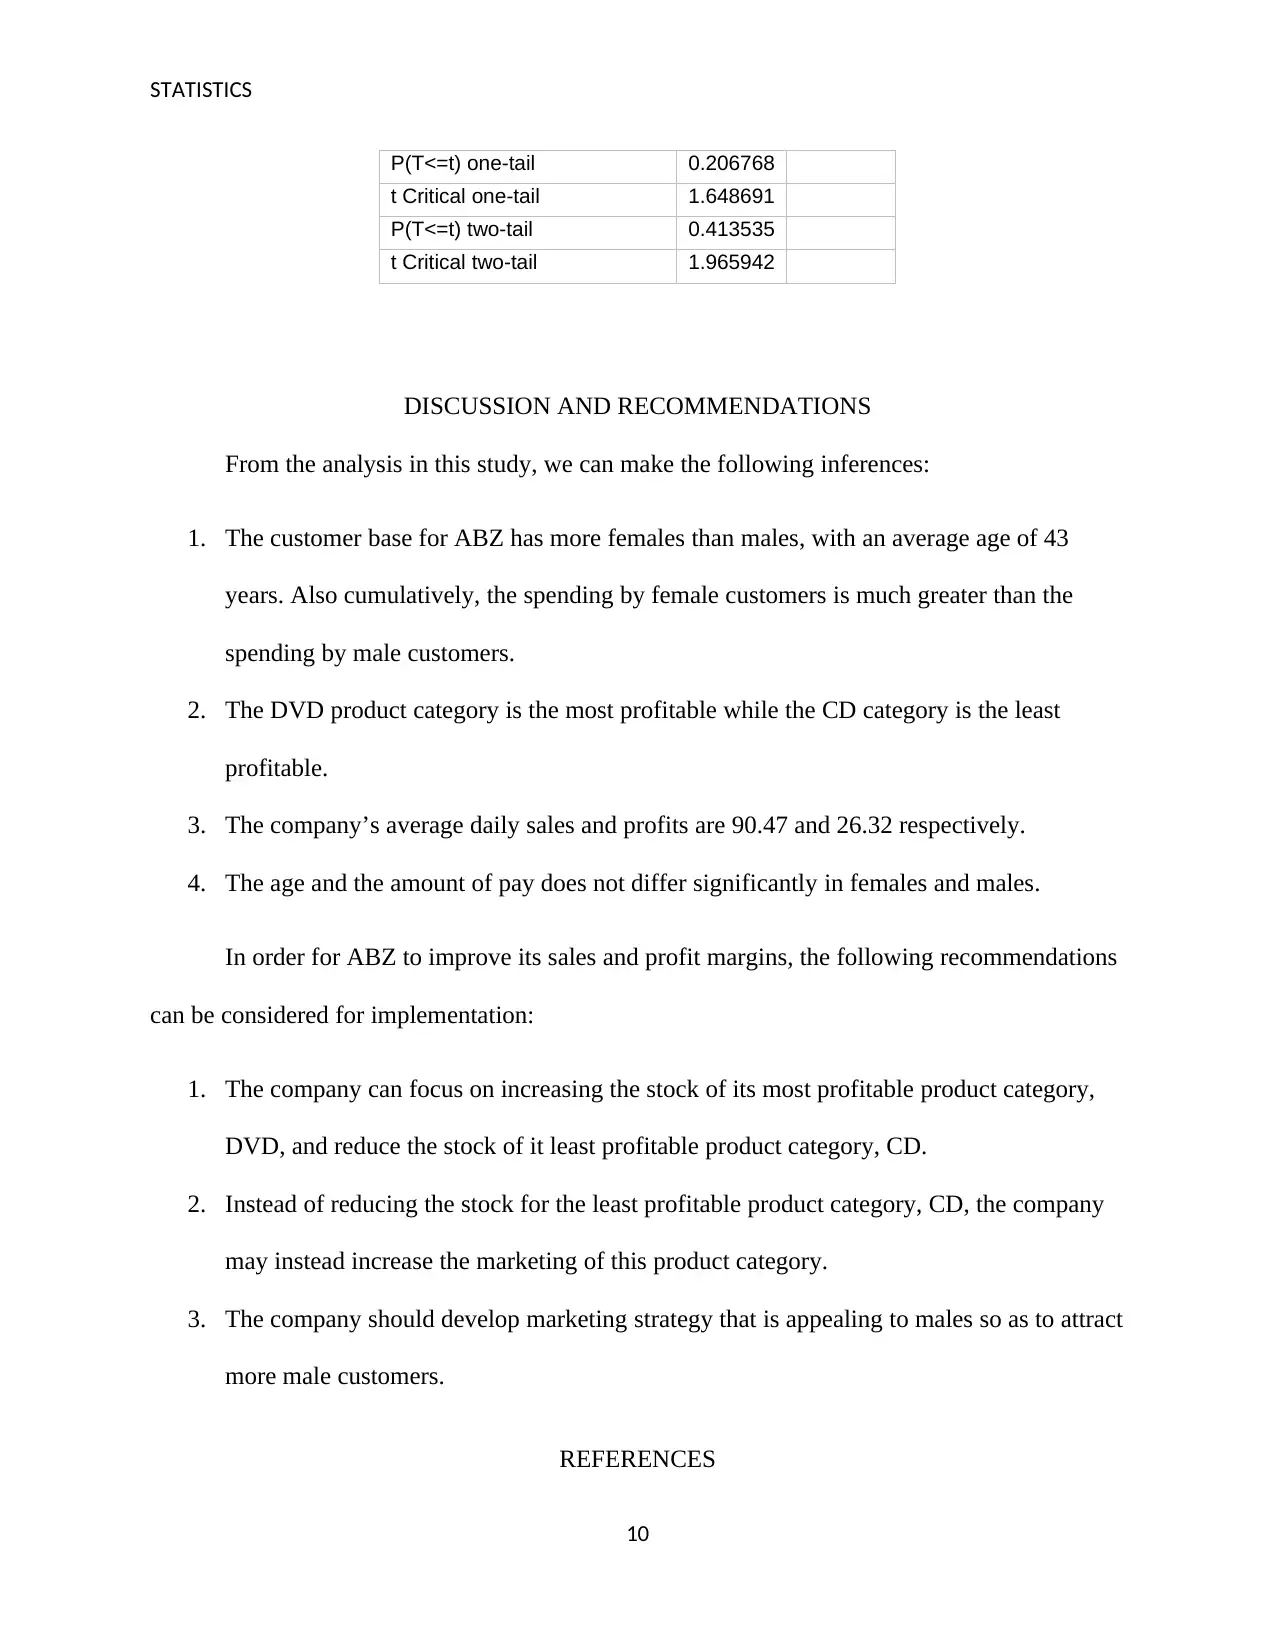
Table 4: Amount-Gender T-Test below gives the summary output of the T-test for testing
whether the amount of pay variable differs in females and males. We observe the p-value =
0.4135. Taking α level of significance = 0.05, then the p-value = 0.4135 > 0.05. This therefore
implies that the amount of pay does not significantly differ in females and males.
Table 4: Amount-Gender T-Test
t-Test: Two-Sample Assuming Equal Variances
Variable
1
Variable
2
Mean 40.43296 31.19464
Variance 3433.764 1711.96
Observations 372 28
Pooled Variance 3316.958
Hypothesized Mean
Difference
0
df 398
t Stat 0.818546
9
Table 3: Age-Gender T-Test
t-Test: Two-Sample Assuming Equal Variances
Variable
1
Variable
2
Mean 43.2043 41.42857
Variance 150.4379 180.9947
Observations 372 28
Pooled Variance 152.5109
Hypothesized Mean
Difference
0
df 398
t Stat 0.733748
P(T<=t) one-tail 0.231767
t Critical one-tail 1.648691
P(T<=t) two-tail 0.463534
t Critical two-tail 1.965942
Table 4: Amount-Gender T-Test below gives the summary output of the T-test for testing
whether the amount of pay variable differs in females and males. We observe the p-value =
0.4135. Taking α level of significance = 0.05, then the p-value = 0.4135 > 0.05. This therefore
implies that the amount of pay does not significantly differ in females and males.
Table 4: Amount-Gender T-Test
t-Test: Two-Sample Assuming Equal Variances
Variable
1
Variable
2
Mean 40.43296 31.19464
Variance 3433.764 1711.96
Observations 372 28
Pooled Variance 3316.958
Hypothesized Mean
Difference
0
df 398
t Stat 0.818546
9
⊘ This is a preview!⊘
Do you want full access?
Subscribe today to unlock all pages.
Trusted by 1+ million students worldwide
STATISTICS
P(T<=t) one-tail 0.206768
t Critical one-tail 1.648691
P(T<=t) two-tail 0.413535
t Critical two-tail 1.965942
DISCUSSION AND RECOMMENDATIONS
From the analysis in this study, we can make the following inferences:
1. The customer base for ABZ has more females than males, with an average age of 43
years. Also cumulatively, the spending by female customers is much greater than the
spending by male customers.
2. The DVD product category is the most profitable while the CD category is the least
profitable.
3. The company’s average daily sales and profits are 90.47 and 26.32 respectively.
4. The age and the amount of pay does not differ significantly in females and males.
In order for ABZ to improve its sales and profit margins, the following recommendations
can be considered for implementation:
1. The company can focus on increasing the stock of its most profitable product category,
DVD, and reduce the stock of it least profitable product category, CD.
2. Instead of reducing the stock for the least profitable product category, CD, the company
may instead increase the marketing of this product category.
3. The company should develop marketing strategy that is appealing to males so as to attract
more male customers.
REFERENCES
10
Paraphrase This Document
Need a fresh take? Get an instant paraphrase of this document with our AI Paraphraser
STATISTICS
Howard, J. (2014). The Varieties of Aesthetic Experience. London: Pearson.
Kabacoff, R. I. (2017, March 15). graphs. Retrieved from statmethods:
www.statmethods.net/graphs/density.html
Laudon, K. C., & Guercio, T. C. (2014). E-commerce. Business. Technology. Society (1st ed.).
Chicago: Pearson.
Martinez, W. L., Martinez, A. R., & Solka, J. (2010). Exploratory Data Analysis With MATLAB,
2nd Edition (1 ed.). London: CRC/Chapmann & Hall.
Pappas, N. (2016). Marketing Strategies Perceived Risks, and Consumer Trust in Online
Behaviour. Journal of Retailing and Consumer Services, 29(1), 92-103.
11
1 out of 11


Your All-in-One AI-Powered Toolkit for Academic Success.
+13062052269
info@desklib.com
Available 24*7 on WhatsApp / Email
![[object Object]](/_next/static/media/star-bottom.7253800d.svg)
Unlock your academic potential
Copyright © 2020–2026 A2Z Services. All Rights Reserved. Developed and managed by ZUCOL.