AC4410 Accounting & Finance: Financial Analysis of BT Group Plc
VerifiedAdded on 2023/04/20
|20
|2535
|81
Report
AI Summary
This report provides a comprehensive financial analysis of BT Group Plc, a multinational telecommunications company headquartered in London. The analysis utilizes key financial ratios, including profitability, liquidity, and efficiency ratios, computed from the company's financial statements over a four-year period (2015-2018). Profitability ratios, such as operating profit ratio and net profit ratio, indicate a fluctuating performance, with a slight decline in net profitability due to rising costs. Return on capital employed (ROCE) shows a moderate return on investments. Liquidity ratios, including current ratio and acid test ratio, suggest an improved but not yet ideal liquidity position. Activity ratios, such as trade receivables collection period and inventory turnover period, highlight areas for improvement in efficiency. The report concludes that while BT Group Plc shows some financial improvements, further cost management and efficiency enhancements are necessary. Desklib offers similar solved assignments and past papers for students.

Running head: ACCOUNTS AND FINANCE
Accounts and Finance
Name of the Student:
Name of the University:
Author’s Note:
Accounts and Finance
Name of the Student:
Name of the University:
Author’s Note:
Paraphrase This Document
Need a fresh take? Get an instant paraphrase of this document with our AI Paraphraser
1
ACCOUNTS AND FINANCE
Table of Contents
Overview of the Company...............................................................................................................3
Ratio Analysis..................................................................................................................................3
Application of Ratio Analysis.....................................................................................................3
Merits of Ratio Analysis..............................................................................................................4
Demerits of Ratio Analysis..........................................................................................................4
Profitability Ratios...........................................................................................................................5
Operating Profit Ratios................................................................................................................5
Net Profit Ratio............................................................................................................................6
Return on Capital Employed.......................................................................................................6
Liquidity Ratios...............................................................................................................................7
Current Ratio...............................................................................................................................7
Acid Test Ratio............................................................................................................................8
Activity Ratios.................................................................................................................................9
Trade Receivables Collection Period...........................................................................................9
Trade Payables Payment Period................................................................................................10
Inventories Turnover Period......................................................................................................10
Conclusion.....................................................................................................................................11
Reference.......................................................................................................................................12
Appendix........................................................................................................................................14

2
ACCOUNTS AND FINANCE
ACCOUNTS AND FINANCE
⊘ This is a preview!⊘
Do you want full access?
Subscribe today to unlock all pages.
Trusted by 1+ million students worldwide
3
ACCOUNTS AND FINANCE
Overview of the Company
BT Group plc is multinational company which is engaged in telecommunication and the
company has its headquarters in London. The company is engaged in providing
telecommunication services in many countries and this shows that the scale of operation of the
company is high. BT group controls of a large number of subsidiaries. The company controls
telephone, broad bank and subscription television services on Great Britain.
The company is listed in London stock exchanges and the company has developed
reputation in the market. The company serves maximum customers in the market of London. The
origin of the business dates back toto the founding of Electric Telegraph which was established
in 1946. In today’s era the company serves around 30 million customers and is regarded as the
leading supplier of customer broad bank and communication services in UK (Btplc.com. 2018).
The assessment aims to analyze the financial performance of the business with the help of key
ratios which are computed for the business.
Ratio Analysis
Application of Ratio Analysis
The financial ratios of a business are considered to be important financial indicators of
the business and can be used effectively to determine the performance of the business. The ratios
which are computed and analyzed using the technique of ratio analysis are liquidity ratios,
profitability ratios and efficiency ratios (Delen, Kuzey and Uyar 2013). The ratios which are
computed are considered to be important factors which determine the performance of the
business and also are considered to financial indicators for the success of the business. In
addition to this, the financial ratios cover different aspects of performance of a business such as
Paraphrase This Document
Need a fresh take? Get an instant paraphrase of this document with our AI Paraphraser
4
ACCOUNTS AND FINANCE
profitability, liquidity, solvency and similar other aspects. Moreover, the financial ratios are also
helpful in decision making process and effectively highlight the strengths of the business.
Merits of Ratio Analysis
The benefits of ratio analysis are listed below in details:
Ratio analysis can effectively used by the management of the company for taking major
decisions in a business which can be related to any aspect of the business.
The technique is very useful in simplifying difficult treatment of the business and also
financial data into simple estimates which can be interpreted easily by the management of
the company.
The key financial ratios which are computed are often considered by the investors before
they take any decision whether to invest in the shares of the business.
Demerits of Ratio Analysis
The limitation which is associated with the technique of ratio analysis are listed below:
The effect and impact of inflation are completely ignored by the technique of ratio
analysis. The changes in the price level of the business is not considered by the
technique.
The qualitative aspects of a company are not considered by ratio analysis of financial
statement of a business.
The different types of accounting principles and treatment which are undertaken by
different company can have an impact on the technique of ratio analysis and therefore the
technique is not reliable.
5
ACCOUNTS AND FINANCE
The key financial ratio of a business which is computed is done considering the financial
statement of BT Group Plc for a period of 4 years. The ratios which are computed are analysed
and shown below:
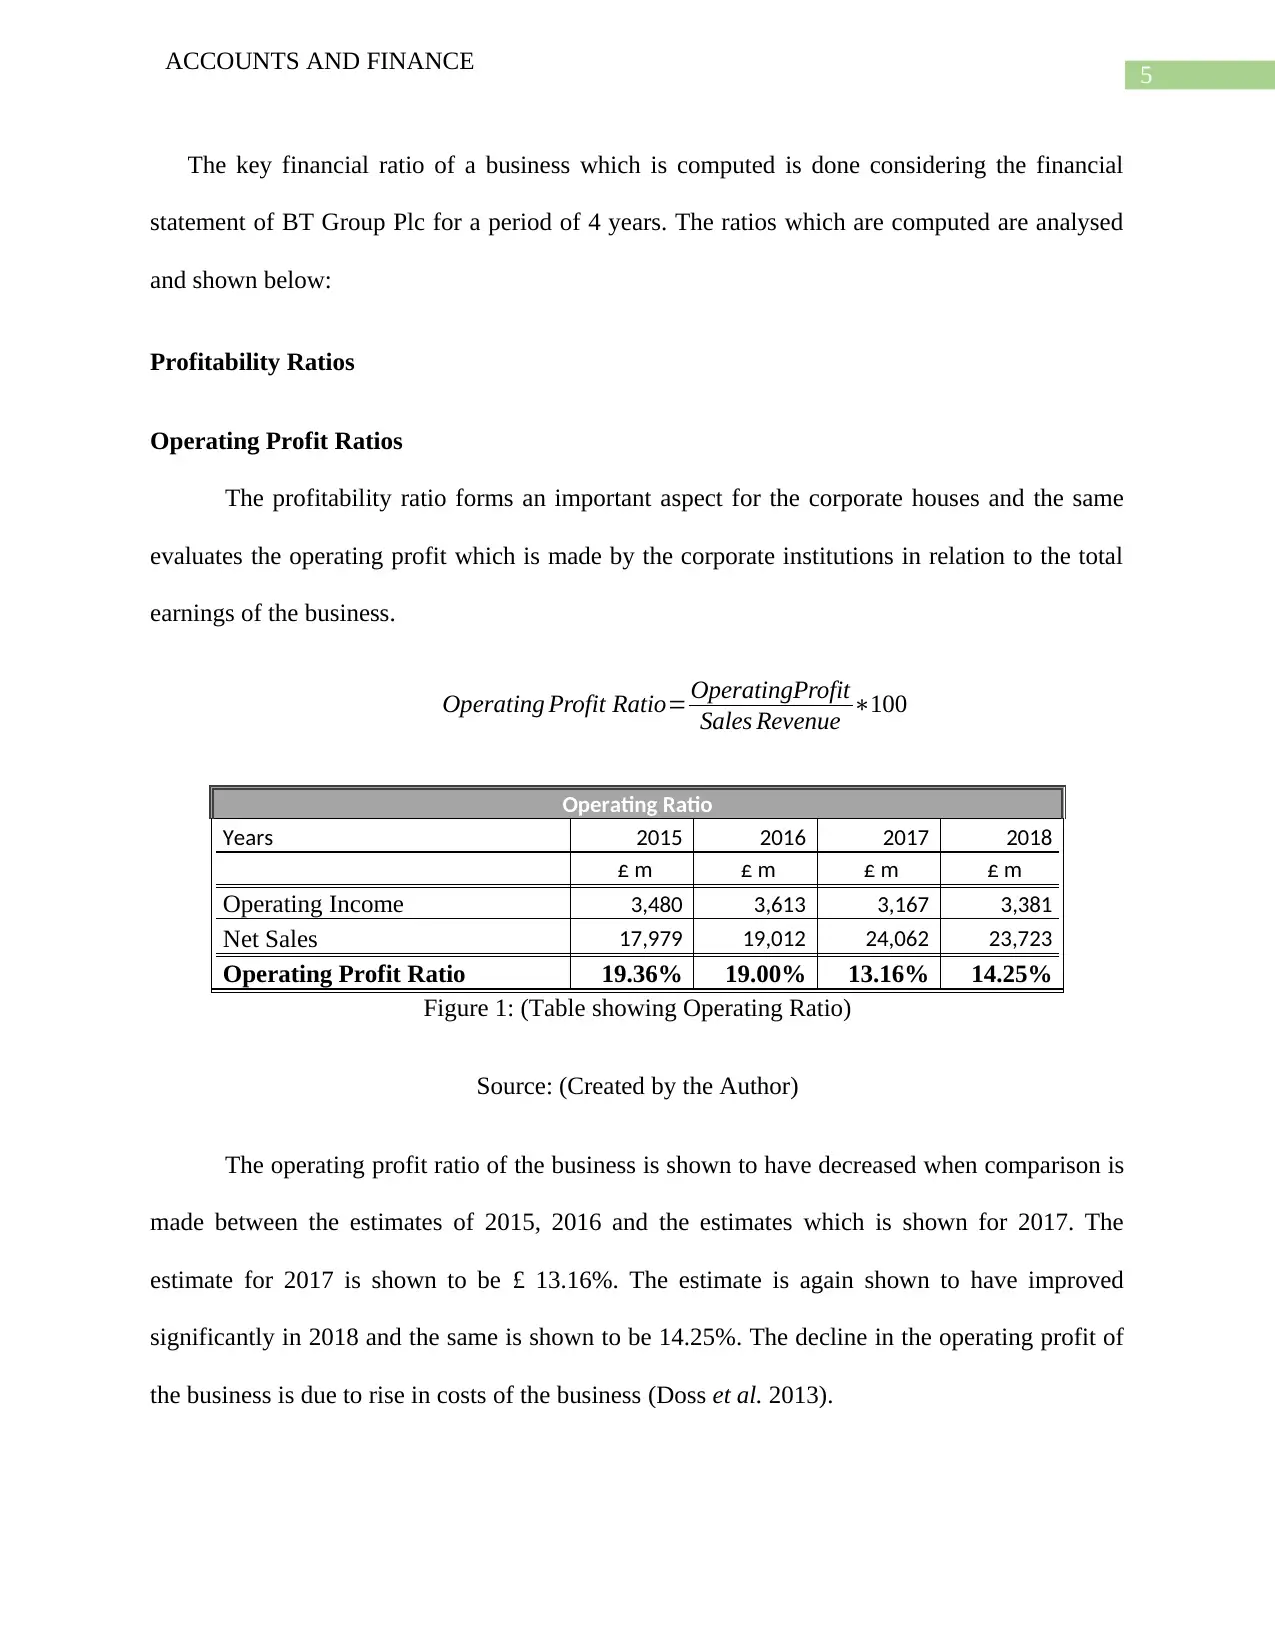
Profitability Ratios
Operating Profit Ratios
The profitability ratio forms an important aspect for the corporate houses and the same
evaluates the operating profit which is made by the corporate institutions in relation to the total
earnings of the business.
Operating Profit Ratio= OperatingProfit
Sales Revenue ∗100
Operating Ratio
Years 2015 2016 2017 2018
£ m £ m £ m £ m
Operating Income 3,480 3,613 3,167 3,381
Net Sales 17,979 19,012 24,062 23,723
Operating Profit Ratio 19.36% 19.00% 13.16% 14.25%
Figure 1: (Table showing Operating Ratio)
Source: (Created by the Author)
The operating profit ratio of the business is shown to have decreased when comparison is
made between the estimates of 2015, 2016 and the estimates which is shown for 2017. The
estimate for 2017 is shown to be £ 13.16%. The estimate is again shown to have improved
significantly in 2018 and the same is shown to be 14.25%. The decline in the operating profit of
the business is due to rise in costs of the business (Doss et al. 2013).
ACCOUNTS AND FINANCE
The key financial ratio of a business which is computed is done considering the financial
statement of BT Group Plc for a period of 4 years. The ratios which are computed are analysed
and shown below:
Profitability Ratios
Operating Profit Ratios
The profitability ratio forms an important aspect for the corporate houses and the same
evaluates the operating profit which is made by the corporate institutions in relation to the total
earnings of the business.
Operating Profit Ratio= OperatingProfit
Sales Revenue ∗100
Operating Ratio
Years 2015 2016 2017 2018
£ m £ m £ m £ m
Operating Income 3,480 3,613 3,167 3,381
Net Sales 17,979 19,012 24,062 23,723
Operating Profit Ratio 19.36% 19.00% 13.16% 14.25%
Figure 1: (Table showing Operating Ratio)
Source: (Created by the Author)
The operating profit ratio of the business is shown to have decreased when comparison is
made between the estimates of 2015, 2016 and the estimates which is shown for 2017. The
estimate for 2017 is shown to be £ 13.16%. The estimate is again shown to have improved
significantly in 2018 and the same is shown to be 14.25%. The decline in the operating profit of
the business is due to rise in costs of the business (Doss et al. 2013).
⊘ This is a preview!⊘
Do you want full access?
Subscribe today to unlock all pages.
Trusted by 1+ million students worldwide
6
ACCOUNTS AND FINANCE
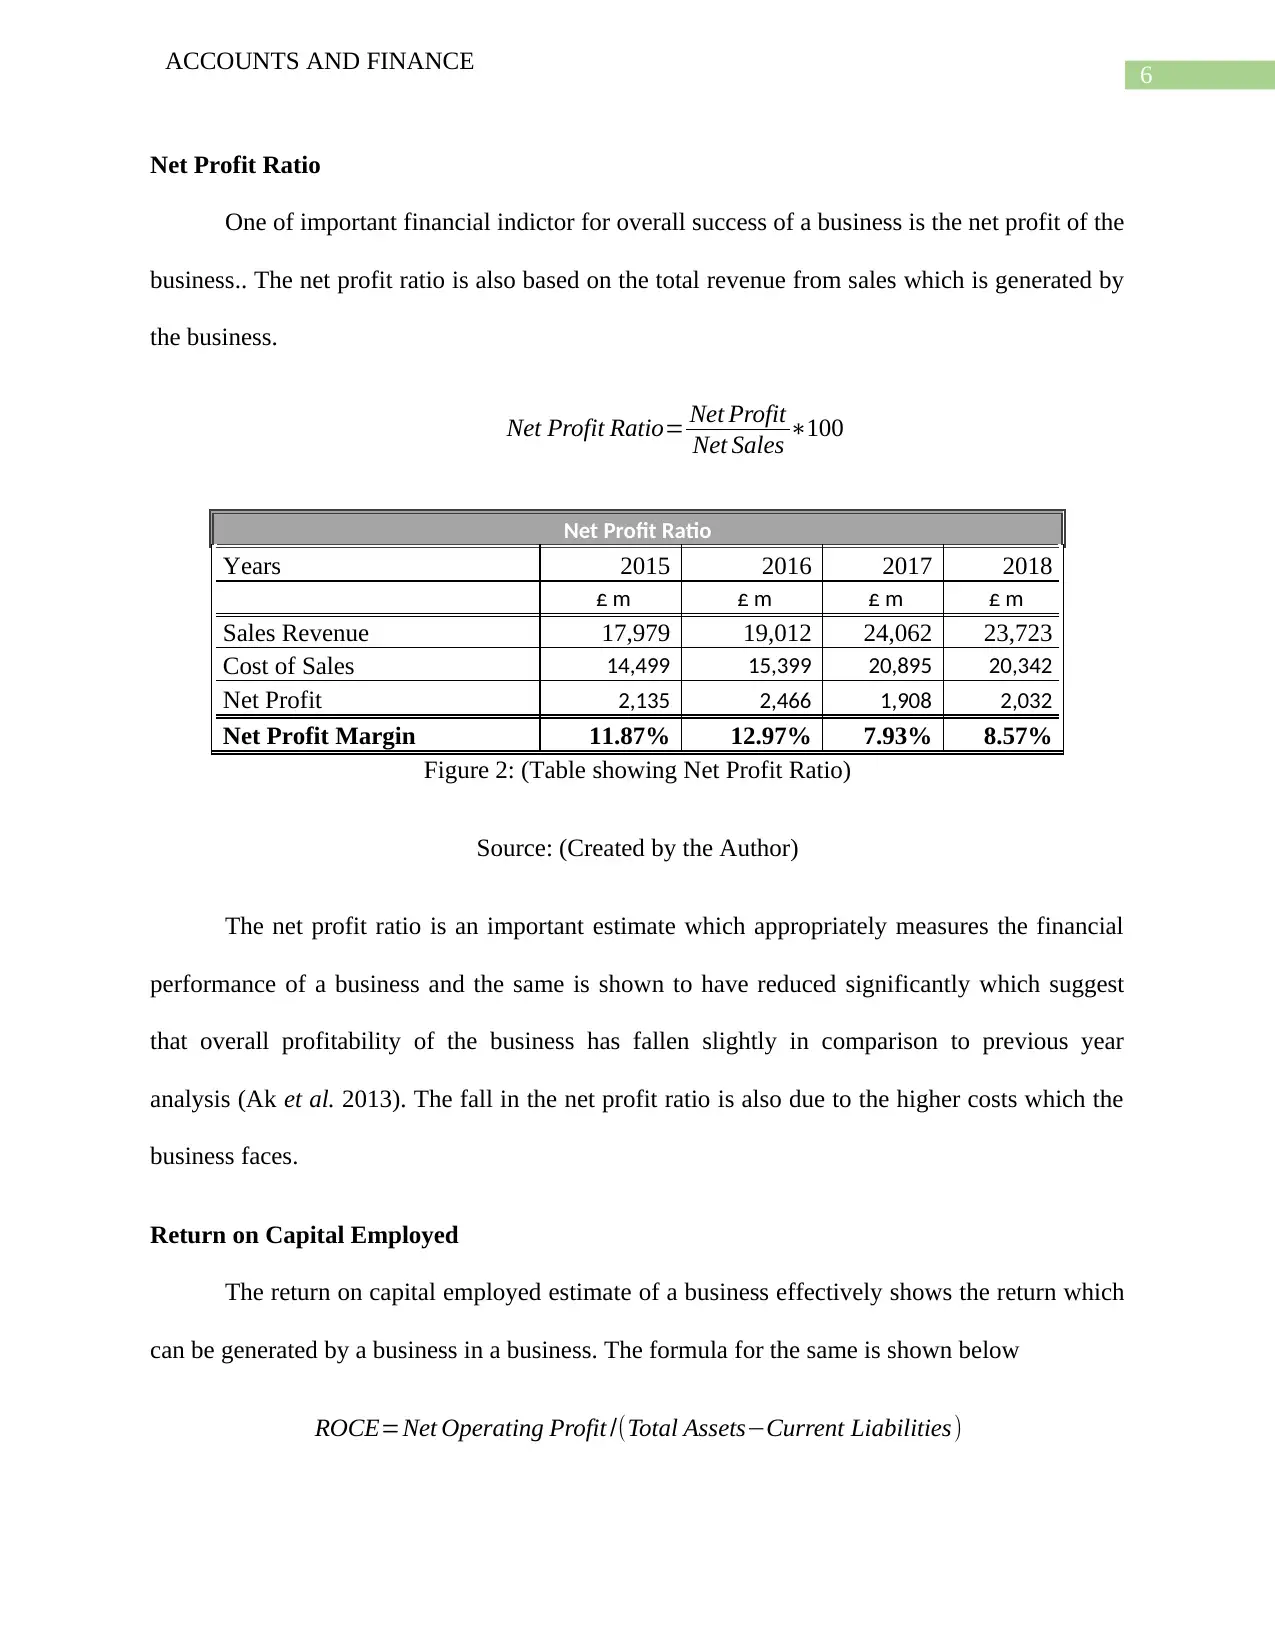
Net Profit Ratio
One of important financial indictor for overall success of a business is the net profit of the
business.. The net profit ratio is also based on the total revenue from sales which is generated by
the business.
Net Profit Ratio= Net Profit
Net Sales ∗100
Net Profit Ratio
Years 2015 2016 2017 2018
£ m £ m £ m £ m
Sales Revenue 17,979 19,012 24,062 23,723
Cost of Sales 14,499 15,399 20,895 20,342
Net Profit 2,135 2,466 1,908 2,032
Net Profit Margin 11.87% 12.97% 7.93% 8.57%
Figure 2: (Table showing Net Profit Ratio)
Source: (Created by the Author)
The net profit ratio is an important estimate which appropriately measures the financial
performance of a business and the same is shown to have reduced significantly which suggest
that overall profitability of the business has fallen slightly in comparison to previous year
analysis (Ak et al. 2013). The fall in the net profit ratio is also due to the higher costs which the
business faces.
Return on Capital Employed
The return on capital employed estimate of a business effectively shows the return which
can be generated by a business in a business. The formula for the same is shown below
ROCE=Net Operating Profit /(Total Assets−Current Liabilities)
ACCOUNTS AND FINANCE
Net Profit Ratio
One of important financial indictor for overall success of a business is the net profit of the
business.. The net profit ratio is also based on the total revenue from sales which is generated by
the business.
Net Profit Ratio= Net Profit
Net Sales ∗100
Net Profit Ratio
Years 2015 2016 2017 2018
£ m £ m £ m £ m
Sales Revenue 17,979 19,012 24,062 23,723
Cost of Sales 14,499 15,399 20,895 20,342
Net Profit 2,135 2,466 1,908 2,032
Net Profit Margin 11.87% 12.97% 7.93% 8.57%
Figure 2: (Table showing Net Profit Ratio)
Source: (Created by the Author)
The net profit ratio is an important estimate which appropriately measures the financial
performance of a business and the same is shown to have reduced significantly which suggest
that overall profitability of the business has fallen slightly in comparison to previous year
analysis (Ak et al. 2013). The fall in the net profit ratio is also due to the higher costs which the
business faces.
Return on Capital Employed
The return on capital employed estimate of a business effectively shows the return which
can be generated by a business in a business. The formula for the same is shown below
ROCE=Net Operating Profit /(Total Assets−Current Liabilities)
Paraphrase This Document
Need a fresh take? Get an instant paraphrase of this document with our AI Paraphraser
7
ACCOUNTS AND FINANCE
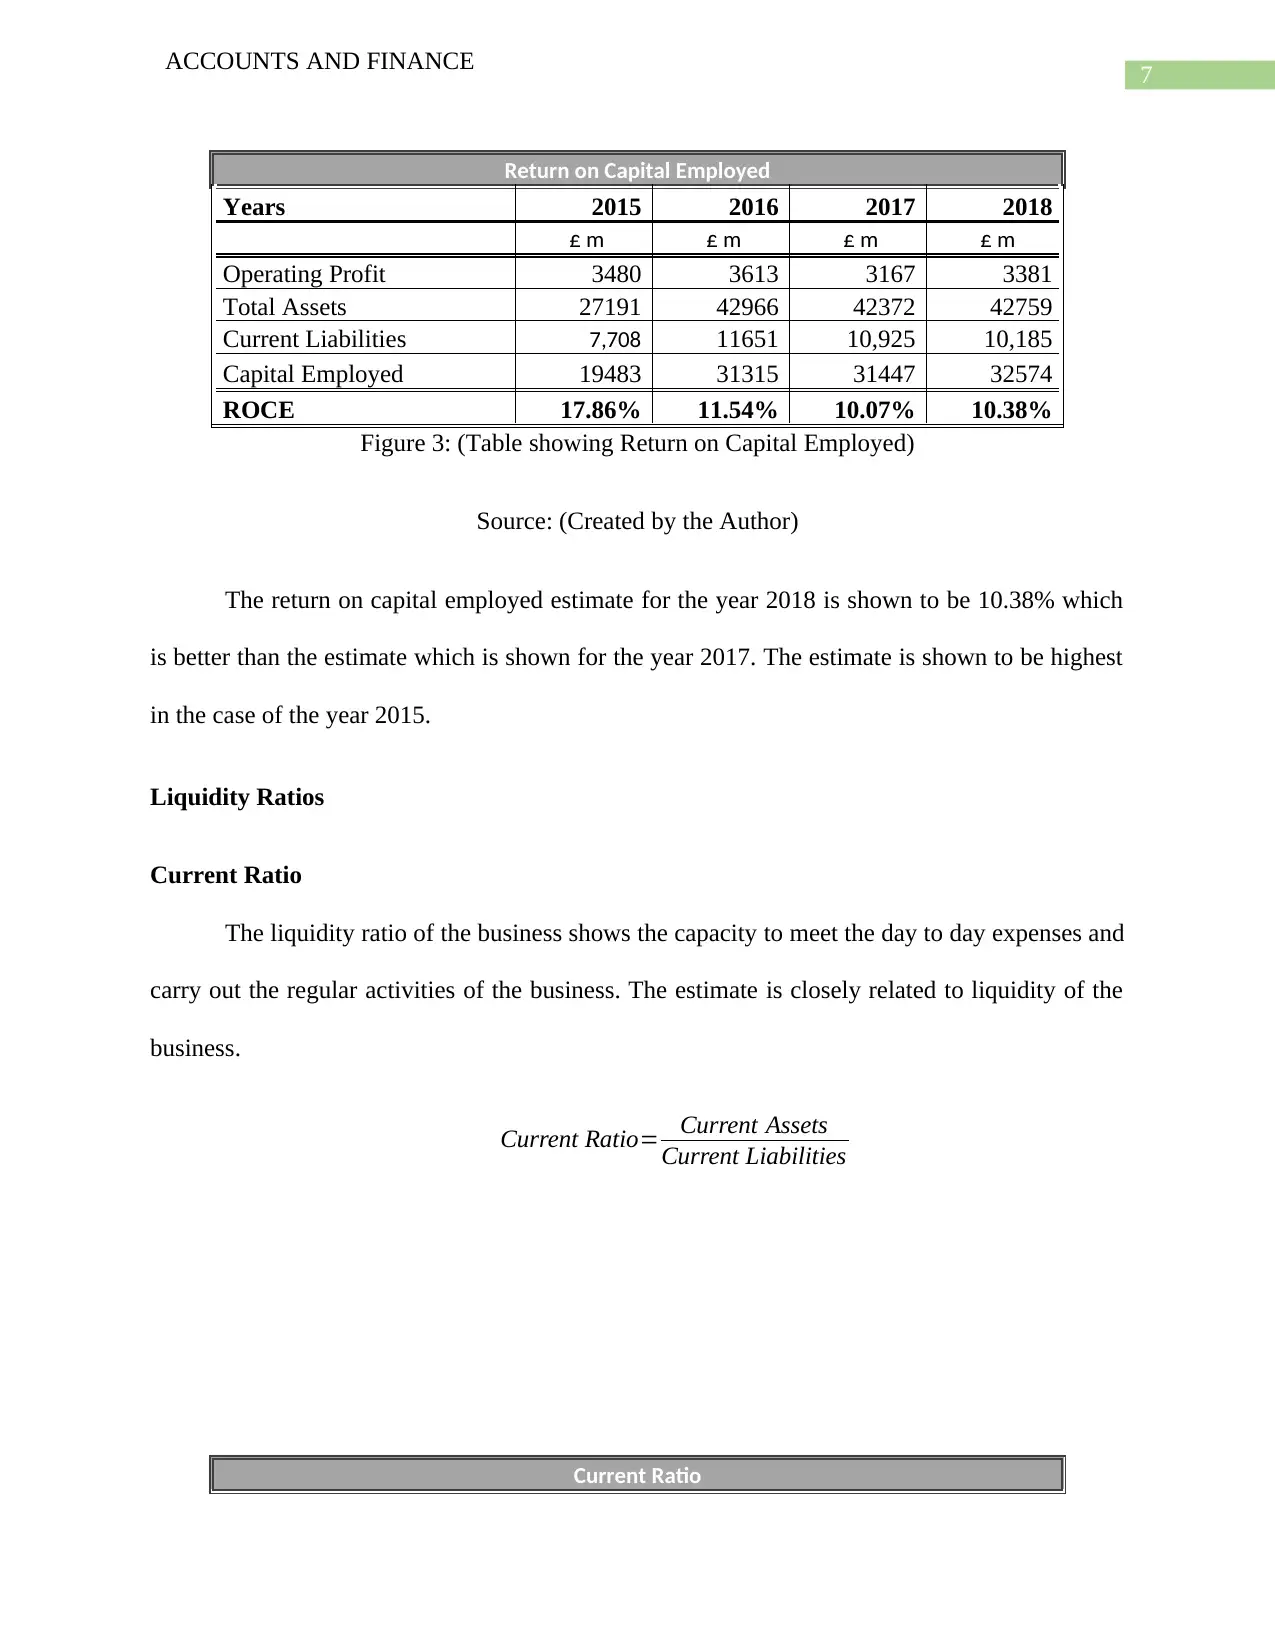
Return on Capital Employed
Years 2015 2016 2017 2018
£ m £ m £ m £ m
Operating Profit 3480 3613 3167 3381
Total Assets 27191 42966 42372 42759
Current Liabilities 7,708 11651 10,925 10,185
Capital Employed 19483 31315 31447 32574
ROCE 17.86% 11.54% 10.07% 10.38%
Figure 3: (Table showing Return on Capital Employed)
Source: (Created by the Author)
The return on capital employed estimate for the year 2018 is shown to be 10.38% which
is better than the estimate which is shown for the year 2017. The estimate is shown to be highest
in the case of the year 2015.
Liquidity Ratios
Current Ratio
The liquidity ratio of the business shows the capacity to meet the day to day expenses and
carry out the regular activities of the business. The estimate is closely related to liquidity of the
business.
Current Ratio= Current Assets
Current Liabilities
Current Ratio
ACCOUNTS AND FINANCE
Return on Capital Employed
Years 2015 2016 2017 2018
£ m £ m £ m £ m
Operating Profit 3480 3613 3167 3381
Total Assets 27191 42966 42372 42759
Current Liabilities 7,708 11651 10,925 10,185
Capital Employed 19483 31315 31447 32574
ROCE 17.86% 11.54% 10.07% 10.38%
Figure 3: (Table showing Return on Capital Employed)
Source: (Created by the Author)
The return on capital employed estimate for the year 2018 is shown to be 10.38% which
is better than the estimate which is shown for the year 2017. The estimate is shown to be highest
in the case of the year 2015.
Liquidity Ratios
Current Ratio
The liquidity ratio of the business shows the capacity to meet the day to day expenses and
carry out the regular activities of the business. The estimate is closely related to liquidity of the
business.
Current Ratio= Current Assets
Current Liabilities
Current Ratio
8
ACCOUNTS AND FINANCE
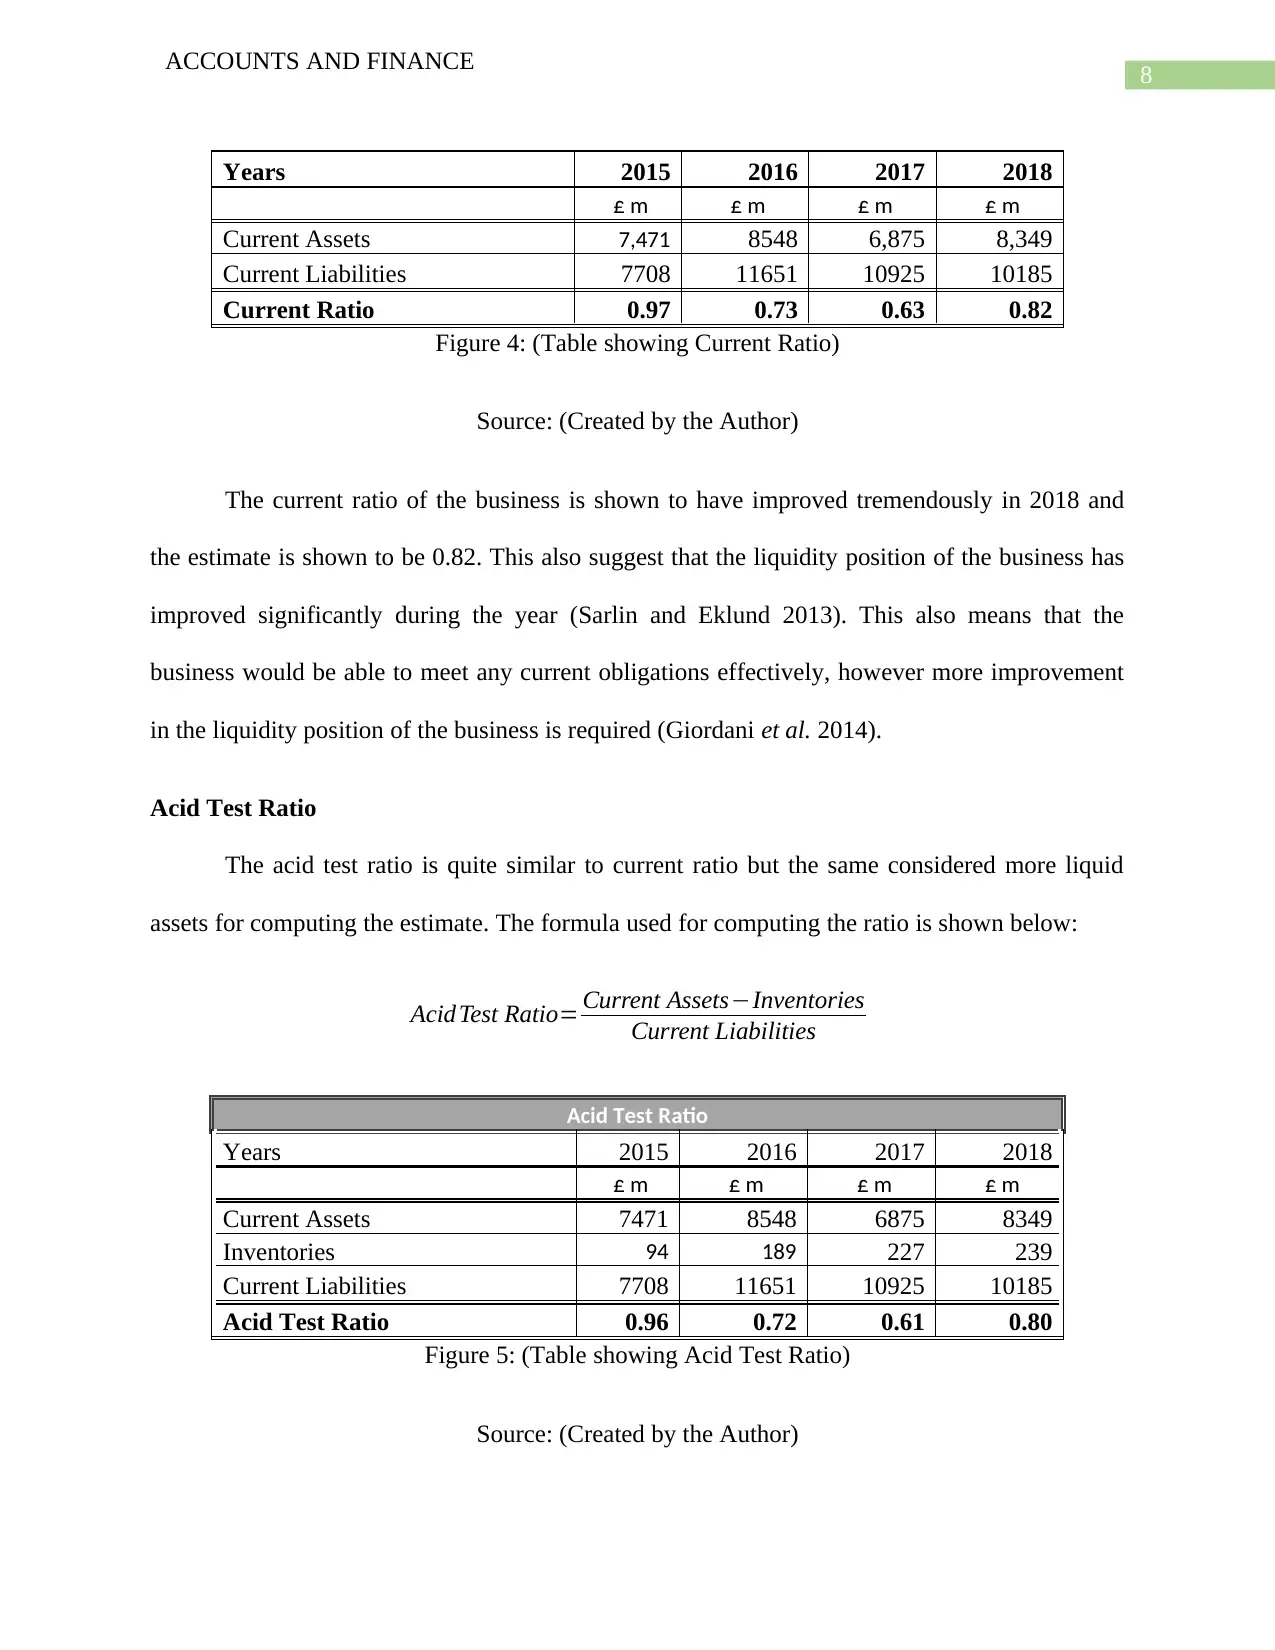
Years 2015 2016 2017 2018
£ m £ m £ m £ m
Current Assets 7,471 8548 6,875 8,349
Current Liabilities 7708 11651 10925 10185
Current Ratio 0.97 0.73 0.63 0.82
Figure 4: (Table showing Current Ratio)
Source: (Created by the Author)
The current ratio of the business is shown to have improved tremendously in 2018 and
the estimate is shown to be 0.82. This also suggest that the liquidity position of the business has
improved significantly during the year (Sarlin and Eklund 2013). This also means that the
business would be able to meet any current obligations effectively, however more improvement
in the liquidity position of the business is required (Giordani et al. 2014).
Acid Test Ratio
The acid test ratio is quite similar to current ratio but the same considered more liquid
assets for computing the estimate. The formula used for computing the ratio is shown below:
Acid Test Ratio= Current Assets−Inventories
Current Liabilities
Acid Test Ratio
Years 2015 2016 2017 2018
£ m £ m £ m £ m
Current Assets 7471 8548 6875 8349
Inventories 94 189 227 239
Current Liabilities 7708 11651 10925 10185
Acid Test Ratio 0.96 0.72 0.61 0.80
Figure 5: (Table showing Acid Test Ratio)
Source: (Created by the Author)
ACCOUNTS AND FINANCE
Years 2015 2016 2017 2018
£ m £ m £ m £ m
Current Assets 7,471 8548 6,875 8,349
Current Liabilities 7708 11651 10925 10185
Current Ratio 0.97 0.73 0.63 0.82
Figure 4: (Table showing Current Ratio)
Source: (Created by the Author)
The current ratio of the business is shown to have improved tremendously in 2018 and
the estimate is shown to be 0.82. This also suggest that the liquidity position of the business has
improved significantly during the year (Sarlin and Eklund 2013). This also means that the
business would be able to meet any current obligations effectively, however more improvement
in the liquidity position of the business is required (Giordani et al. 2014).
Acid Test Ratio
The acid test ratio is quite similar to current ratio but the same considered more liquid
assets for computing the estimate. The formula used for computing the ratio is shown below:
Acid Test Ratio= Current Assets−Inventories
Current Liabilities
Acid Test Ratio
Years 2015 2016 2017 2018
£ m £ m £ m £ m
Current Assets 7471 8548 6875 8349
Inventories 94 189 227 239
Current Liabilities 7708 11651 10925 10185
Acid Test Ratio 0.96 0.72 0.61 0.80
Figure 5: (Table showing Acid Test Ratio)
Source: (Created by the Author)
⊘ This is a preview!⊘
Do you want full access?
Subscribe today to unlock all pages.
Trusted by 1+ million students worldwide
9
ACCOUNTS AND FINANCE
The table which is shown above shows acid test ratio of the business and the same is
shown to have improved significantly during the year 2018 in comparison to previous year
analysis (Mankin and Jewell 2014). This shows that overall liquidity position of the business has
improved.
Activity Ratios
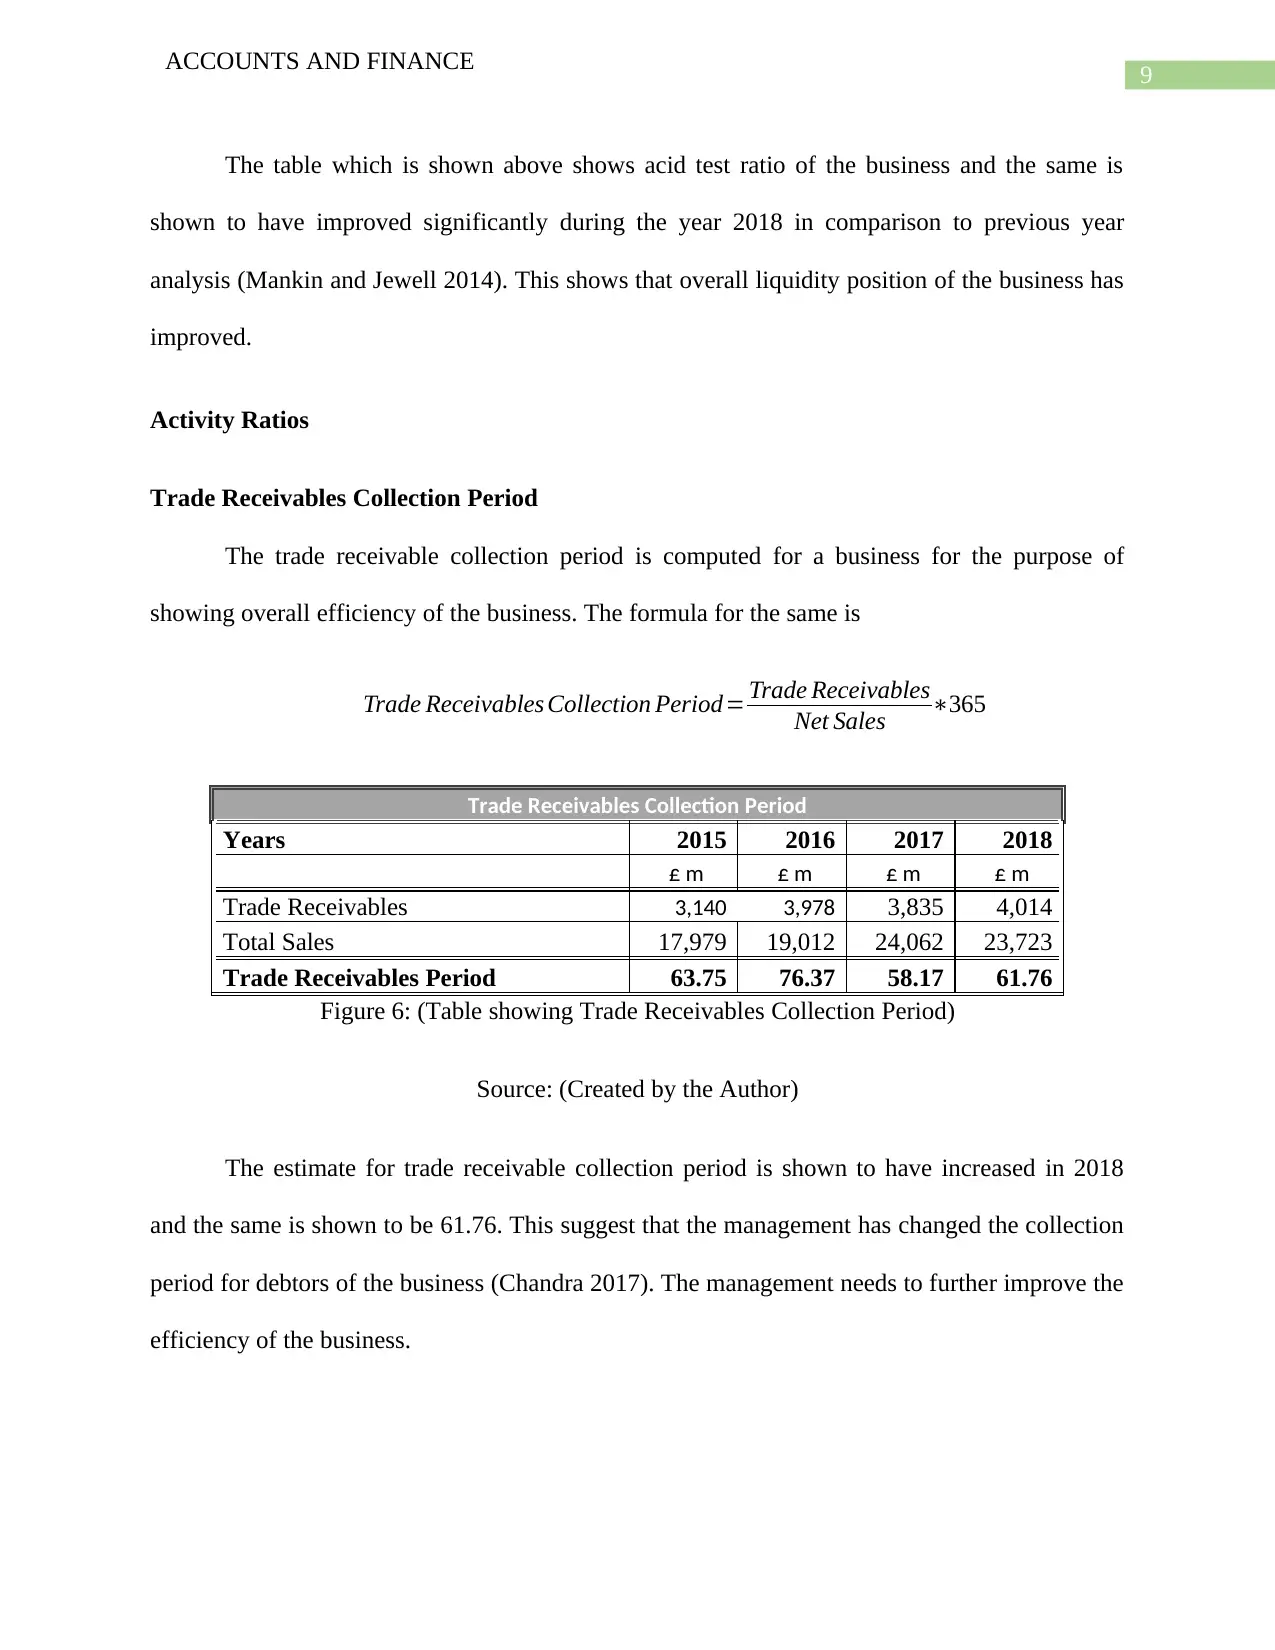
Trade Receivables Collection Period
The trade receivable collection period is computed for a business for the purpose of
showing overall efficiency of the business. The formula for the same is
Trade Receivables Collection Period= Trade Receivables
Net Sales ∗365
Trade Receivables Collection Period
Years 2015 2016 2017 2018
£ m £ m £ m £ m
Trade Receivables 3,140 3,978 3,835 4,014
Total Sales 17,979 19,012 24,062 23,723
Trade Receivables Period 63.75 76.37 58.17 61.76
Figure 6: (Table showing Trade Receivables Collection Period)
Source: (Created by the Author)
The estimate for trade receivable collection period is shown to have increased in 2018
and the same is shown to be 61.76. This suggest that the management has changed the collection
period for debtors of the business (Chandra 2017). The management needs to further improve the
efficiency of the business.
ACCOUNTS AND FINANCE
The table which is shown above shows acid test ratio of the business and the same is
shown to have improved significantly during the year 2018 in comparison to previous year
analysis (Mankin and Jewell 2014). This shows that overall liquidity position of the business has
improved.
Activity Ratios
Trade Receivables Collection Period
The trade receivable collection period is computed for a business for the purpose of
showing overall efficiency of the business. The formula for the same is
Trade Receivables Collection Period= Trade Receivables
Net Sales ∗365
Trade Receivables Collection Period
Years 2015 2016 2017 2018
£ m £ m £ m £ m
Trade Receivables 3,140 3,978 3,835 4,014
Total Sales 17,979 19,012 24,062 23,723
Trade Receivables Period 63.75 76.37 58.17 61.76
Figure 6: (Table showing Trade Receivables Collection Period)
Source: (Created by the Author)
The estimate for trade receivable collection period is shown to have increased in 2018
and the same is shown to be 61.76. This suggest that the management has changed the collection
period for debtors of the business (Chandra 2017). The management needs to further improve the
efficiency of the business.
Paraphrase This Document
Need a fresh take? Get an instant paraphrase of this document with our AI Paraphraser
10
ACCOUNTS AND FINANCE
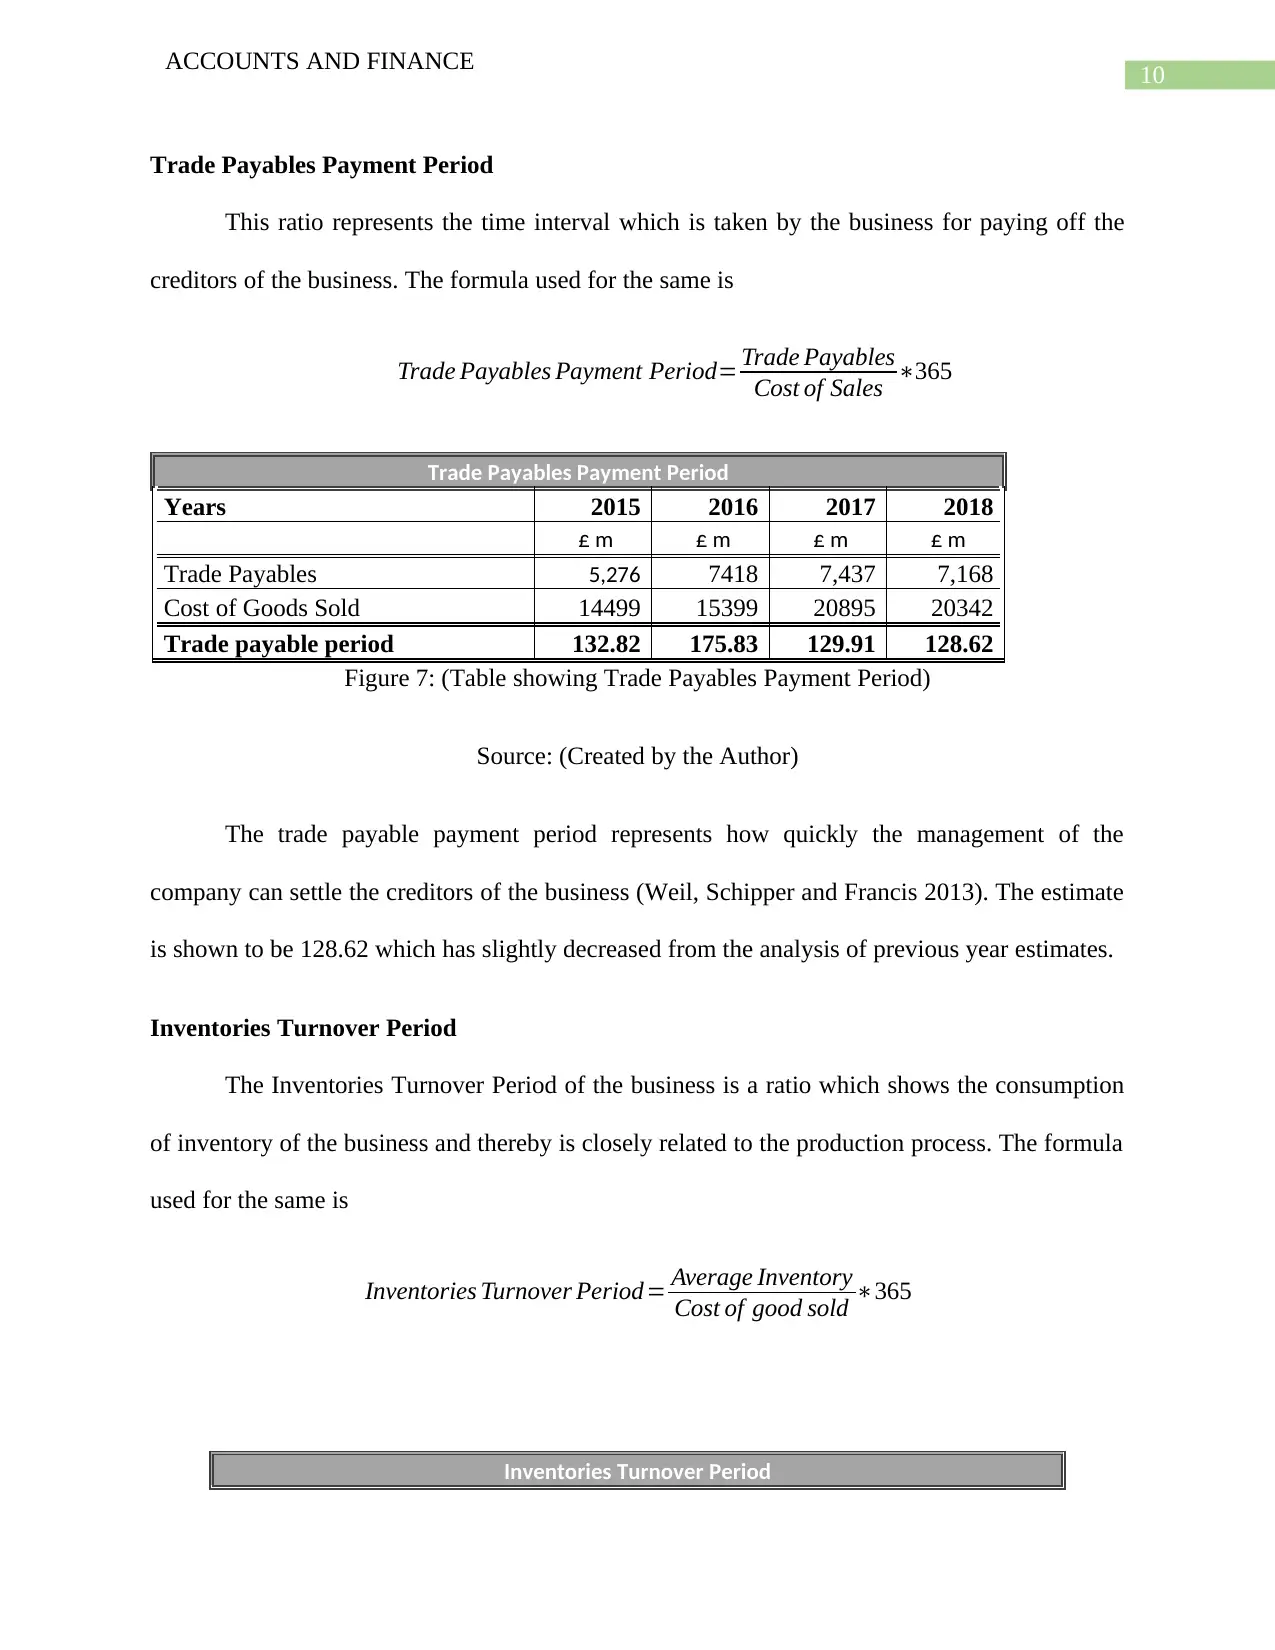
Trade Payables Payment Period
This ratio represents the time interval which is taken by the business for paying off the
creditors of the business. The formula used for the same is
Trade Payables Payment Period= Trade Payables
Cost of Sales ∗365
Trade Payables Payment Period
Years 2015 2016 2017 2018
£ m £ m £ m £ m
Trade Payables 5,276 7418 7,437 7,168
Cost of Goods Sold 14499 15399 20895 20342
Trade payable period 132.82 175.83 129.91 128.62
Figure 7: (Table showing Trade Payables Payment Period)
Source: (Created by the Author)
The trade payable payment period represents how quickly the management of the
company can settle the creditors of the business (Weil, Schipper and Francis 2013). The estimate
is shown to be 128.62 which has slightly decreased from the analysis of previous year estimates.
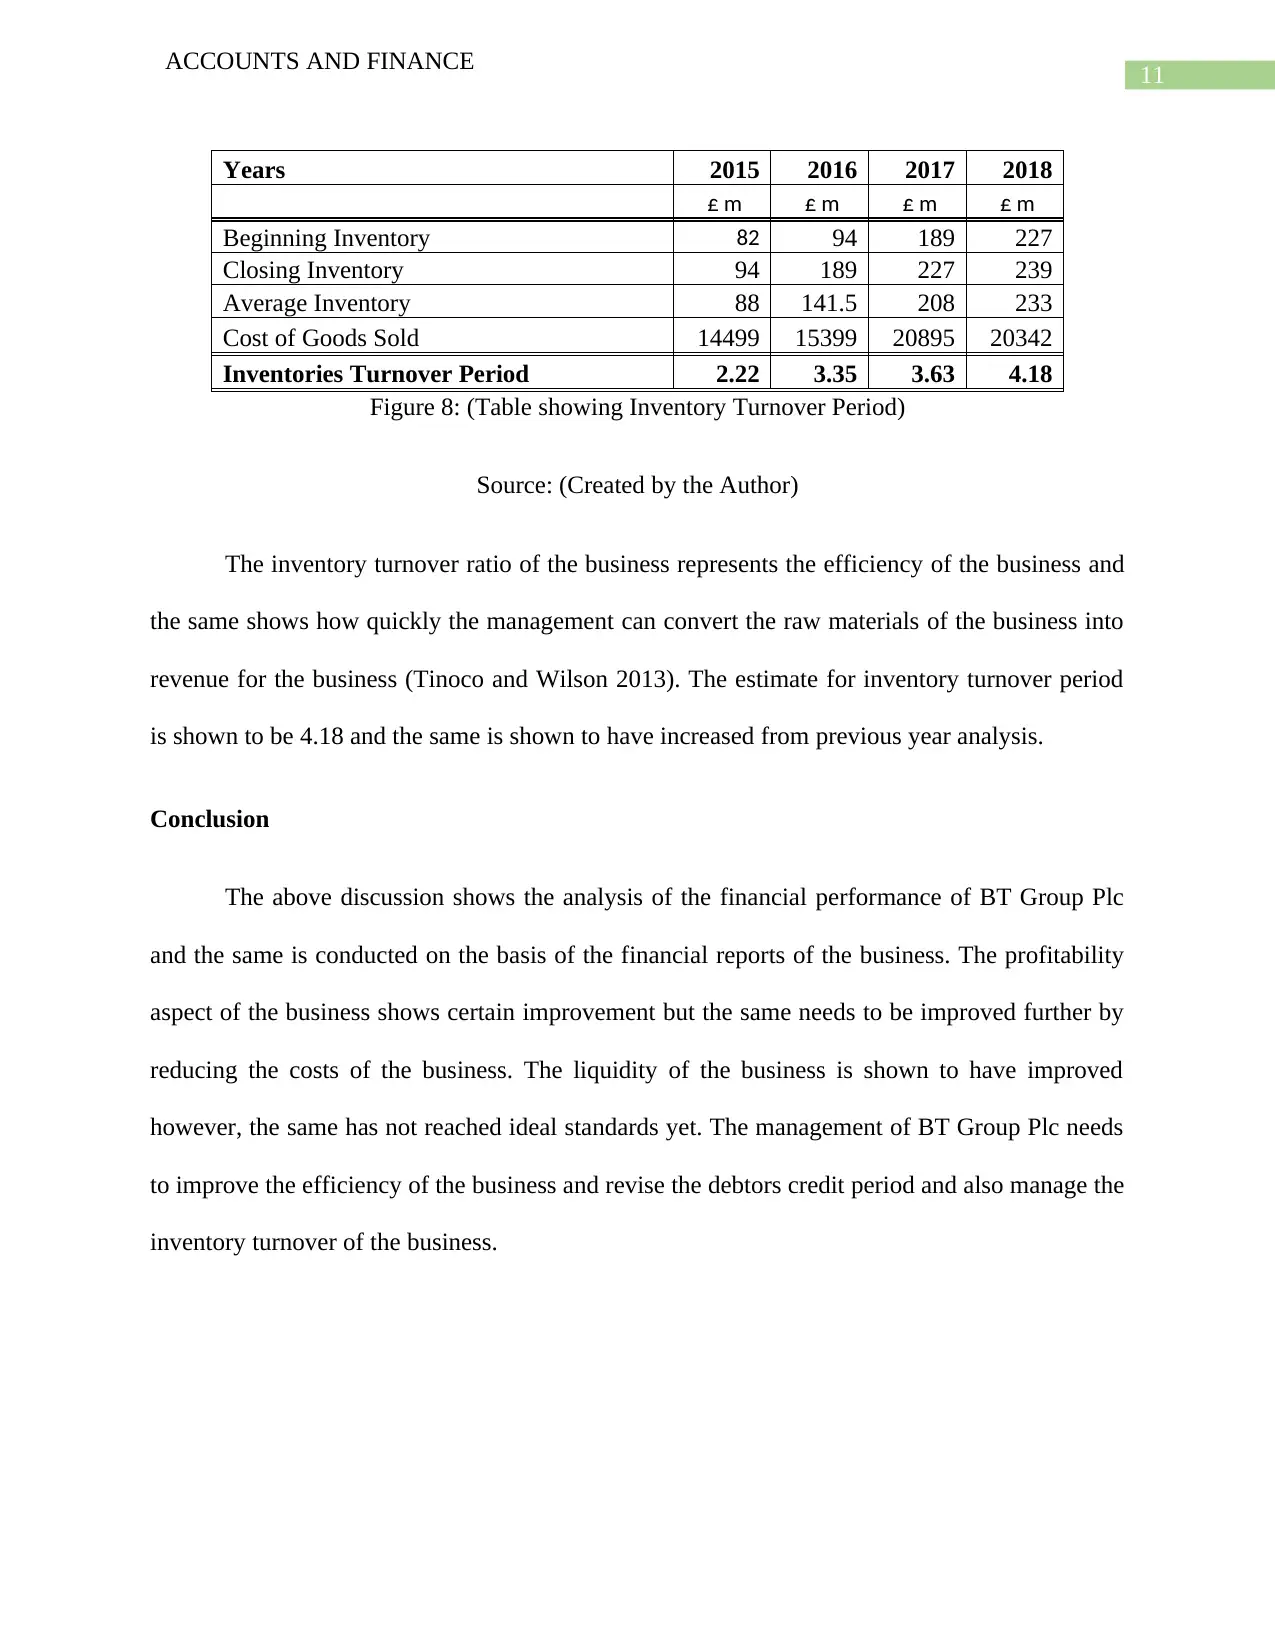
Inventories Turnover Period
The Inventories Turnover Period of the business is a ratio which shows the consumption
of inventory of the business and thereby is closely related to the production process. The formula
used for the same is
Inventories Turnover Period = Average Inventory
Cost of good sold ∗365
Inventories Turnover Period
ACCOUNTS AND FINANCE
Trade Payables Payment Period
This ratio represents the time interval which is taken by the business for paying off the
creditors of the business. The formula used for the same is
Trade Payables Payment Period= Trade Payables
Cost of Sales ∗365
Trade Payables Payment Period
Years 2015 2016 2017 2018
£ m £ m £ m £ m
Trade Payables 5,276 7418 7,437 7,168
Cost of Goods Sold 14499 15399 20895 20342
Trade payable period 132.82 175.83 129.91 128.62
Figure 7: (Table showing Trade Payables Payment Period)
Source: (Created by the Author)
The trade payable payment period represents how quickly the management of the
company can settle the creditors of the business (Weil, Schipper and Francis 2013). The estimate
is shown to be 128.62 which has slightly decreased from the analysis of previous year estimates.
Inventories Turnover Period
The Inventories Turnover Period of the business is a ratio which shows the consumption
of inventory of the business and thereby is closely related to the production process. The formula
used for the same is
Inventories Turnover Period = Average Inventory
Cost of good sold ∗365
Inventories Turnover Period
11
ACCOUNTS AND FINANCE
Years 2015 2016 2017 2018
£ m £ m £ m £ m
Beginning Inventory 82 94 189 227
Closing Inventory 94 189 227 239
Average Inventory 88 141.5 208 233
Cost of Goods Sold 14499 15399 20895 20342
Inventories Turnover Period 2.22 3.35 3.63 4.18
Figure 8: (Table showing Inventory Turnover Period)
Source: (Created by the Author)
The inventory turnover ratio of the business represents the efficiency of the business and
the same shows how quickly the management can convert the raw materials of the business into
revenue for the business (Tinoco and Wilson 2013). The estimate for inventory turnover period
is shown to be 4.18 and the same is shown to have increased from previous year analysis.
Conclusion
The above discussion shows the analysis of the financial performance of BT Group Plc
and the same is conducted on the basis of the financial reports of the business. The profitability
aspect of the business shows certain improvement but the same needs to be improved further by
reducing the costs of the business. The liquidity of the business is shown to have improved
however, the same has not reached ideal standards yet. The management of BT Group Plc needs
to improve the efficiency of the business and revise the debtors credit period and also manage the
inventory turnover of the business.
⊘ This is a preview!⊘
Do you want full access?
Subscribe today to unlock all pages.
Trusted by 1+ million students worldwide
1 out of 20
Related Documents


Your All-in-One AI-Powered Toolkit for Academic Success.
+13062052269
info@desklib.com
Available 24*7 on WhatsApp / Email
![[object Object]](/_next/static/media/star-bottom.7253800d.svg)
Unlock your academic potential
Copyright © 2020–2026 A2Z Services. All Rights Reserved. Developed and managed by ZUCOL.