BSB123 Data Analysis Report: Exploring Academic Achievement Factors

Verified

Added on  2022/08/19

|4
|862
|336
Report
AI Summary
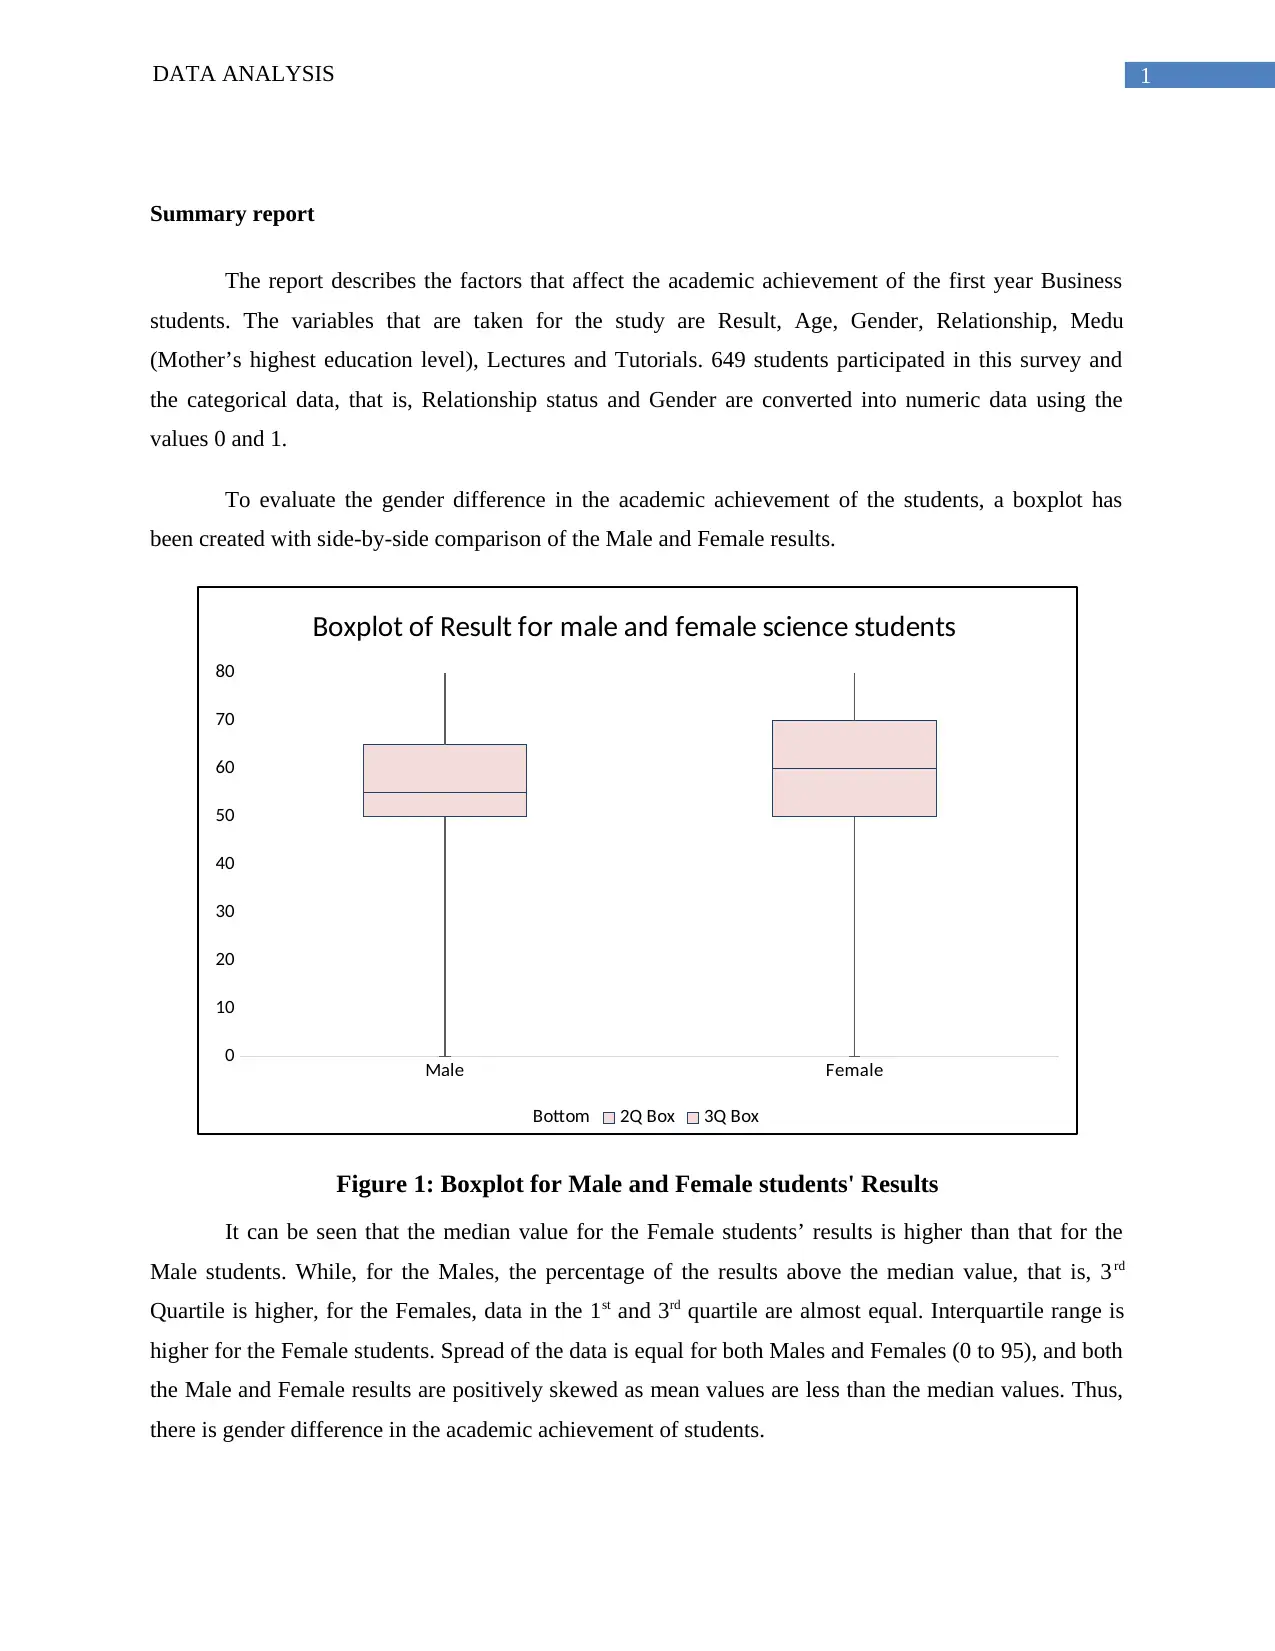
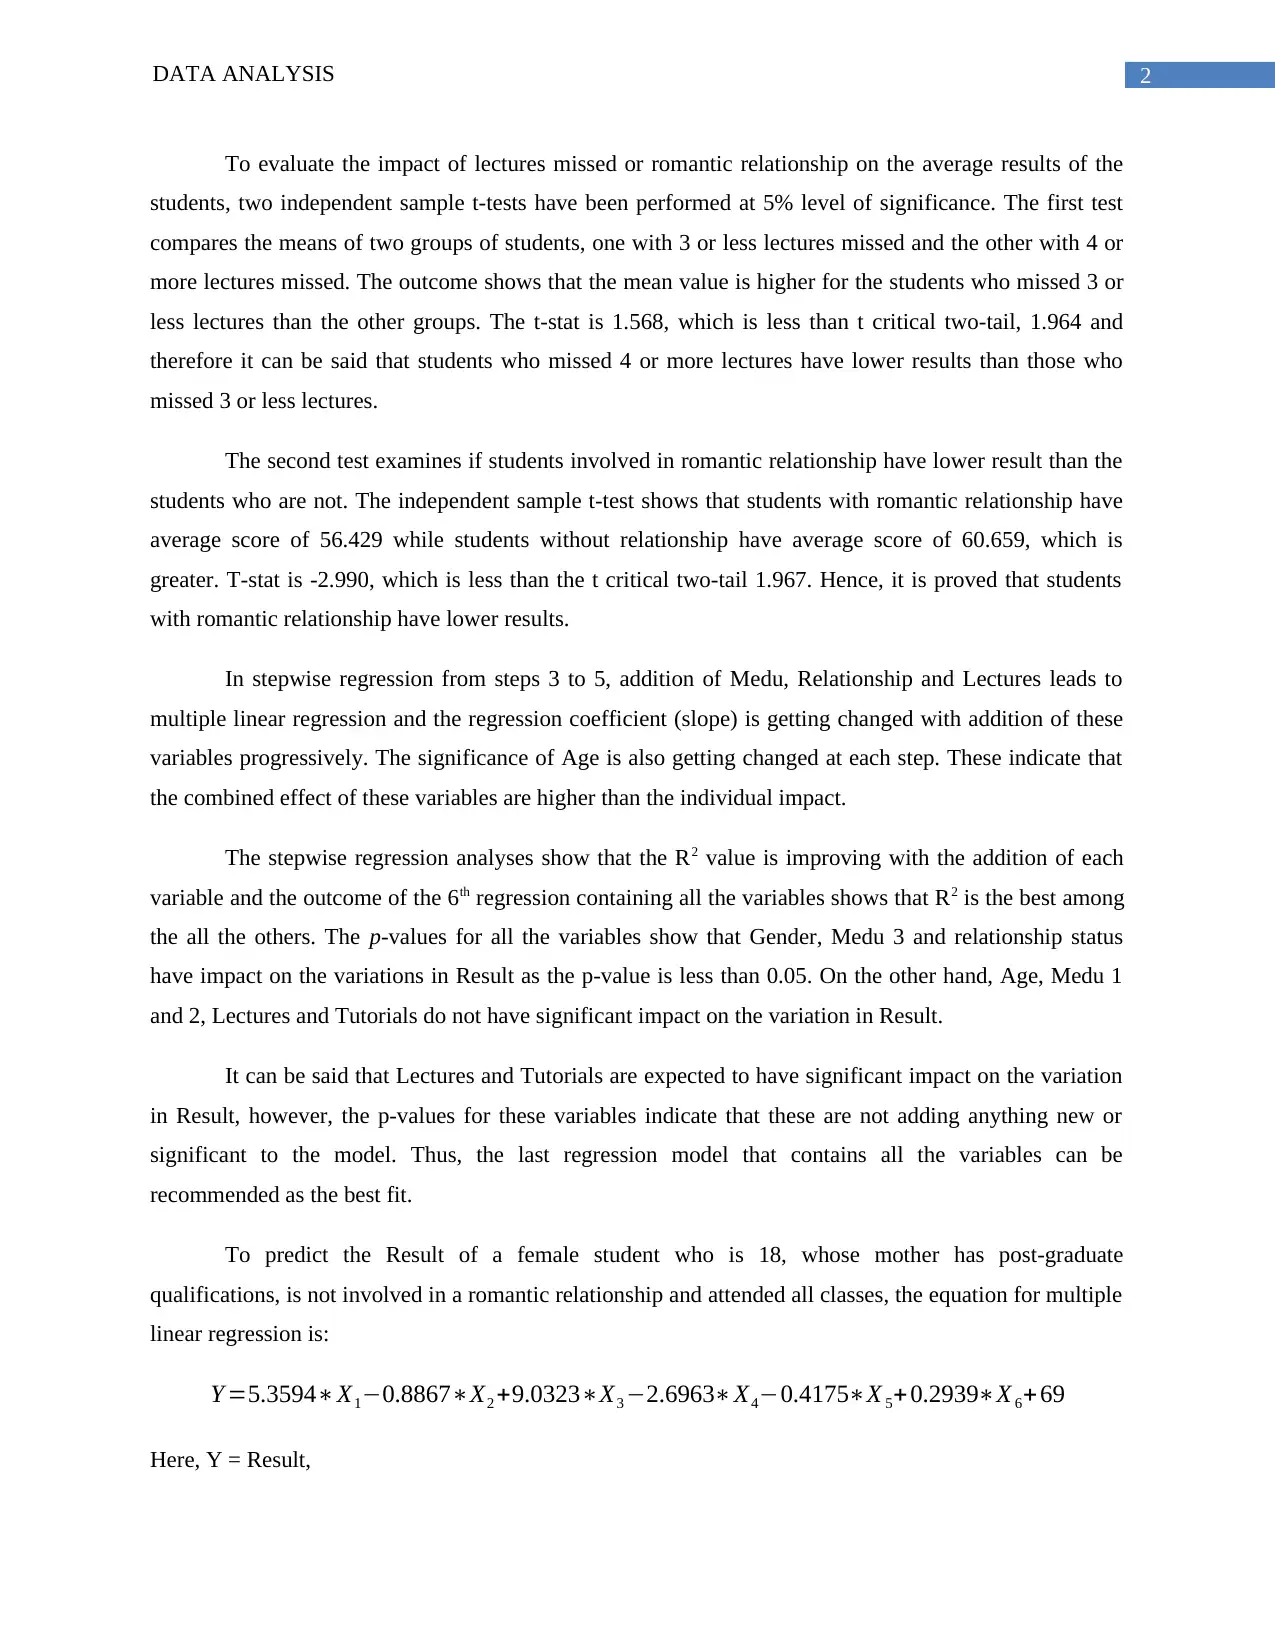
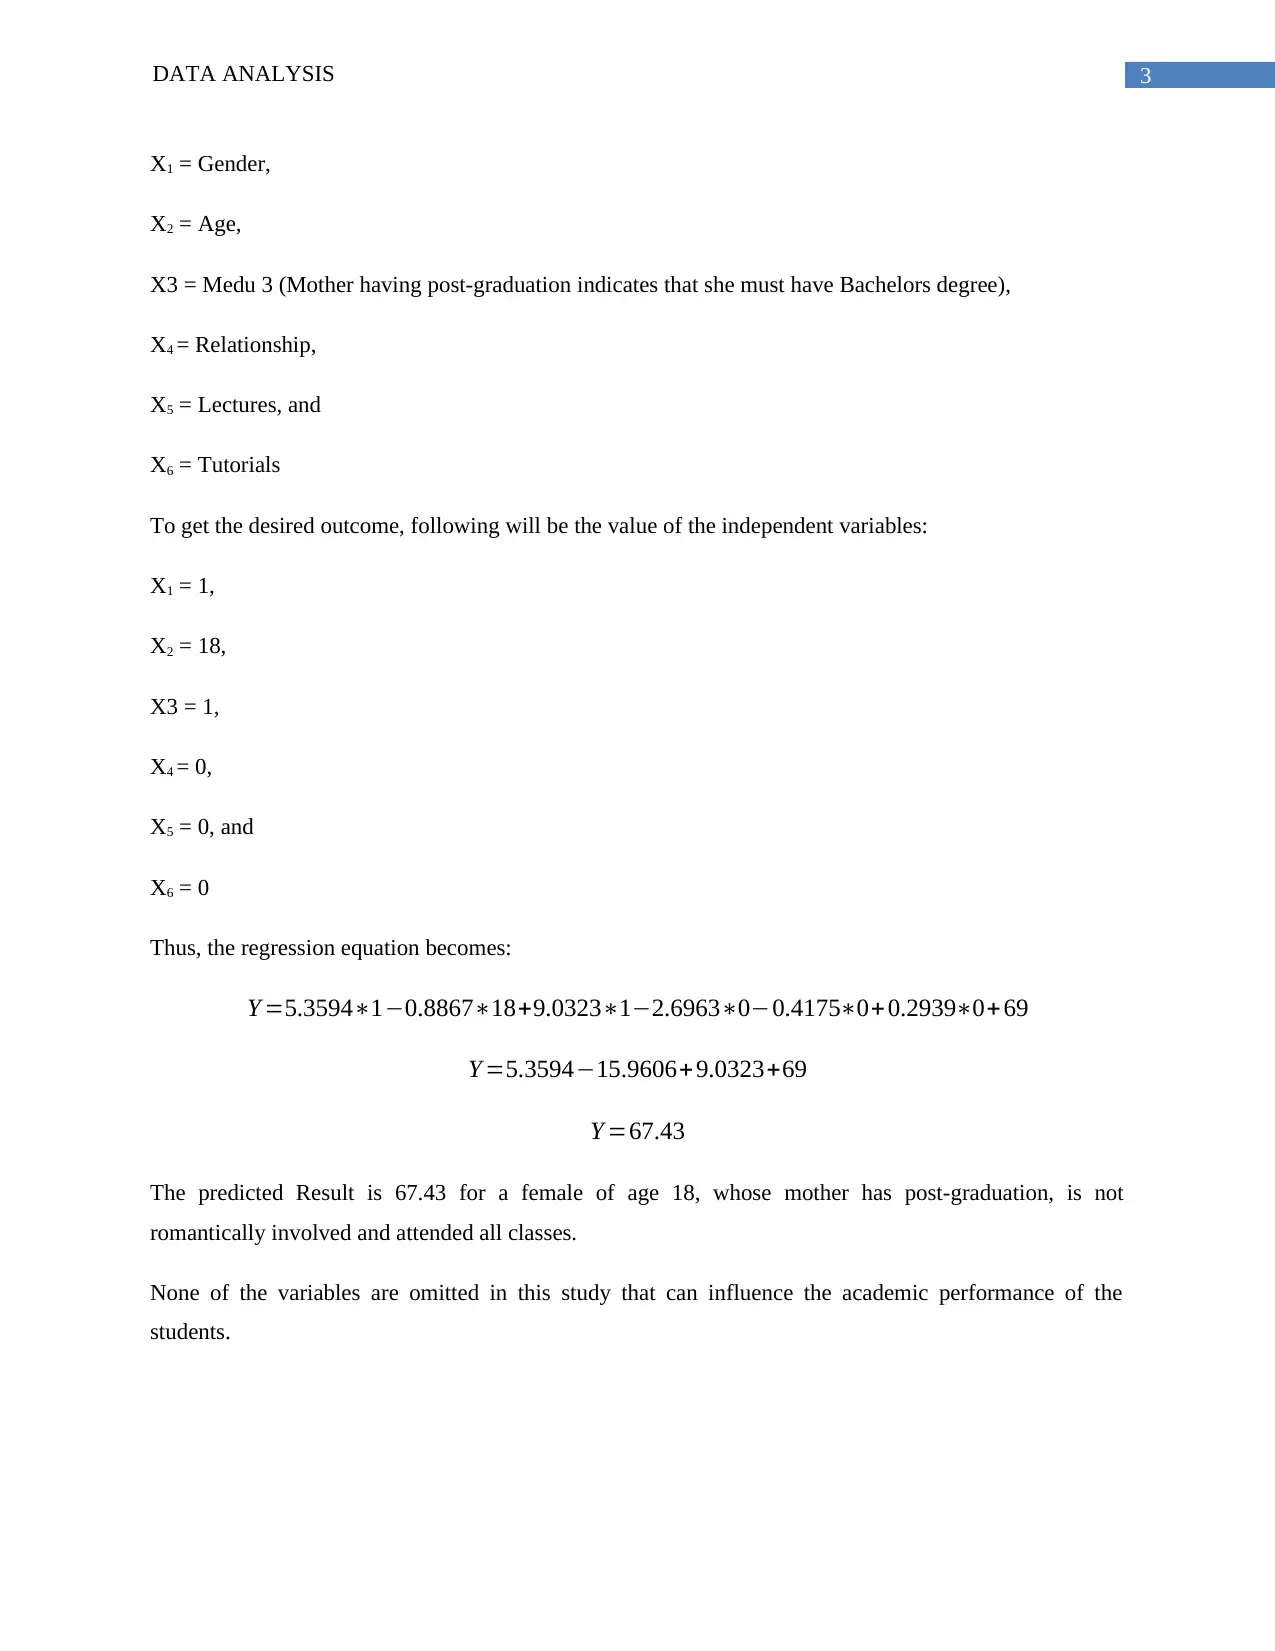
This report analyzes factors affecting the academic achievement of first-year business students. The study, based on a survey of 649 students, investigates the impact of variables such as results, age, gender, relationship status, mother's education, lecture attendance, and tutorial attendance. Statistical methods, including boxplots and independent sample t-tests, are used to assess gender differences and the influence of missed lectures and romantic relationships. Stepwise regression is employed to determine the combined effects of multiple variables, with the final model recommending the inclusion of all variables. The report concludes by predicting the results of a female student based on the regression equation. The analysis indicates that gender, mother's education level, and relationship status significantly influence academic performance. The report utilizes various statistical techniques to provide a comprehensive analysis of the data, identifying key factors related to academic success.
Document Page
Running head: DATA ANALYSIS
Data Analysis
Name of the Student:
Name of the University:
Author note:
tabler-icon-diamond-filled.svg

Paraphrase This Document

Need a fresh take? Get an instant paraphrase of this document with our AI Paraphraser
Document Page
1DATA ANALYSIS
Summary report
The report describes the factors that affect the academic achievement of the first year Business
students. The variables that are taken for the study are Result, Age, Gender, Relationship, Medu
(Mother’s highest education level), Lectures and Tutorials. 649 students participated in this survey and
the categorical data, that is, Relationship status and Gender are converted into numeric data using the
values 0 and 1.
To evaluate the gender difference in the academic achievement of the students, a boxplot has
been created with side-by-side comparison of the Male and Female results.
Male Female
0
10
20
30
40
50
60
70
80
Boxplot of Result for male and female science students
Bottom 2Q Box 3Q Box
Figure 1: Boxplot for Male and Female students' Results
It can be seen that the median value for the Female students’ results is higher than that for the
Male students. While, for the Males, the percentage of the results above the median value, that is, 3 rd
Quartile is higher, for the Females, data in the 1st and 3rd quartile are almost equal. Interquartile range is
higher for the Female students. Spread of the data is equal for both Males and Females (0 to 95), and both
the Male and Female results are positively skewed as mean values are less than the median values. Thus,
there is gender difference in the academic achievement of students.
Document Page
2DATA ANALYSIS
To evaluate the impact of lectures missed or romantic relationship on the average results of the
students, two independent sample t-tests have been performed at 5% level of significance. The first test
compares the means of two groups of students, one with 3 or less lectures missed and the other with 4 or
more lectures missed. The outcome shows that the mean value is higher for the students who missed 3 or
less lectures than the other groups. The t-stat is 1.568, which is less than t critical two-tail, 1.964 and
therefore it can be said that students who missed 4 or more lectures have lower results than those who
missed 3 or less lectures.
The second test examines if students involved in romantic relationship have lower result than the
students who are not. The independent sample t-test shows that students with romantic relationship have
average score of 56.429 while students without relationship have average score of 60.659, which is
greater. T-stat is -2.990, which is less than the t critical two-tail 1.967. Hence, it is proved that students
with romantic relationship have lower results.
In stepwise regression from steps 3 to 5, addition of Medu, Relationship and Lectures leads to
multiple linear regression and the regression coefficient (slope) is getting changed with addition of these
variables progressively. The significance of Age is also getting changed at each step. These indicate that
the combined effect of these variables are higher than the individual impact.
The stepwise regression analyses show that the R2 value is improving with the addition of each
variable and the outcome of the 6th regression containing all the variables shows that R2 is the best among
the all the others. The p-values for all the variables show that Gender, Medu 3 and relationship status
have impact on the variations in Result as the p-value is less than 0.05. On the other hand, Age, Medu 1
and 2, Lectures and Tutorials do not have significant impact on the variation in Result.
It can be said that Lectures and Tutorials are expected to have significant impact on the variation
in Result, however, the p-values for these variables indicate that these are not adding anything new or
significant to the model. Thus, the last regression model that contains all the variables can be
recommended as the best fit.
To predict the Result of a female student who is 18, whose mother has post-graduate
qualifications, is not involved in a romantic relationship and attended all classes, the equation for multiple
linear regression is:
Y =5.3594X10.8867X2 +9.0323X3 2.6963X40.4175X 5+ 0.2939X 6+ 69
Here, Y = Result,
Document Page
3DATA ANALYSIS
X1 = Gender,
X2 = Age,
X3 = Medu 3 (Mother having post-graduation indicates that she must have Bachelors degree),
X4 = Relationship,
X5 = Lectures, and
X6 = Tutorials
To get the desired outcome, following will be the value of the independent variables:
X1 = 1,
X2 = 18,
X3 = 1,
X4 = 0,
X5 = 0, and
X6 = 0
Thus, the regression equation becomes:
Y =5.359410.886718+9.032312.696300.41750+ 0.29390+69
Y =5.359415.9606+ 9.0323+69
Y =67.43
The predicted Result is 67.43 for a female of age 18, whose mother has post-graduation, is not
romantically involved and attended all classes.
None of the variables are omitted in this study that can influence the academic performance of the
students.
chevron_up_icon
1 out of 4
circle_padding
hide_on_mobile
zoom_out_icon
[object Object]