Analysis of ACC Systems and Processes Report: Finance Module
VerifiedAdded on 2020/06/04
|18
|2092
|39
Report
AI Summary
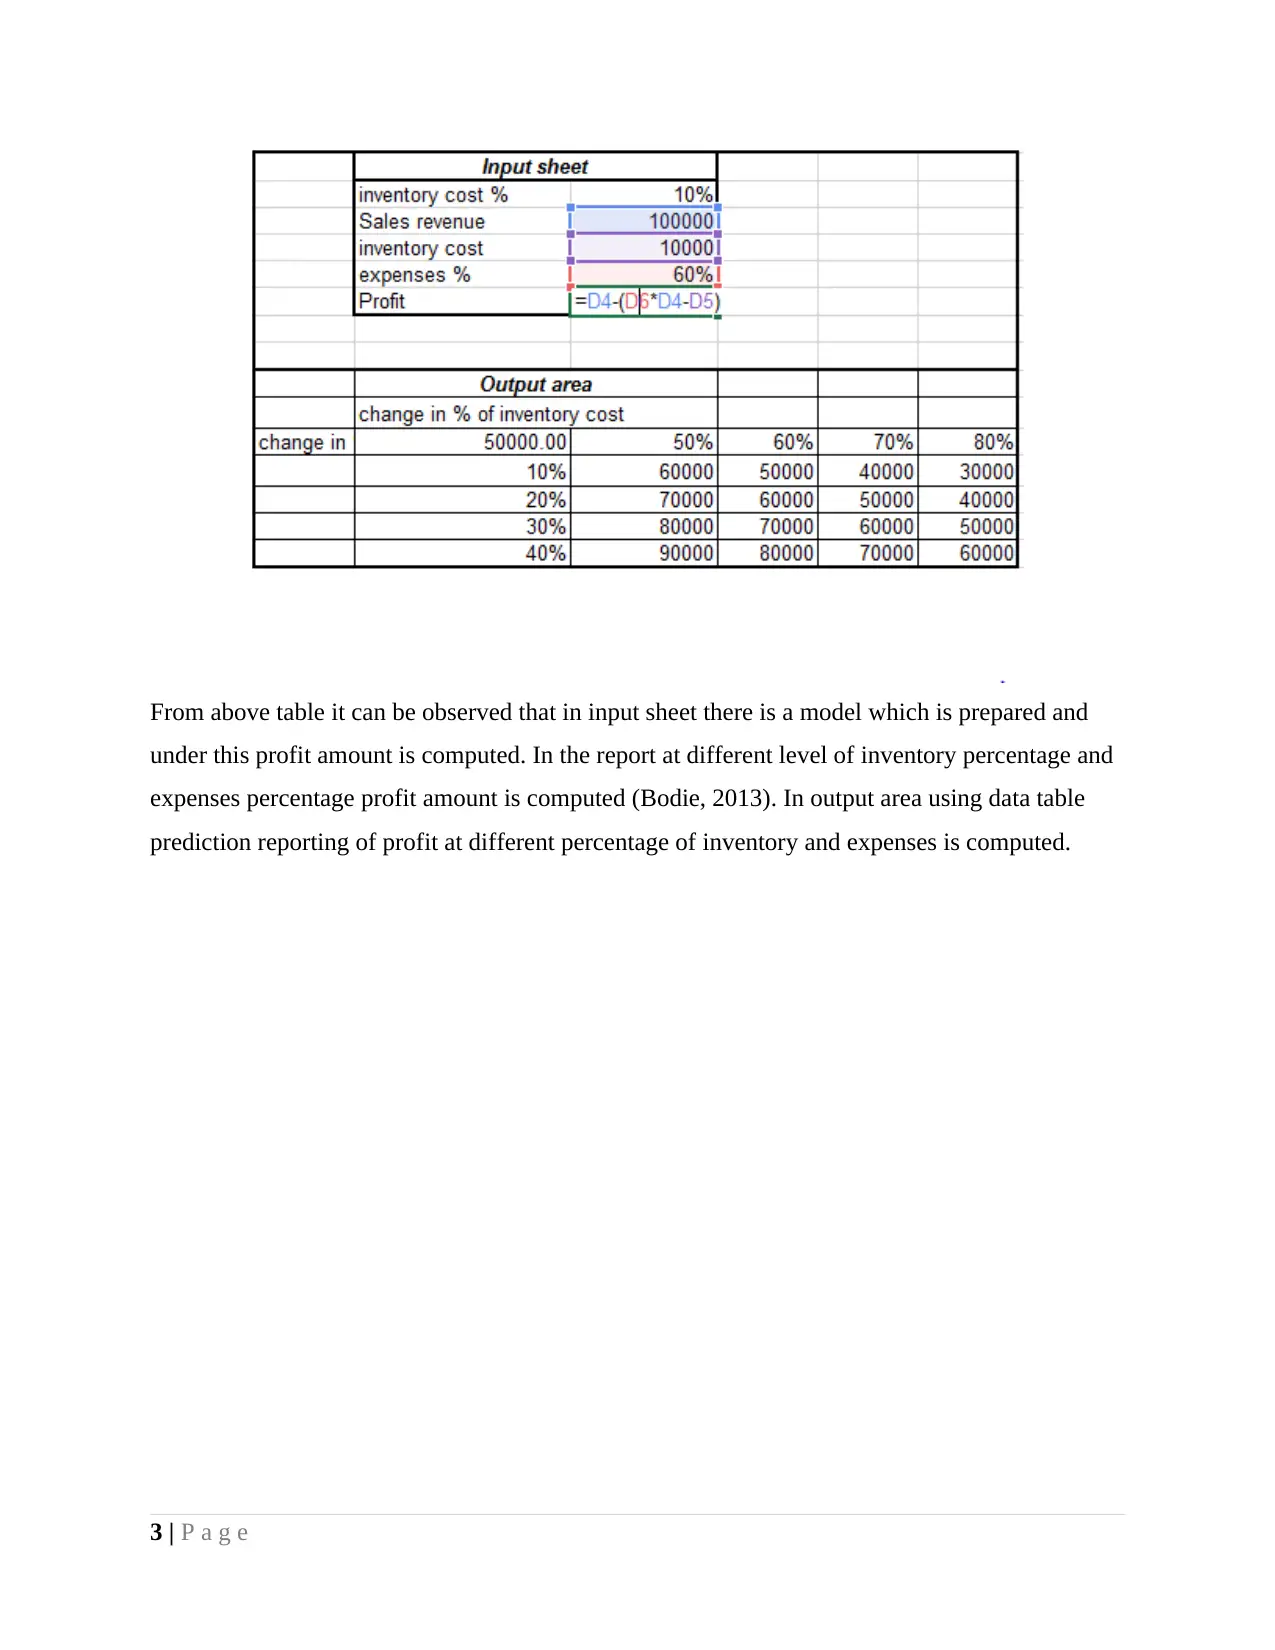
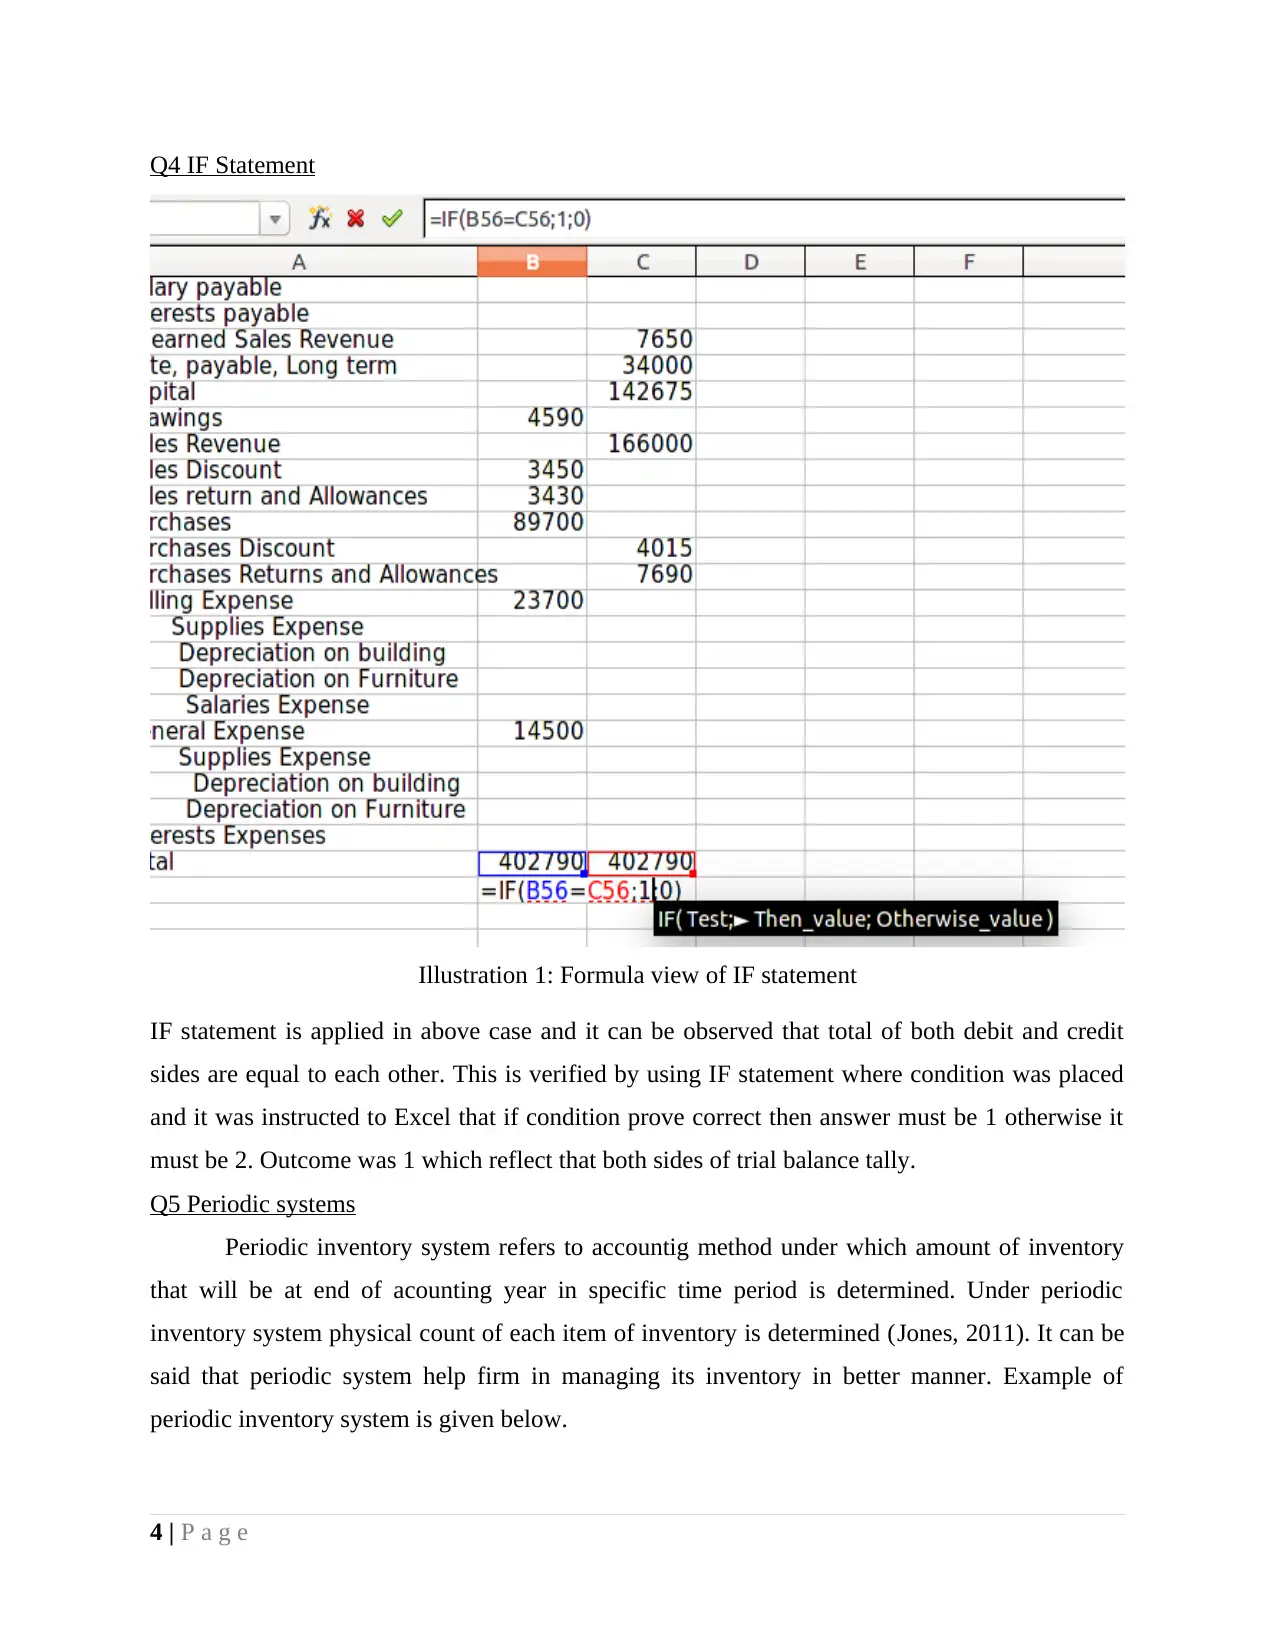
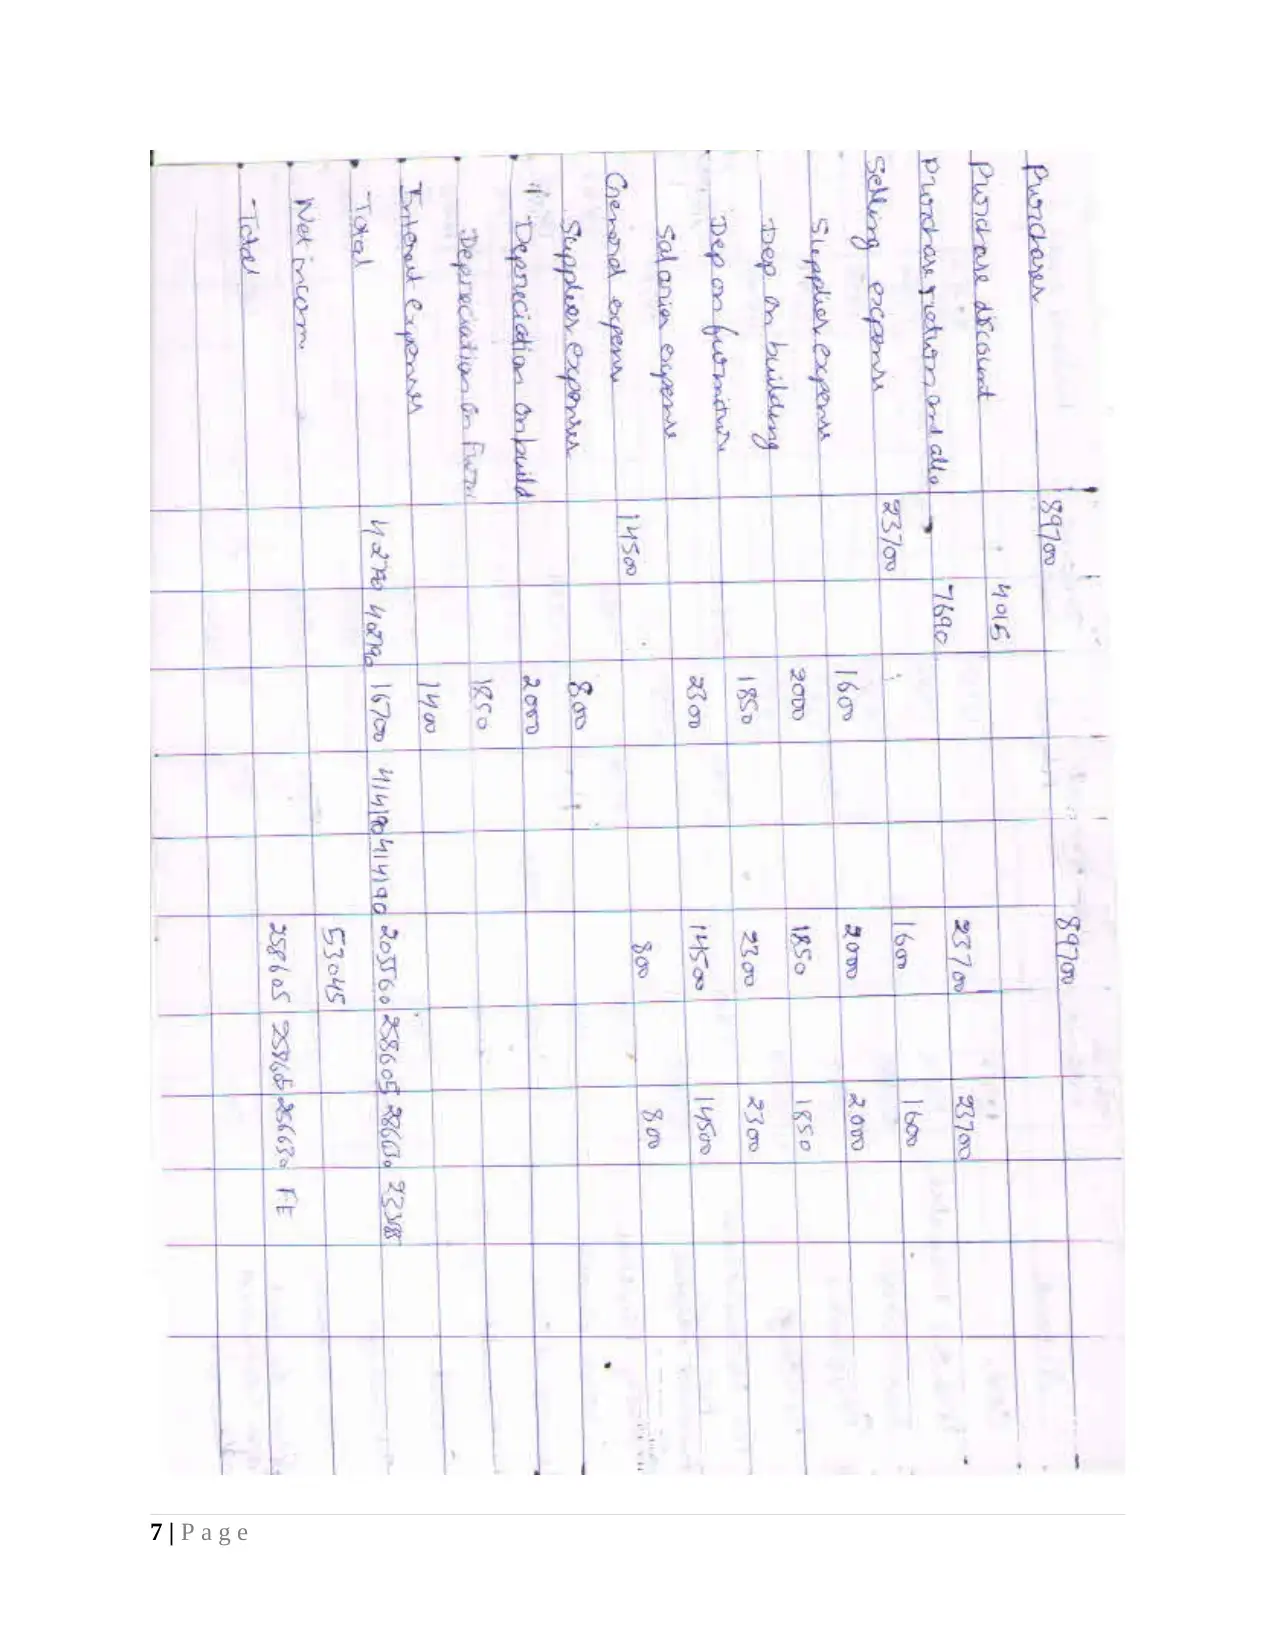
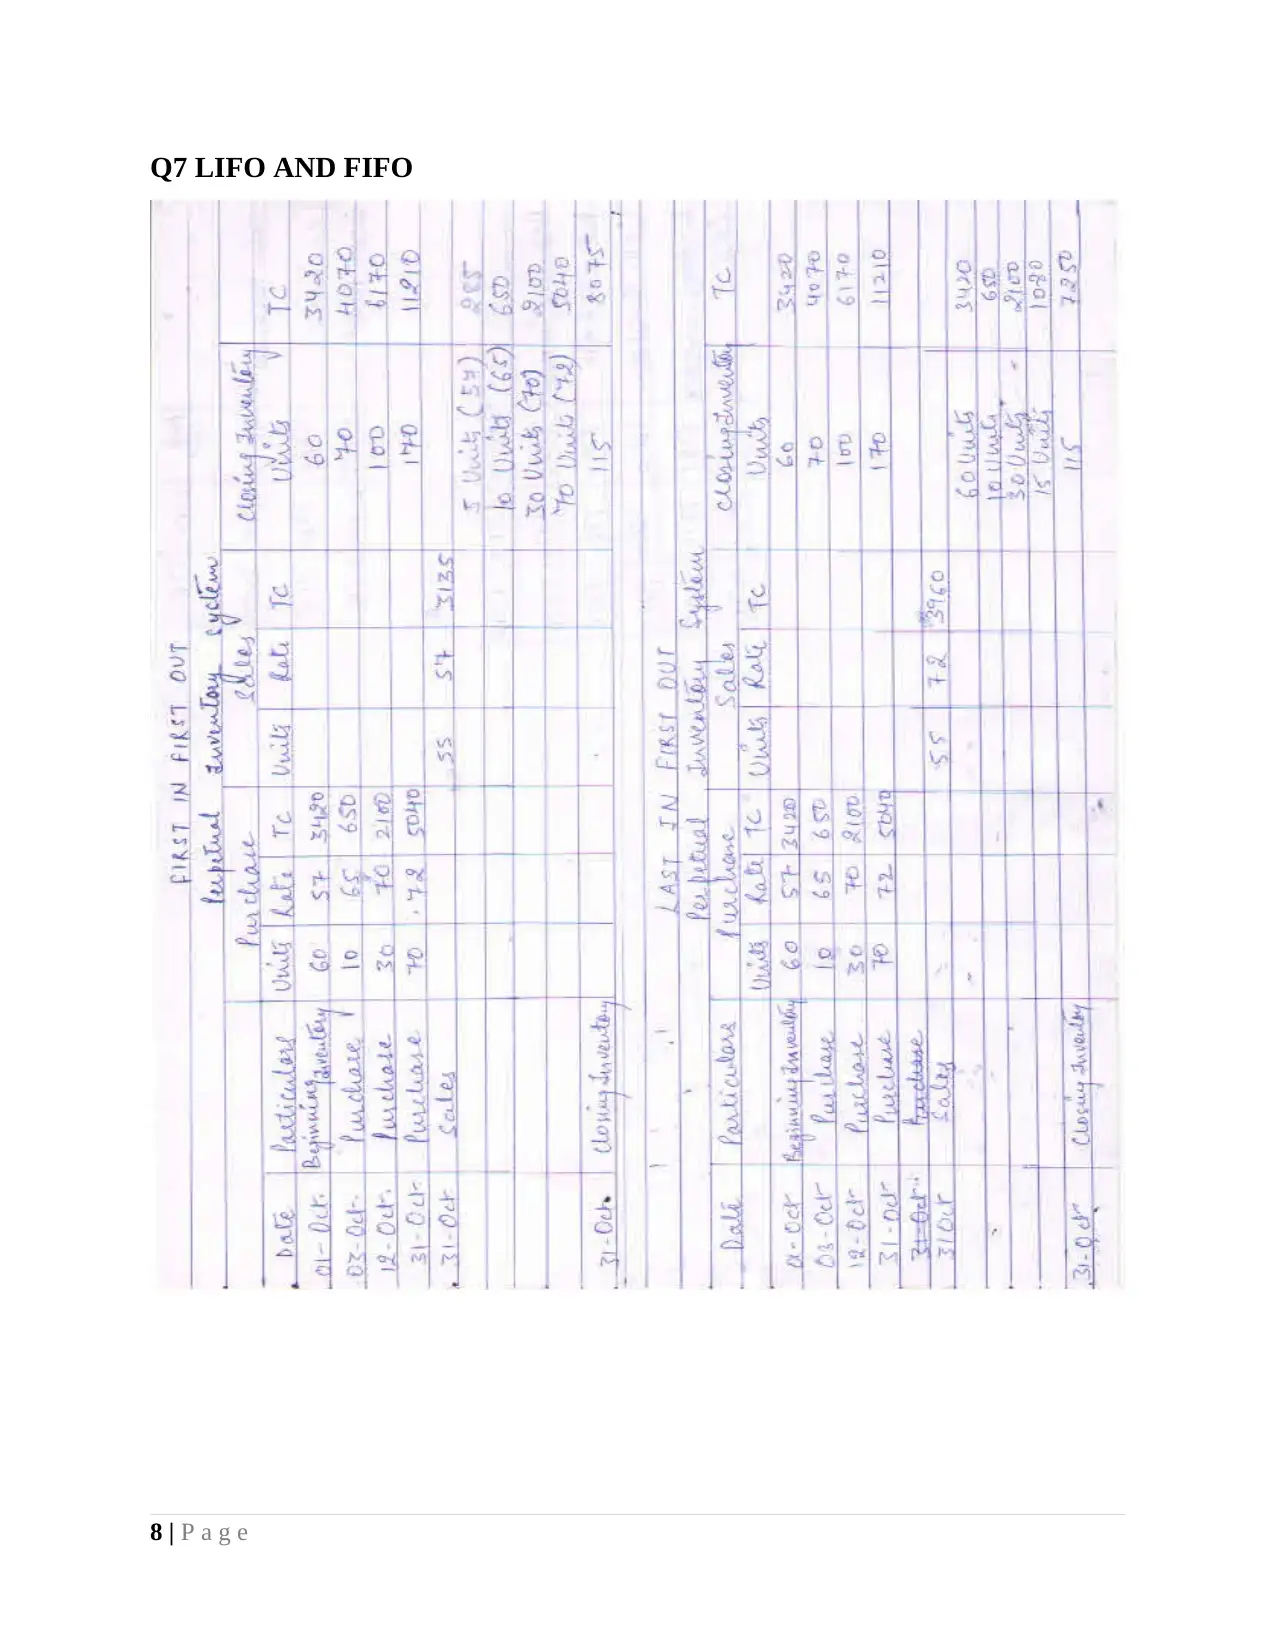
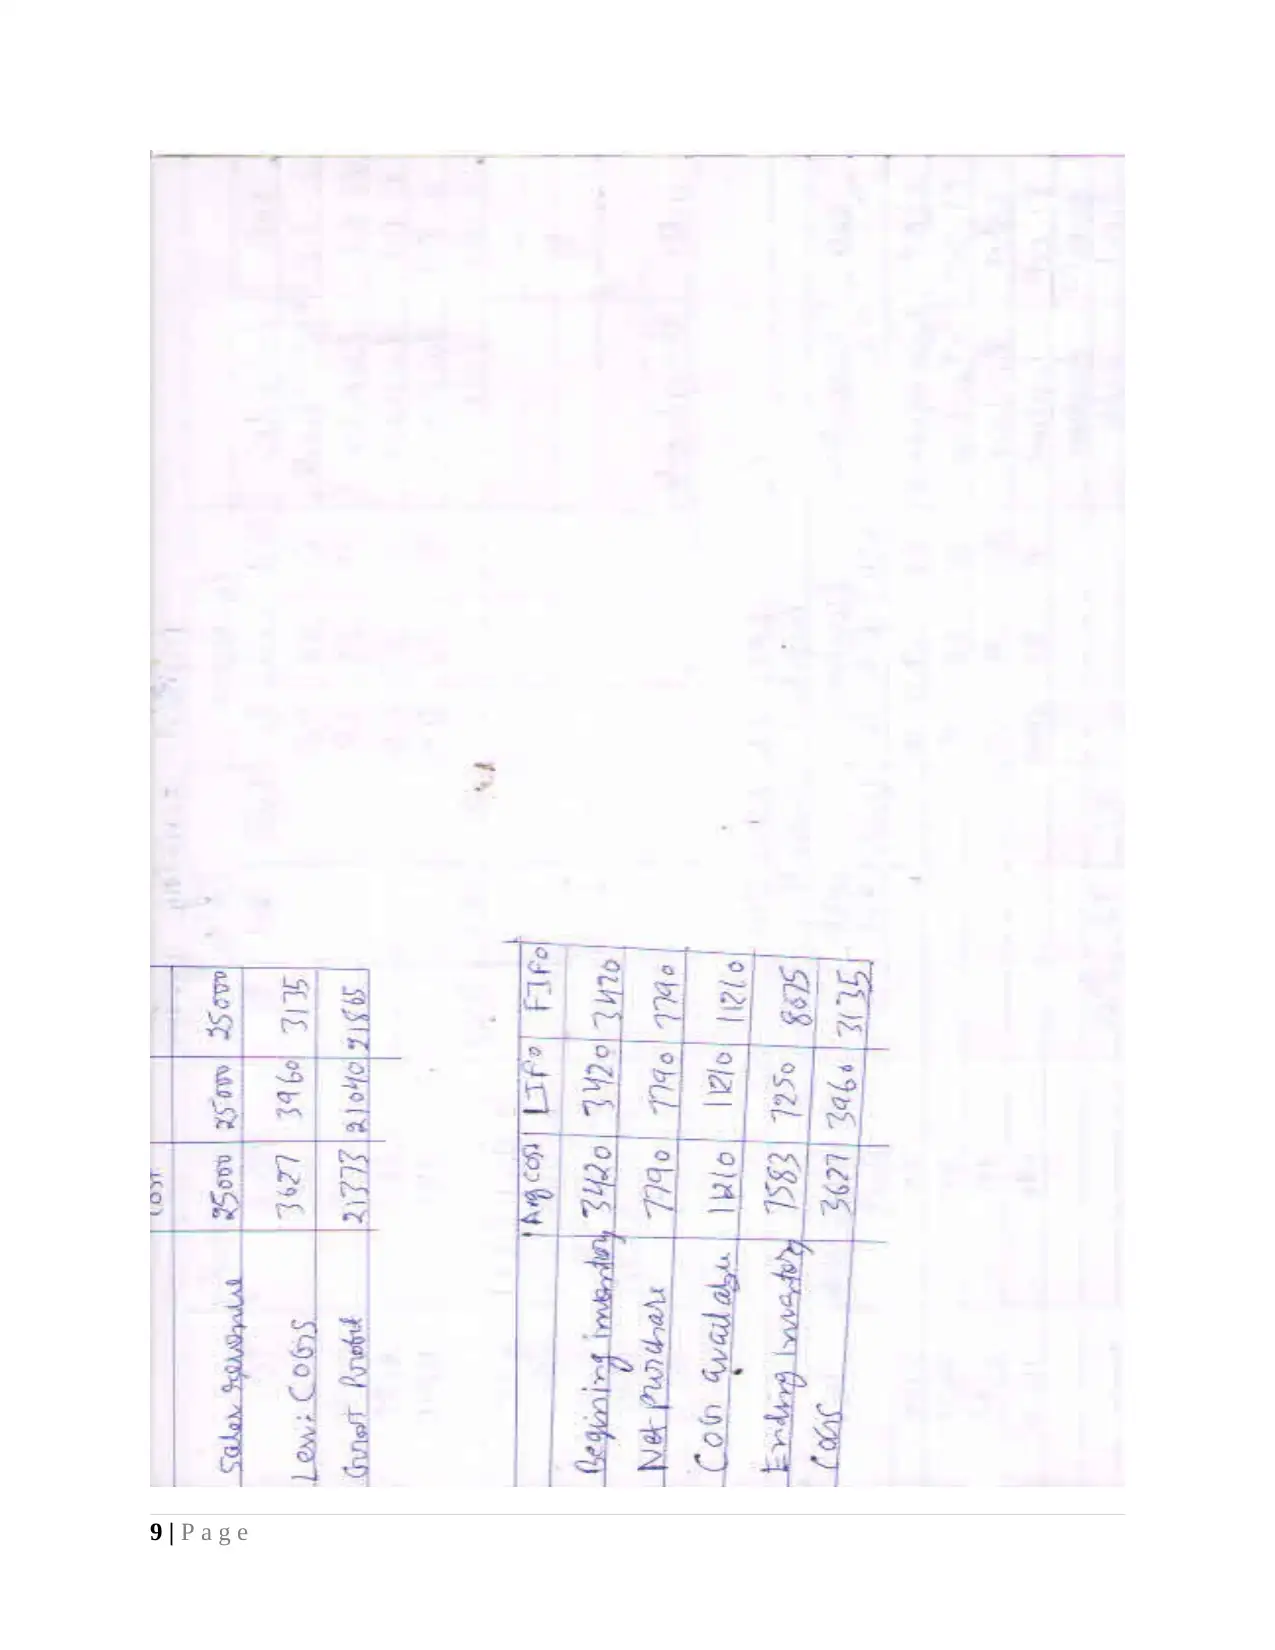
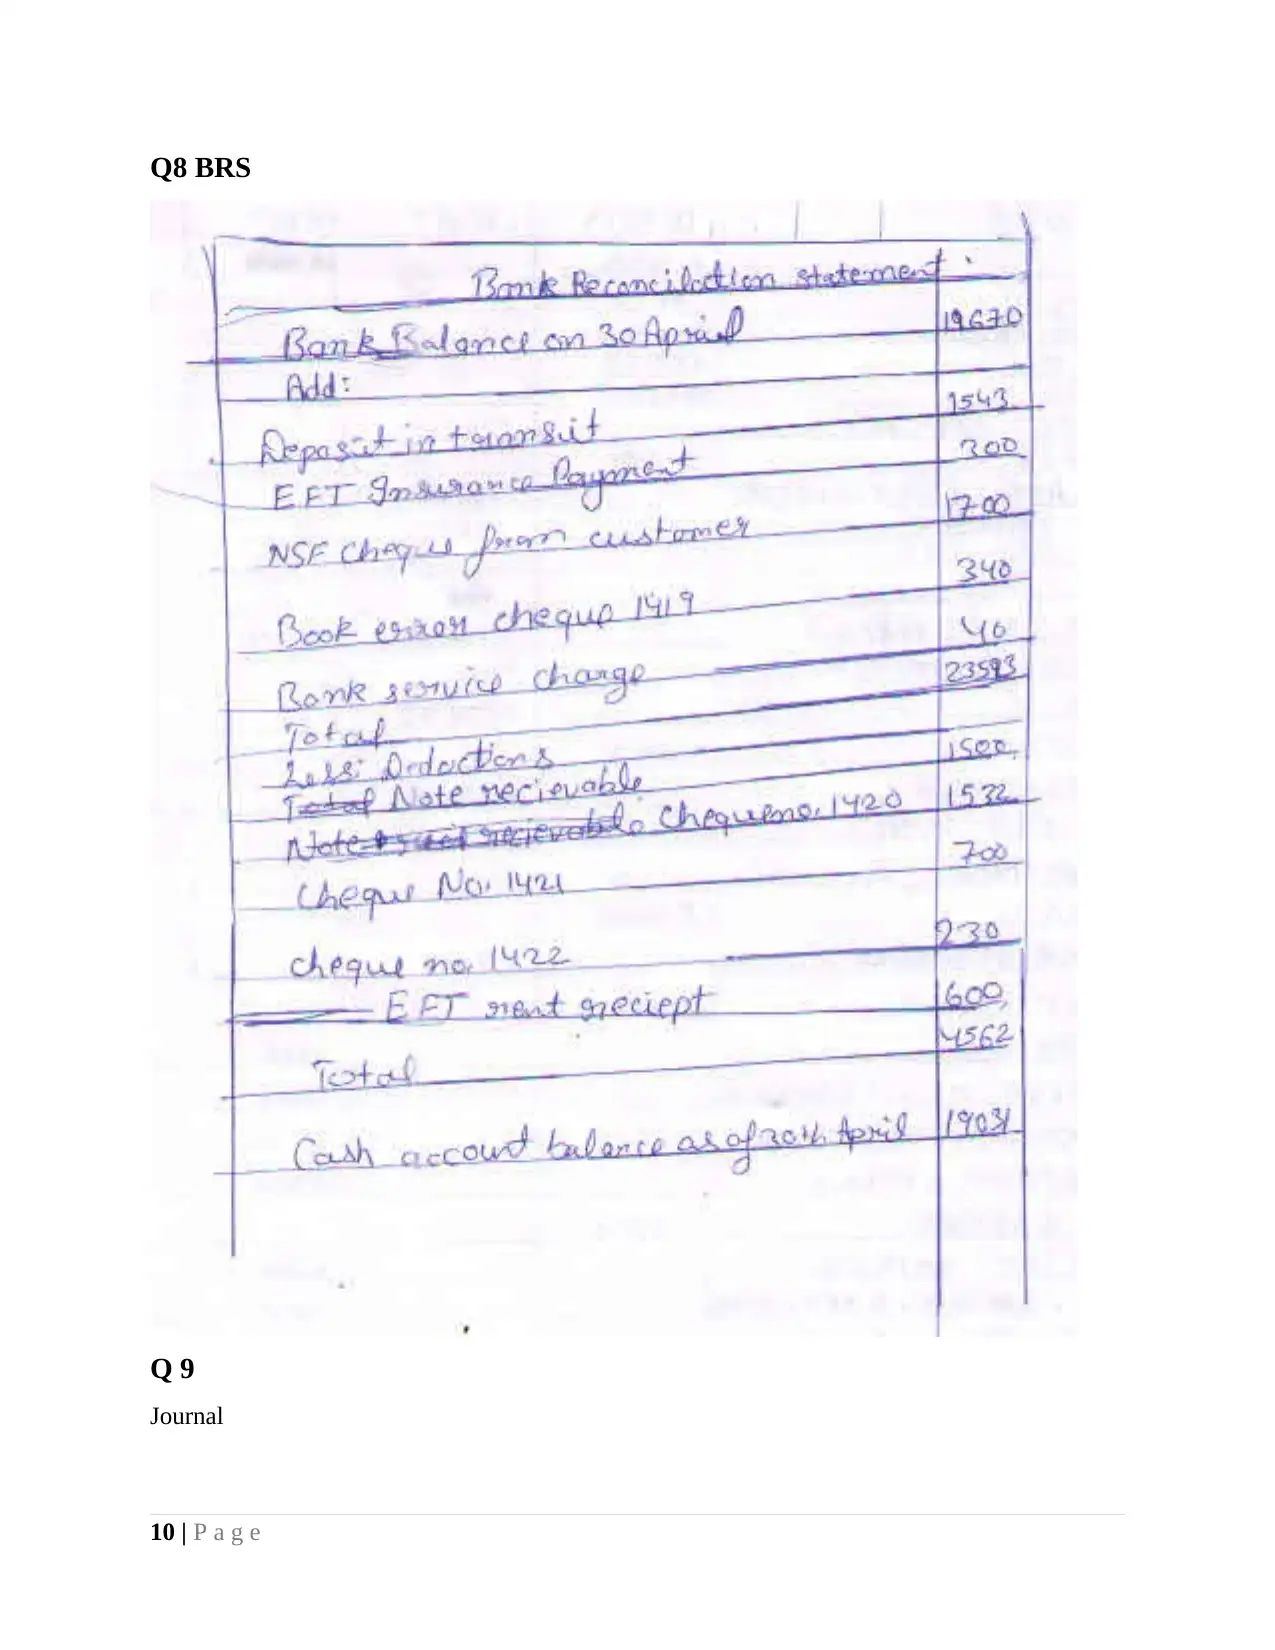
This report delves into the application of advanced Excel functions within accounting systems and processes. It examines the naming of cells and spreadsheets, the use of negative numbers, and the separation of data entry and report areas. The report explores the IF statement, periodic inventory systems, and the creation of financial reports. It further investigates LIFO and FIFO methods, Bank Reconciliation Statements (BRS), and journal entries. Methods for estimating bad debts, including percentage of sales and receivable methods, are analyzed. The report also evaluates a firm's financial position through ratio analysis and provides a case study involving a bill of exchange. Finally, the report offers an analysis of Wesfarmers, including its income statement, balance sheet, risks, and ratio analysis, concluding with an investment recommendation. The report uses multiple references to support the analysis.

ACC SYSTEMS AND PROCESSES
Paraphrase This Document
Need a fresh take? Get an instant paraphrase of this document with our AI Paraphraser

TABLE OF CONTENTS
INTRODUCTION...........................................................................................................................1
Q1 Naming cells and spreadsheets..............................................................................................1
Q2 Negative numbers..................................................................................................................2
Q3 Separation of data entry and report areas...............................................................................2
Q4 IF Statement...........................................................................................................................4
Q5 Periodic systems....................................................................................................................4
Q6 Worksheet and financial reports............................................................................................6
Q7 LIFO AND FIFO.......................................................................................................................8
Q8 BRS..........................................................................................................................................10
Q 9.................................................................................................................................................10
Q10 Methods of estimating bad debts.......................................................................................11
Q11 Evaluaitng firm financial position.....................................................................................12
Q 12...............................................................................................................................................12
Q13................................................................................................................................................13
Business which are part of Wesfarmers.....................................................................................13
Summary to Vikram on investment decisions...........................................................................14
CONCLUSION..............................................................................................................................14
REFERENCES..............................................................................................................................15

INTRODUCTION
Accounting is one of field which is growing at fast rate across the globe. In the current
report advanced functions of excel are applied on data set and on that basis it is identified
whether trial balance is accurate or not. Apart from this, analysis of Wesfarmers is done in the
report and on that basis investment recommendation is given in the report.
Q1 Naming cells and spreadsheets
Naming cells and spreadsheets is the one of the most important and valuable feature in
excel. Usually, when any formula is inserted in to excel sheet names such as C3, C10 and D40
like are observed in formula (Ball, 2013). Those who developed a model in excel very well
familiar with variables but those who first time view that model can not understand it in single
view. In order to sort out this problem ceels are named so that anyone can easily understand
model.
It can be seen from above image that instead of cell names liability and owners equity are in the
formula. This is the example of naming cells and spreadsheet.
1 | P a g e
⊘ This is a preview!⊘
Do you want full access?
Subscribe today to unlock all pages.

Trusted by 1+ million students worldwide

Q2 Negative numbers
Negative numbers can be displayed in brackets or parenthesis in excel. In excel version
2013 simply one can go to data format dialog box in home tab and can select brackets in
accounting option. By doing so negative numbers can be shown in brackets in excel. Brackets
are usually used in excel to reflect negative numbers because in report when any data is printed it
is not possible to pay clear attention on all negative values. Thus, in order to solve this problem
bracket is shown in excel.
Q3 Separation of data entry and report areas
In modelling that is done in excel simply data entry and report areas are prepared
separately. This is because in data entry part all modeling inputs are mentioned and if required
interrelationship is establsihed among them (Banerjee, 2010). Inputs that are in the data entry
areas are used in modeling process and same are considered for computing values in report area.
It can be said that there is significence of separation of data entry and report area because both
give different sort of information to the users of finanaicial model.
Input sheet
inventory cost % 10%
Sales revenue
10000
0
inventory cost 10000
expenses % 60%
Profit 50000
Output area
change in % of inventory cost
change
in % of
expense
s 50000.00 50% 60% 70% 80%
10% 60000 50000 40000 30000
20% 70000 60000 50000 40000
30% 80000 70000 60000 50000
40% 90000 80000 70000 60000
2 | P a g e
Paraphrase This Document
Need a fresh take? Get an instant paraphrase of this document with our AI Paraphraser

From above table it can be observed that in input sheet there is a model which is prepared and
under this profit amount is computed. In the report at different level of inventory percentage and
expenses percentage profit amount is computed (Bodie, 2013). In output area using data table
prediction reporting of profit at different percentage of inventory and expenses is computed.
3 | P a g e
under this profit amount is computed. In the report at different level of inventory percentage and
expenses percentage profit amount is computed (Bodie, 2013). In output area using data table
prediction reporting of profit at different percentage of inventory and expenses is computed.
3 | P a g e

Q4 IF Statement
Illustration 1: Formula view of IF statement
IF statement is applied in above case and it can be observed that total of both debit and credit
sides are equal to each other. This is verified by using IF statement where condition was placed
and it was instructed to Excel that if condition prove correct then answer must be 1 otherwise it
must be 2. Outcome was 1 which reflect that both sides of trial balance tally.
Q5 Periodic systems
Periodic inventory system refers to accountig method under which amount of inventory
that will be at end of acounting year in specific time period is determined. Under periodic
inventory system physical count of each item of inventory is determined (Jones, 2011). It can be
said that periodic system help firm in managing its inventory in better manner. Example of
periodic inventory system is given below.
4 | P a g e
⊘ This is a preview!⊘
Do you want full access?
Subscribe today to unlock all pages.

Trusted by 1+ million students worldwide

Inventory balance in February 2017: $500,000
Purchases on March 2017: $2,400,00
Inventory balance on January 31 2017: $300,000
Cost of goods sold (COGS) = Beginning inventory + Purchases – Closing inventory
= $500,000 + $2,400,000 – $300,000
= $4,40,000
5 | P a g e
Purchases on March 2017: $2,400,00
Inventory balance on January 31 2017: $300,000
Cost of goods sold (COGS) = Beginning inventory + Purchases – Closing inventory
= $500,000 + $2,400,000 – $300,000
= $4,40,000
5 | P a g e
Paraphrase This Document
Need a fresh take? Get an instant paraphrase of this document with our AI Paraphraser

Q6 Worksheet and financial reports
6 | P a g e
6 | P a g e

7 | P a g e
⊘ This is a preview!⊘
Do you want full access?
Subscribe today to unlock all pages.

Trusted by 1+ million students worldwide

Q7 LIFO AND FIFO
8 | P a g e
8 | P a g e
Paraphrase This Document
Need a fresh take? Get an instant paraphrase of this document with our AI Paraphraser

9 | P a g e

Q8 BRS
Q 9
Journal
10 | P a g e
Q 9
Journal
10 | P a g e
⊘ This is a preview!⊘
Do you want full access?
Subscribe today to unlock all pages.

Trusted by 1+ million students worldwide
1 out of 18
Related Documents
Your All-in-One AI-Powered Toolkit for Academic Success.
+13062052269
info@desklib.com
Available 24*7 on WhatsApp / Email
Unlock your academic potential
Copyright © 2020–2026 A2Z Services. All Rights Reserved. Developed and managed by ZUCOL.


