ACC00152 Business Finance: Evaluating SSF's Product Launch Options

Verified

Added on  2023/04/25

|9
|1304
|252
Report
AI Summary
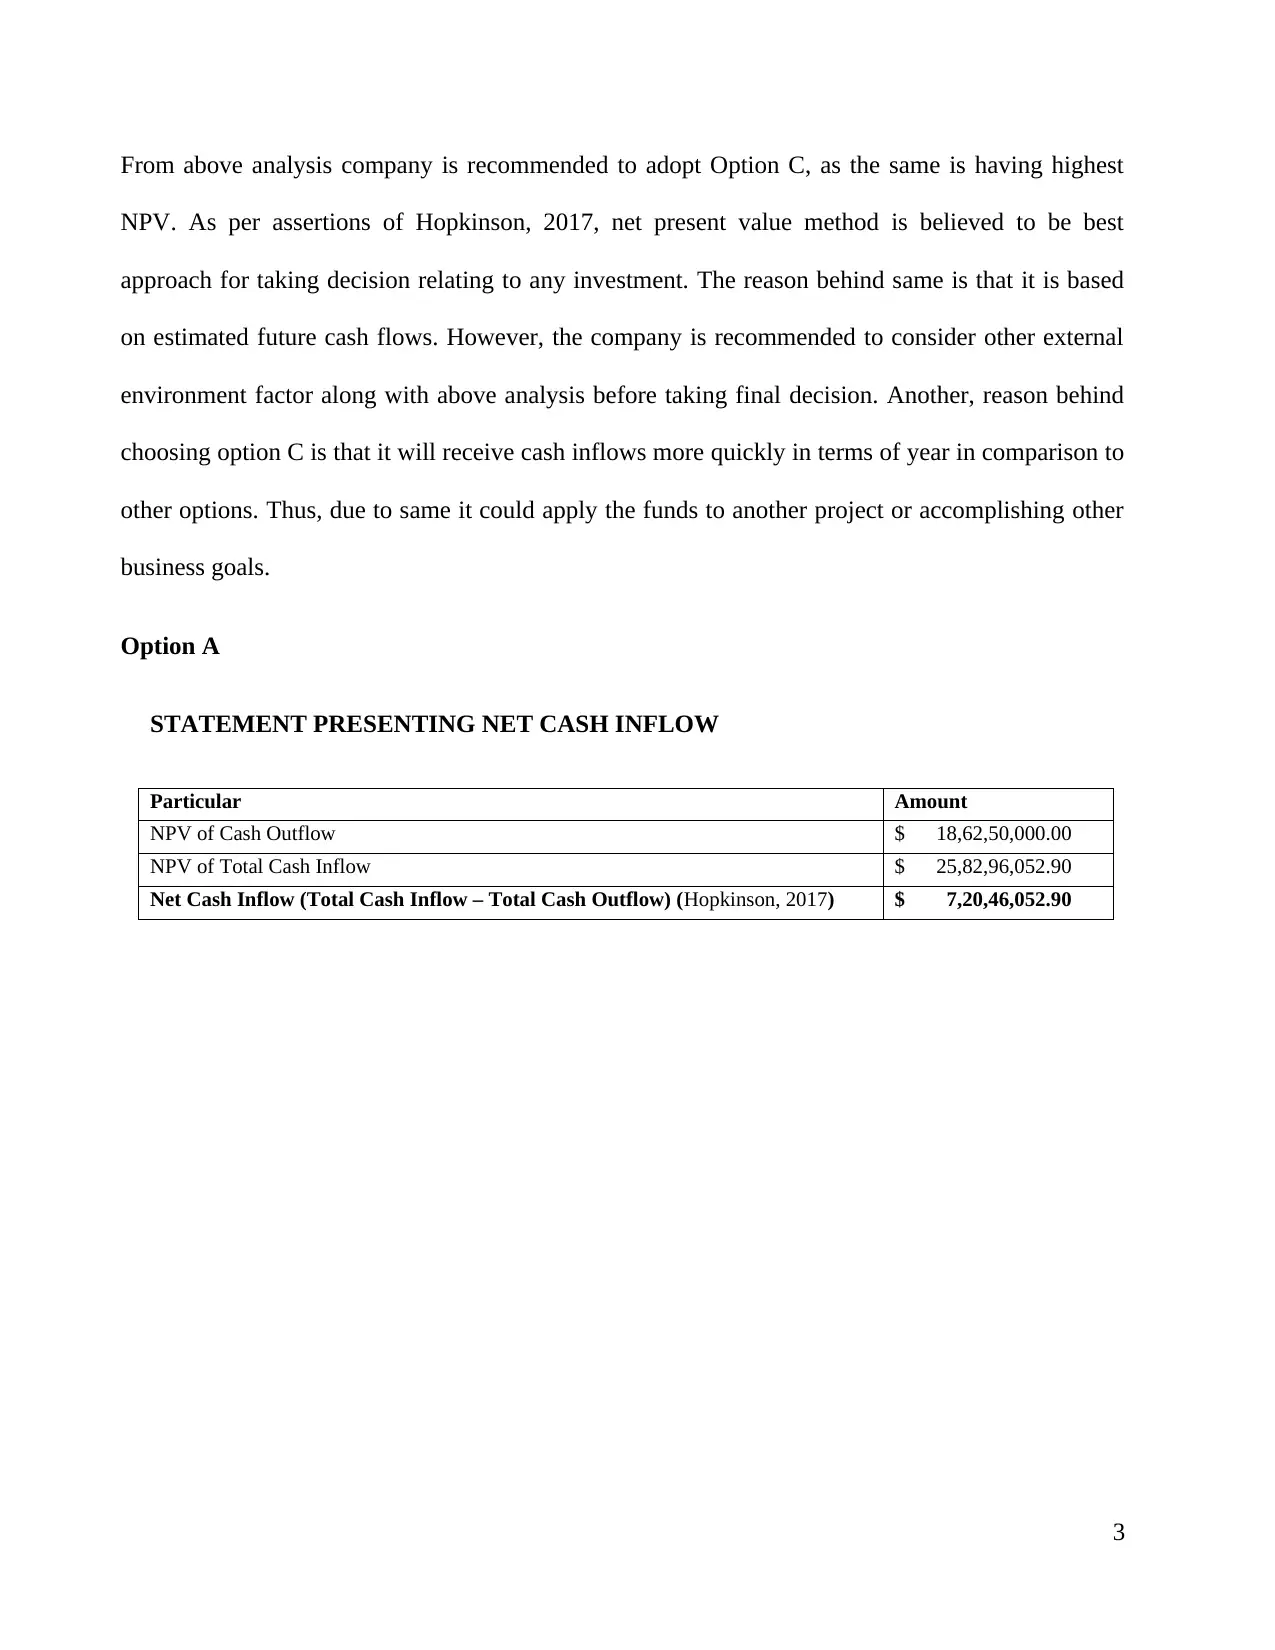
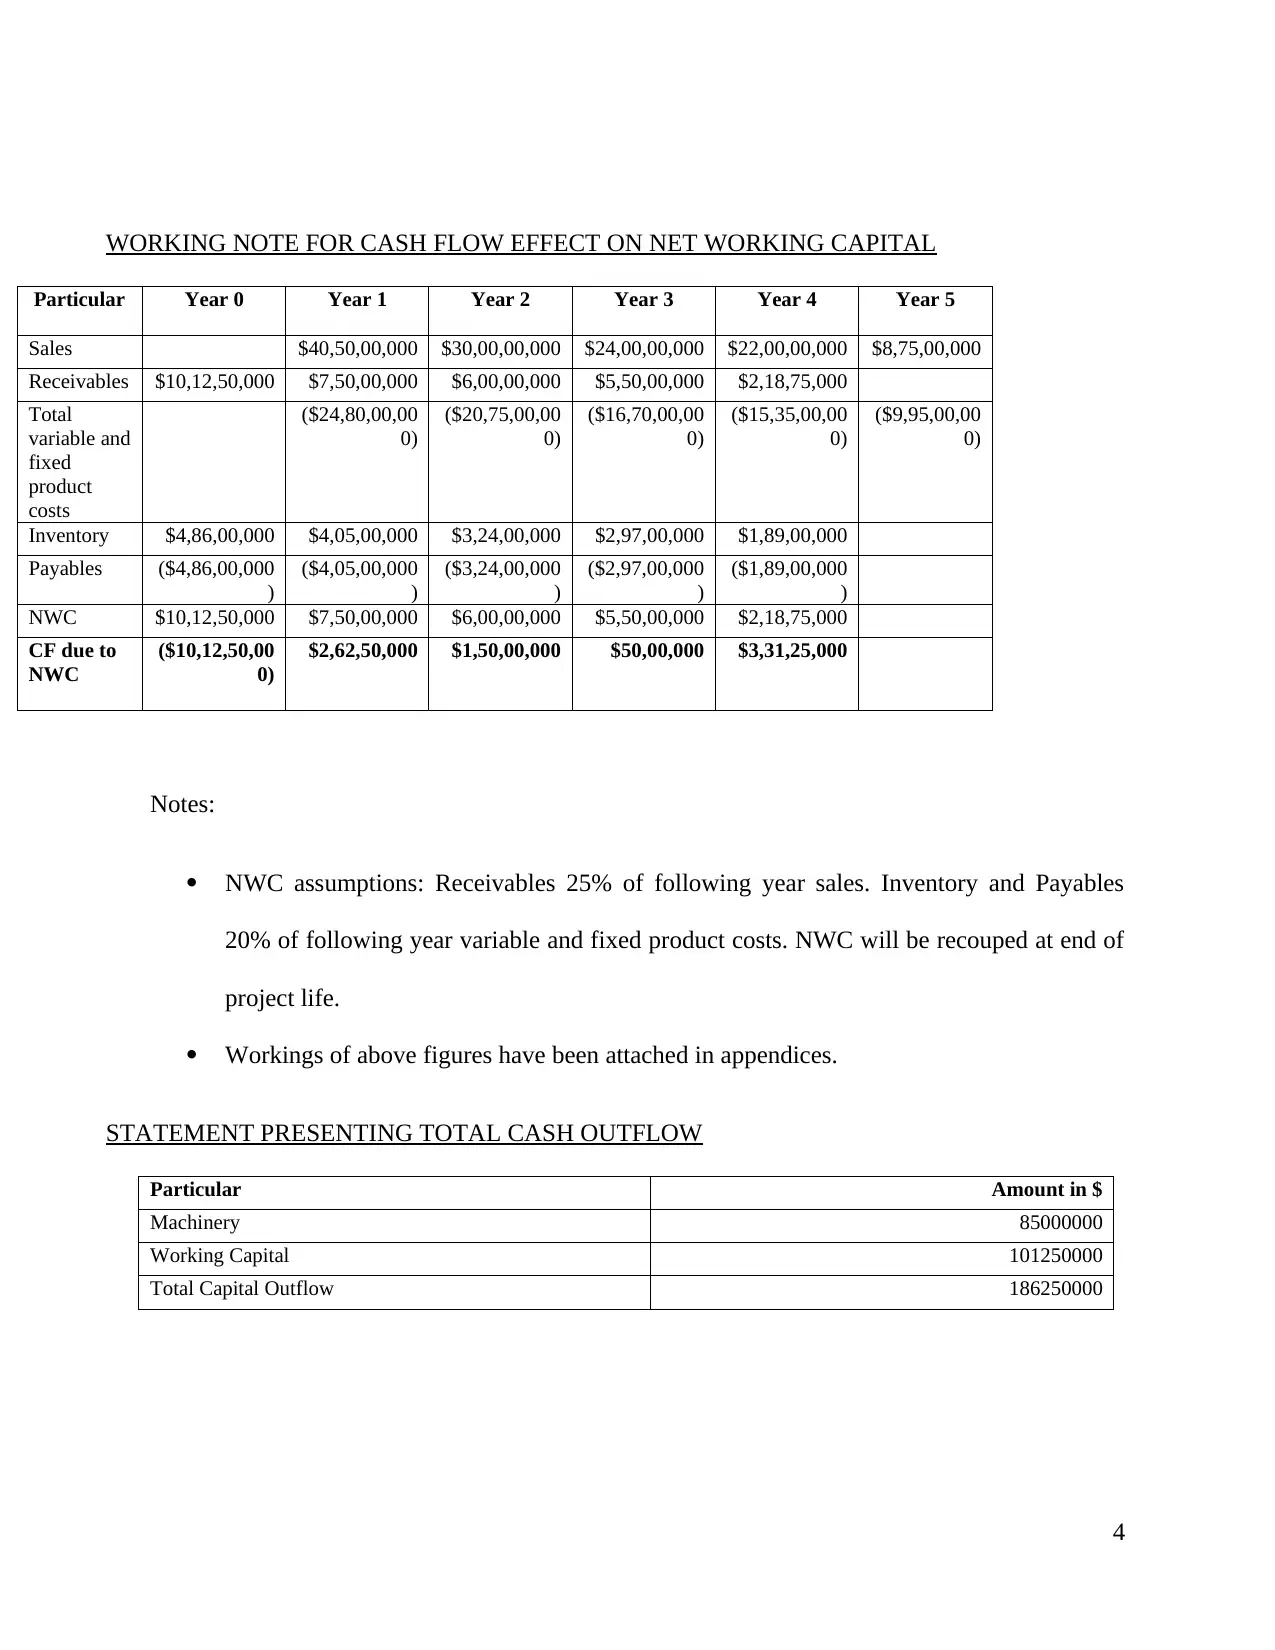
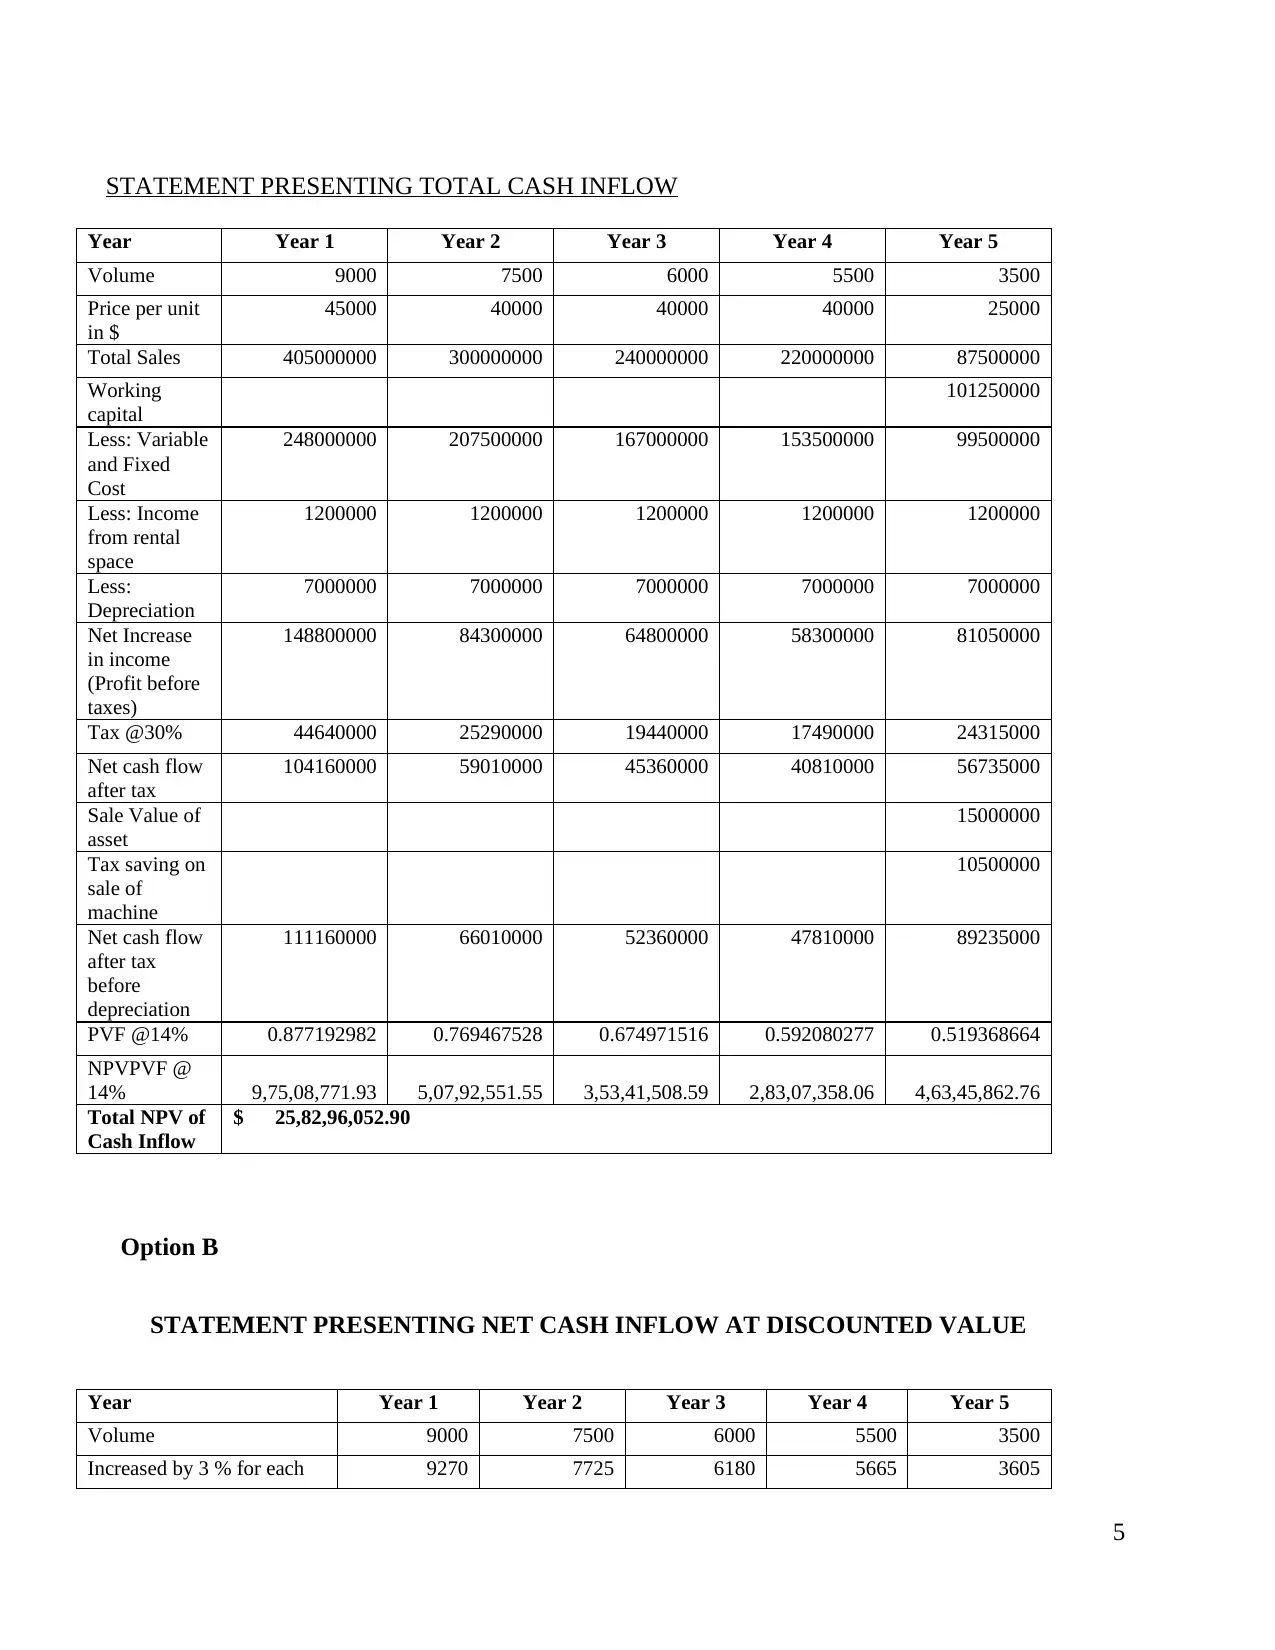
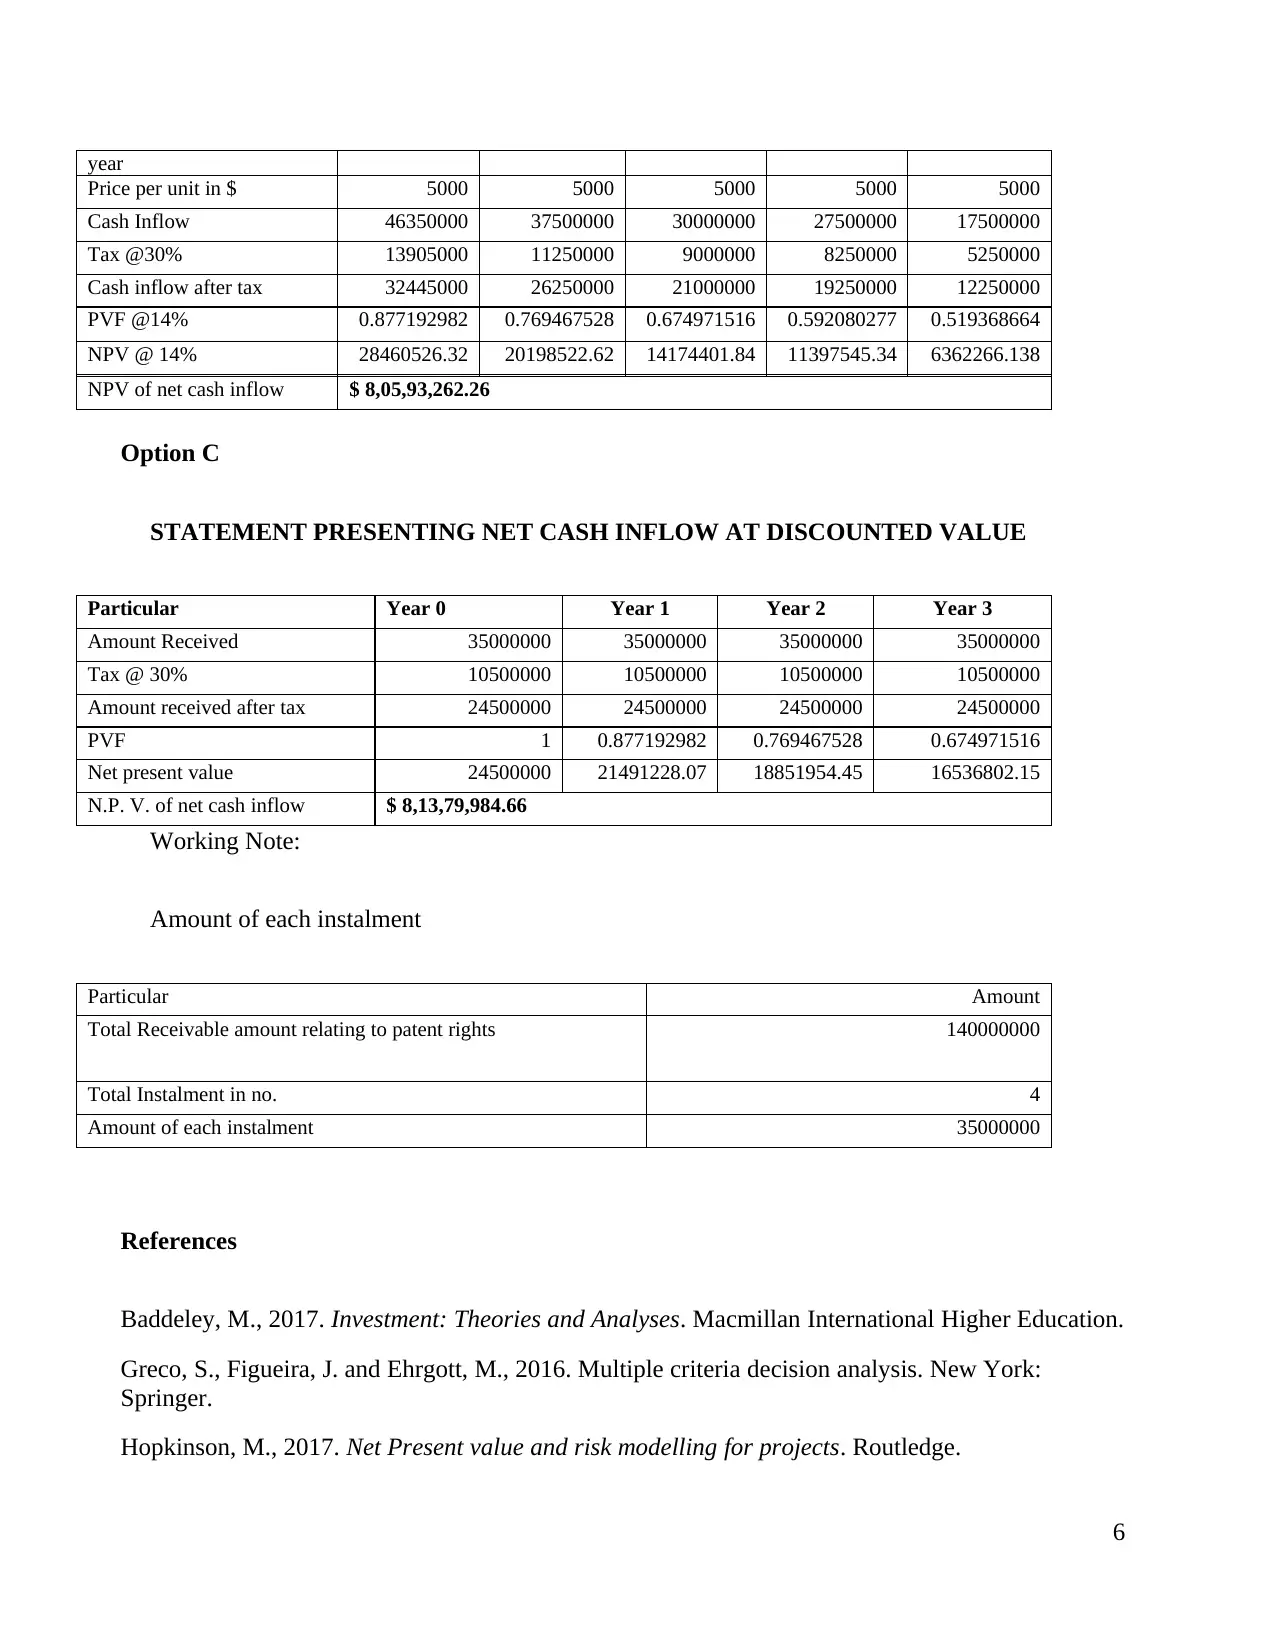
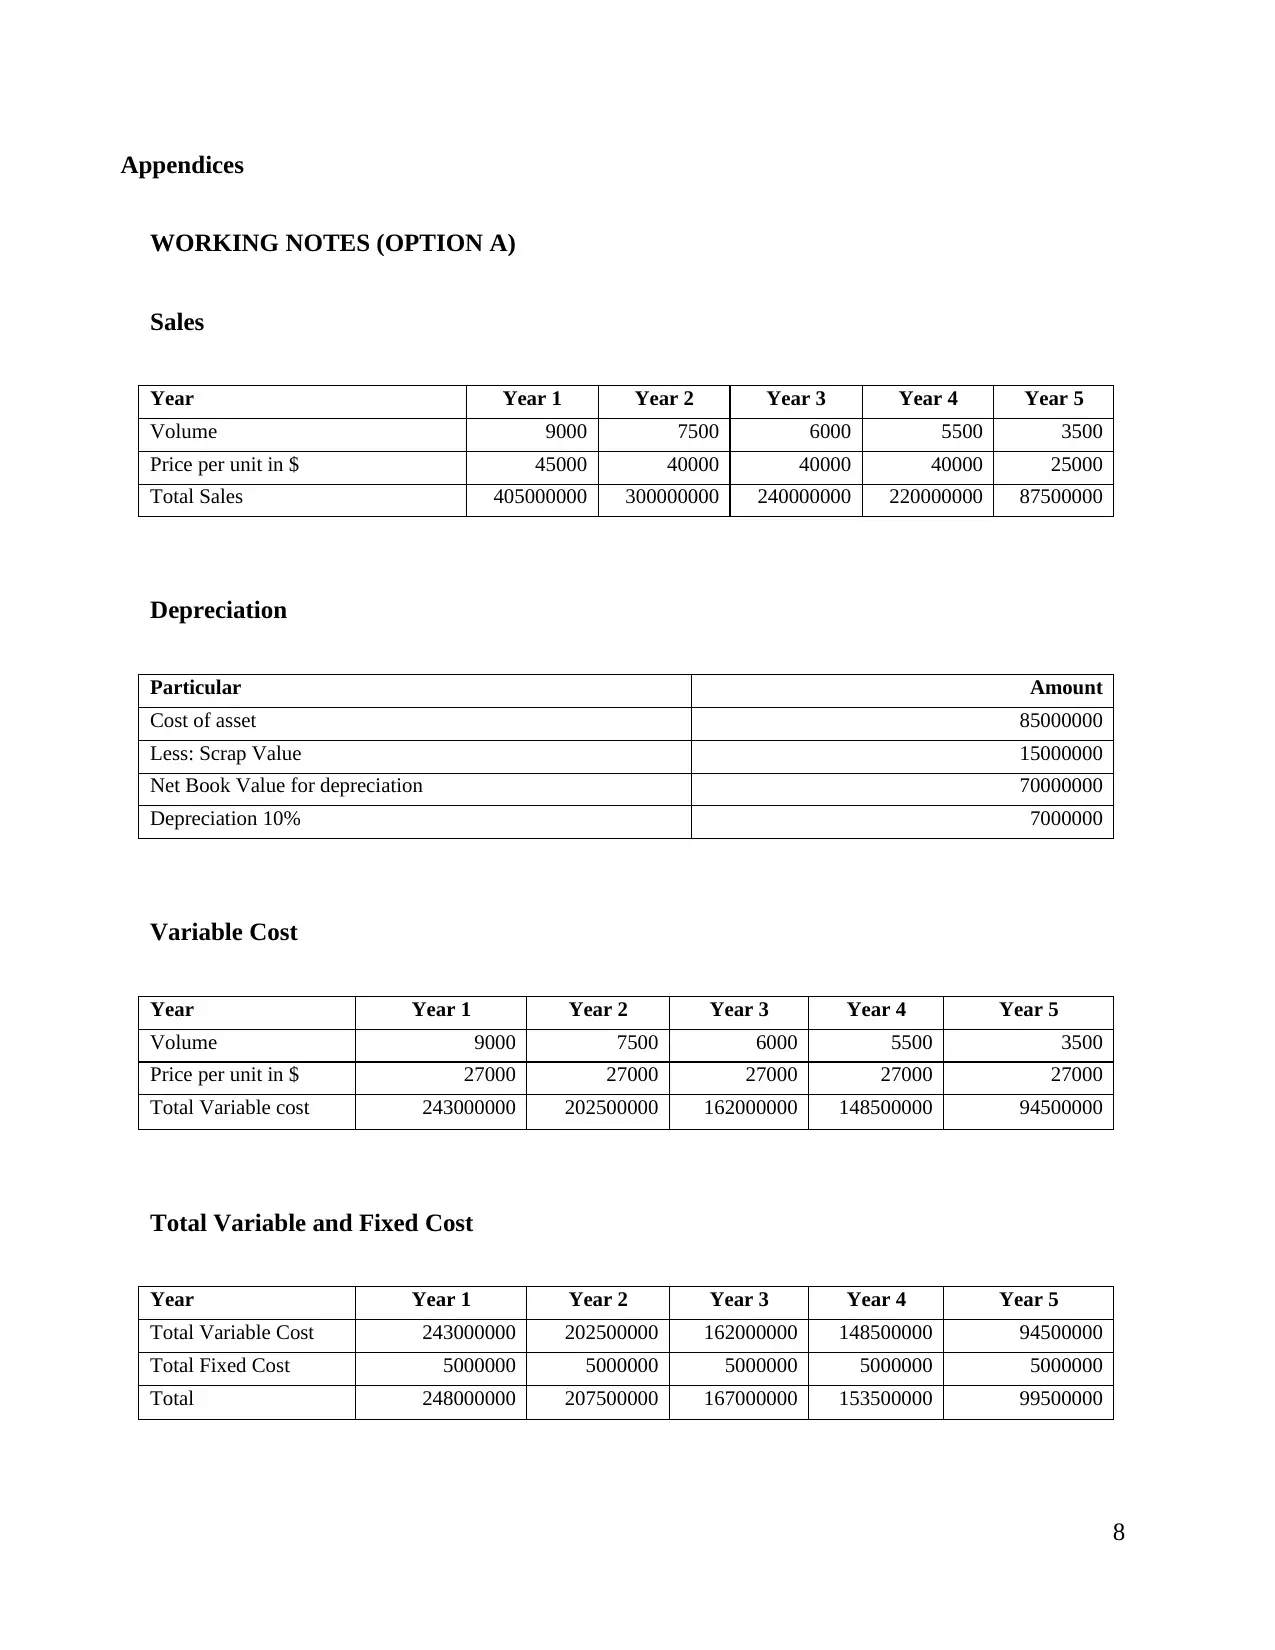
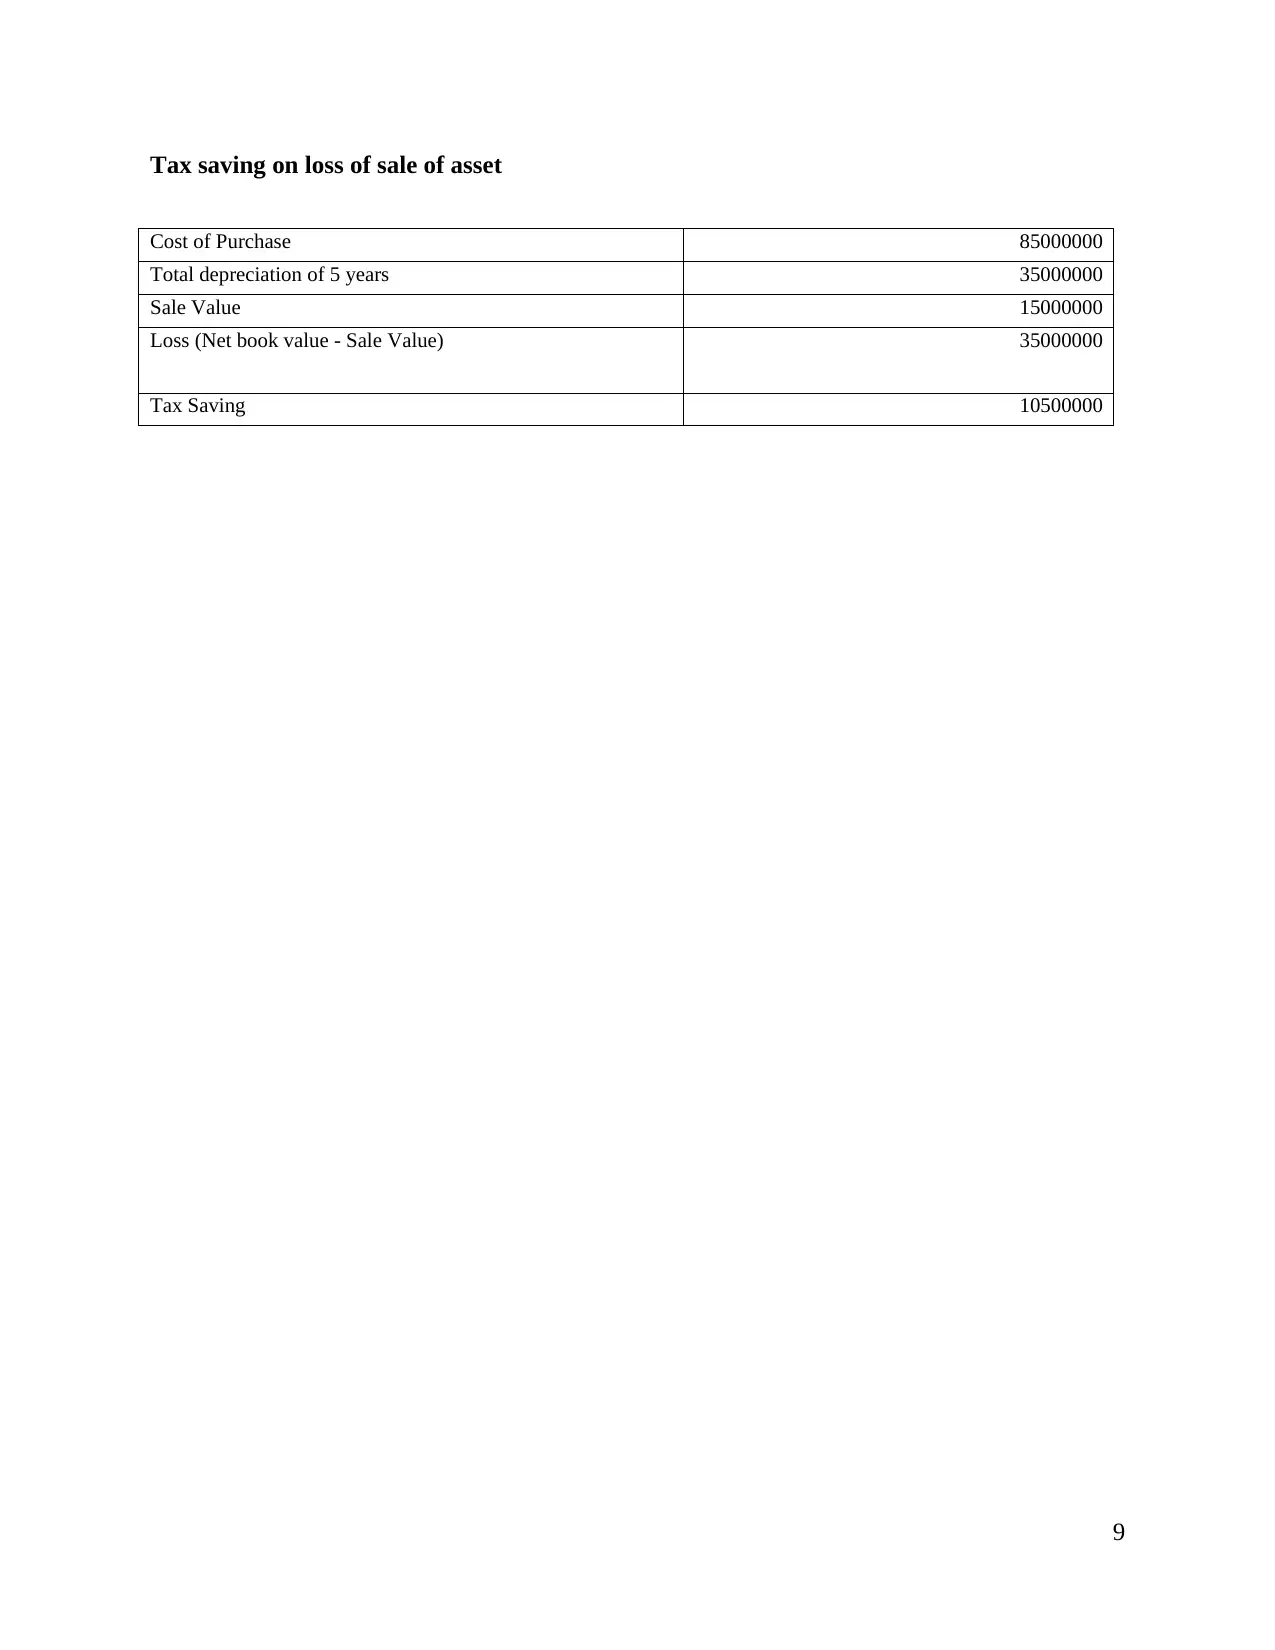
This report provides a critical evaluation and analysis of three options available to Space Sky Flight Ltd for launching their product. The analysis utilizes the Net Present Value (NPV) method to determine the most suitable option. Option A involves in-house manufacturing and direct sales, requiring significant initial cash outflow but potentially yielding higher profits and brand control. Option B considers licensing the product for royalties, emphasizing the importance of licensing agreement terms. Option C focuses on selling the patent rights, highlighting the potential for quick cash inflows but also the complexities of patenting. The report recommends Option C based on its highest NPV, while also advising the company to consider external environmental factors. Detailed financial statements and working notes are included for each option, outlining cash flows, sales projections, cost analysis, and NPV calculations. The appendices provide further details on sales, depreciation, variable costs, and tax savings. Desklib provides students with access to similar solved assignments and past papers.
Document Page
Financial Management
1
tabler-icon-diamond-filled.svg

Paraphrase This Document

Need a fresh take? Get an instant paraphrase of this document with our AI Paraphraser
Document Page
To,
Respected Sir
Space Sky Flight Ltd.
The present study is based on the critical evaluation and analysis of three options available to the
company for selecting one of three options that is the most suitable for the Space Sky Flight Ltd to
launch their product in the market. Morden, (2016) asserts that NPV is the central tool for using
time value of money in order to appraise long-term project. The specified method is applied to
analyze the profitability of any project and to assess the best option. Option A, is the most common
method which every company chooses to sell its product, the option of manufacturing in house and
selling the product directly into the market can be a strong way to gain more profits while
strengthening and controlling the brand effectively. It has been ascertained while assessing this
option that adequate initial cash out flow is require to implement option A. Further, option B i.e.
getting the product licensed and earn a royalty of $ per unit. The main key factor which are required
before accepting the above proposal are: the agreement of licensing involves the time frame deal
including, renewal, termination and all such contracts (Greco, Figueira, and Ehrgott, 2016). The last
option i.e. Option C is to sell the patent rights of the product. Initially the patent protection is filed.
Along with this, licensing another party also covers maintenance of copyrights, patents, or
trademarks. Patenting a product can result in a lengthy and costly process for the company and is
based primarily on the product’s complexity (Lewellen and Lewellen, 2016).
Recommendation:
2
Document Page
From above analysis company is recommended to adopt Option C, as the same is having highest
NPV. As per assertions of Hopkinson, 2017, net present value method is believed to be best
approach for taking decision relating to any investment. The reason behind same is that it is based
on estimated future cash flows. However, the company is recommended to consider other external
environment factor along with above analysis before taking final decision. Another, reason behind
choosing option C is that it will receive cash inflows more quickly in terms of year in comparison to
other options. Thus, due to same it could apply the funds to another project or accomplishing other
business goals.
Option A
STATEMENT PRESENTING NET CASH INFLOW
Particular Amount
NPV of Cash Outflow $ 18,62,50,000.00
NPV of Total Cash Inflow $ 25,82,96,052.90
Net Cash Inflow (Total Cash Inflow – Total Cash Outflow) (Hopkinson, 2017) $ 7,20,46,052.90
3
Document Page
WORKING NOTE FOR CASH FLOW EFFECT ON NET WORKING CAPITAL
Particular Year 0 Year 1 Year 2 Year 3 Year 4 Year 5
Sales $40,50,00,000 $30,00,00,000 $24,00,00,000 $22,00,00,000 $8,75,00,000
Receivables $10,12,50,000 $7,50,00,000 $6,00,00,000 $5,50,00,000 $2,18,75,000
Total
variable and
fixed
product
costs
($24,80,00,00
0)
($20,75,00,00
0)
($16,70,00,00
0)
($15,35,00,00
0)
($9,95,00,00
0)
Inventory $4,86,00,000 $4,05,00,000 $3,24,00,000 $2,97,00,000 $1,89,00,000
Payables ($4,86,00,000
)
($4,05,00,000
)
($3,24,00,000
)
($2,97,00,000
)
($1,89,00,000
)
NWC $10,12,50,000 $7,50,00,000 $6,00,00,000 $5,50,00,000 $2,18,75,000
CF due to
NWC
($10,12,50,00
0)
$2,62,50,000 $1,50,00,000 $50,00,000 $3,31,25,000
Notes:
ï‚· NWC assumptions: Receivables 25% of following year sales. Inventory and Payables
20% of following year variable and fixed product costs. NWC will be recouped at end of
project life.
ï‚· Workings of above figures have been attached in appendices.
STATEMENT PRESENTING TOTAL CASH OUTFLOW
Particular Amount in $
Machinery 85000000
Working Capital 101250000
Total Capital Outflow 186250000
4
tabler-icon-diamond-filled.svg

Paraphrase This Document

Need a fresh take? Get an instant paraphrase of this document with our AI Paraphraser
Document Page
STATEMENT PRESENTING TOTAL CASH INFLOW
Year Year 1 Year 2 Year 3 Year 4 Year 5
Volume 9000 7500 6000 5500 3500
Price per unit
in $
45000 40000 40000 40000 25000
Total Sales 405000000 300000000 240000000 220000000 87500000
Working
capital
101250000
Less: Variable
and Fixed
Cost
248000000 207500000 167000000 153500000 99500000
Less: Income
from rental
space
1200000 1200000 1200000 1200000 1200000
Less:
Depreciation
7000000 7000000 7000000 7000000 7000000
Net Increase
in income
(Profit before
taxes)
148800000 84300000 64800000 58300000 81050000
Tax @30% 44640000 25290000 19440000 17490000 24315000
Net cash flow
after tax
104160000 59010000 45360000 40810000 56735000
Sale Value of
asset
15000000
Tax saving on
sale of
machine
10500000
Net cash flow
after tax
before
depreciation
111160000 66010000 52360000 47810000 89235000
PVF @14% 0.877192982 0.769467528 0.674971516 0.592080277 0.519368664
NPVPVF @
14% 9,75,08,771.93 5,07,92,551.55 3,53,41,508.59 2,83,07,358.06 4,63,45,862.76
Total NPV of
Cash Inflow
$ 25,82,96,052.90
Option B
STATEMENT PRESENTING NET CASH INFLOW AT DISCOUNTED VALUE
Year Year 1 Year 2 Year 3 Year 4 Year 5
Volume 9000 7500 6000 5500 3500
Increased by 3 % for each 9270 7725 6180 5665 3605
5
Document Page
year
Price per unit in $ 5000 5000 5000 5000 5000
Cash Inflow 46350000 37500000 30000000 27500000 17500000
Tax @30% 13905000 11250000 9000000 8250000 5250000
Cash inflow after tax 32445000 26250000 21000000 19250000 12250000
PVF @14% 0.877192982 0.769467528 0.674971516 0.592080277 0.519368664
NPV @ 14% 28460526.32 20198522.62 14174401.84 11397545.34 6362266.138
NPV of net cash inflow $ 8,05,93,262.26
Option C
STATEMENT PRESENTING NET CASH INFLOW AT DISCOUNTED VALUE
Particular Year 0 Year 1 Year 2 Year 3
Amount Received 35000000 35000000 35000000 35000000
Tax @ 30% 10500000 10500000 10500000 10500000
Amount received after tax 24500000 24500000 24500000 24500000
PVF 1 0.877192982 0.769467528 0.674971516
Net present value 24500000 21491228.07 18851954.45 16536802.15
N.P. V. of net cash inflow $ 8,13,79,984.66
Working Note:
Amount of each instalment
Particular Amount
Total Receivable amount relating to patent rights 140000000
Total Instalment in no. 4
Amount of each instalment 35000000
References
Baddeley, M., 2017. Investment: Theories and Analyses. Macmillan International Higher Education.
Greco, S., Figueira, J. and Ehrgott, M., 2016. Multiple criteria decision analysis. New York:
Springer.
Hopkinson, M., 2017. Net Present value and risk modelling for projects. Routledge.
6
Document Page
Lewellen, J. and Lewellen, K., 2016. Investment and cash flow: New evidence. Journal of
Financial and Quantitative Analysis, 51(4), pp.1135-1164.
Morden, T., 2016. Principles of strategic management. Routledge.
7
tabler-icon-diamond-filled.svg

Paraphrase This Document

Need a fresh take? Get an instant paraphrase of this document with our AI Paraphraser
Document Page
Appendices
WORKING NOTES (OPTION A)
Sales
Year Year 1 Year 2 Year 3 Year 4 Year 5
Volume 9000 7500 6000 5500 3500
Price per unit in $ 45000 40000 40000 40000 25000
Total Sales 405000000 300000000 240000000 220000000 87500000
Depreciation
Particular Amount
Cost of asset 85000000
Less: Scrap Value 15000000
Net Book Value for depreciation 70000000
Depreciation 10% 7000000
Variable Cost
Year Year 1 Year 2 Year 3 Year 4 Year 5
Volume 9000 7500 6000 5500 3500
Price per unit in $ 27000 27000 27000 27000 27000
Total Variable cost 243000000 202500000 162000000 148500000 94500000
Total Variable and Fixed Cost
Year Year 1 Year 2 Year 3 Year 4 Year 5
Total Variable Cost 243000000 202500000 162000000 148500000 94500000
Total Fixed Cost 5000000 5000000 5000000 5000000 5000000
Total 248000000 207500000 167000000 153500000 99500000
8
Document Page
Tax saving on loss of sale of asset
Cost of Purchase 85000000
Total depreciation of 5 years 35000000
Sale Value 15000000
Loss (Net book value - Sale Value) 35000000
Tax Saving 10500000
9
chevron_up_icon
1 out of 9
circle_padding
hide_on_mobile
zoom_out_icon
[object Object]