ACC00724 S2 2018 - Cash Flow, Profitability Analysis: Managers

Verified

Added on  2023/06/09

|11
|1350
|317
Report
AI Summary
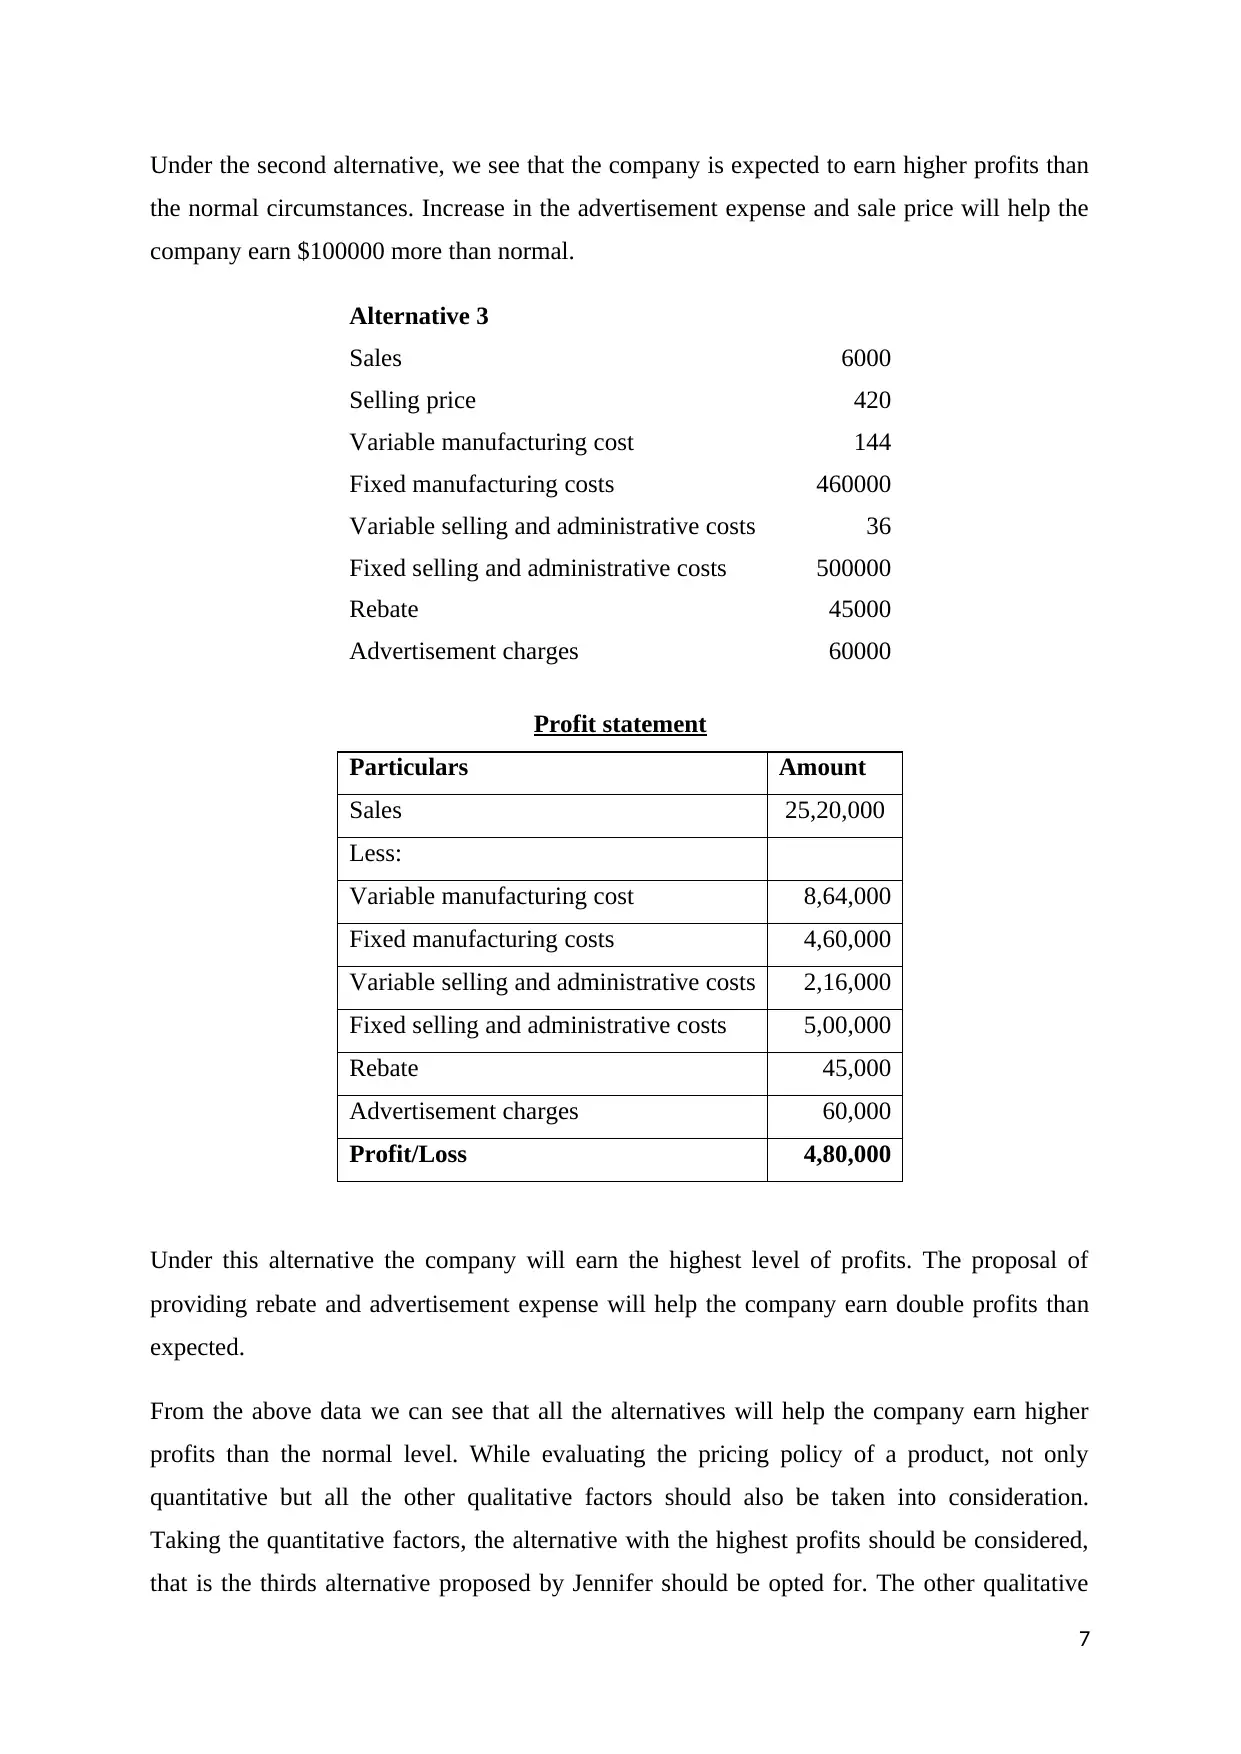
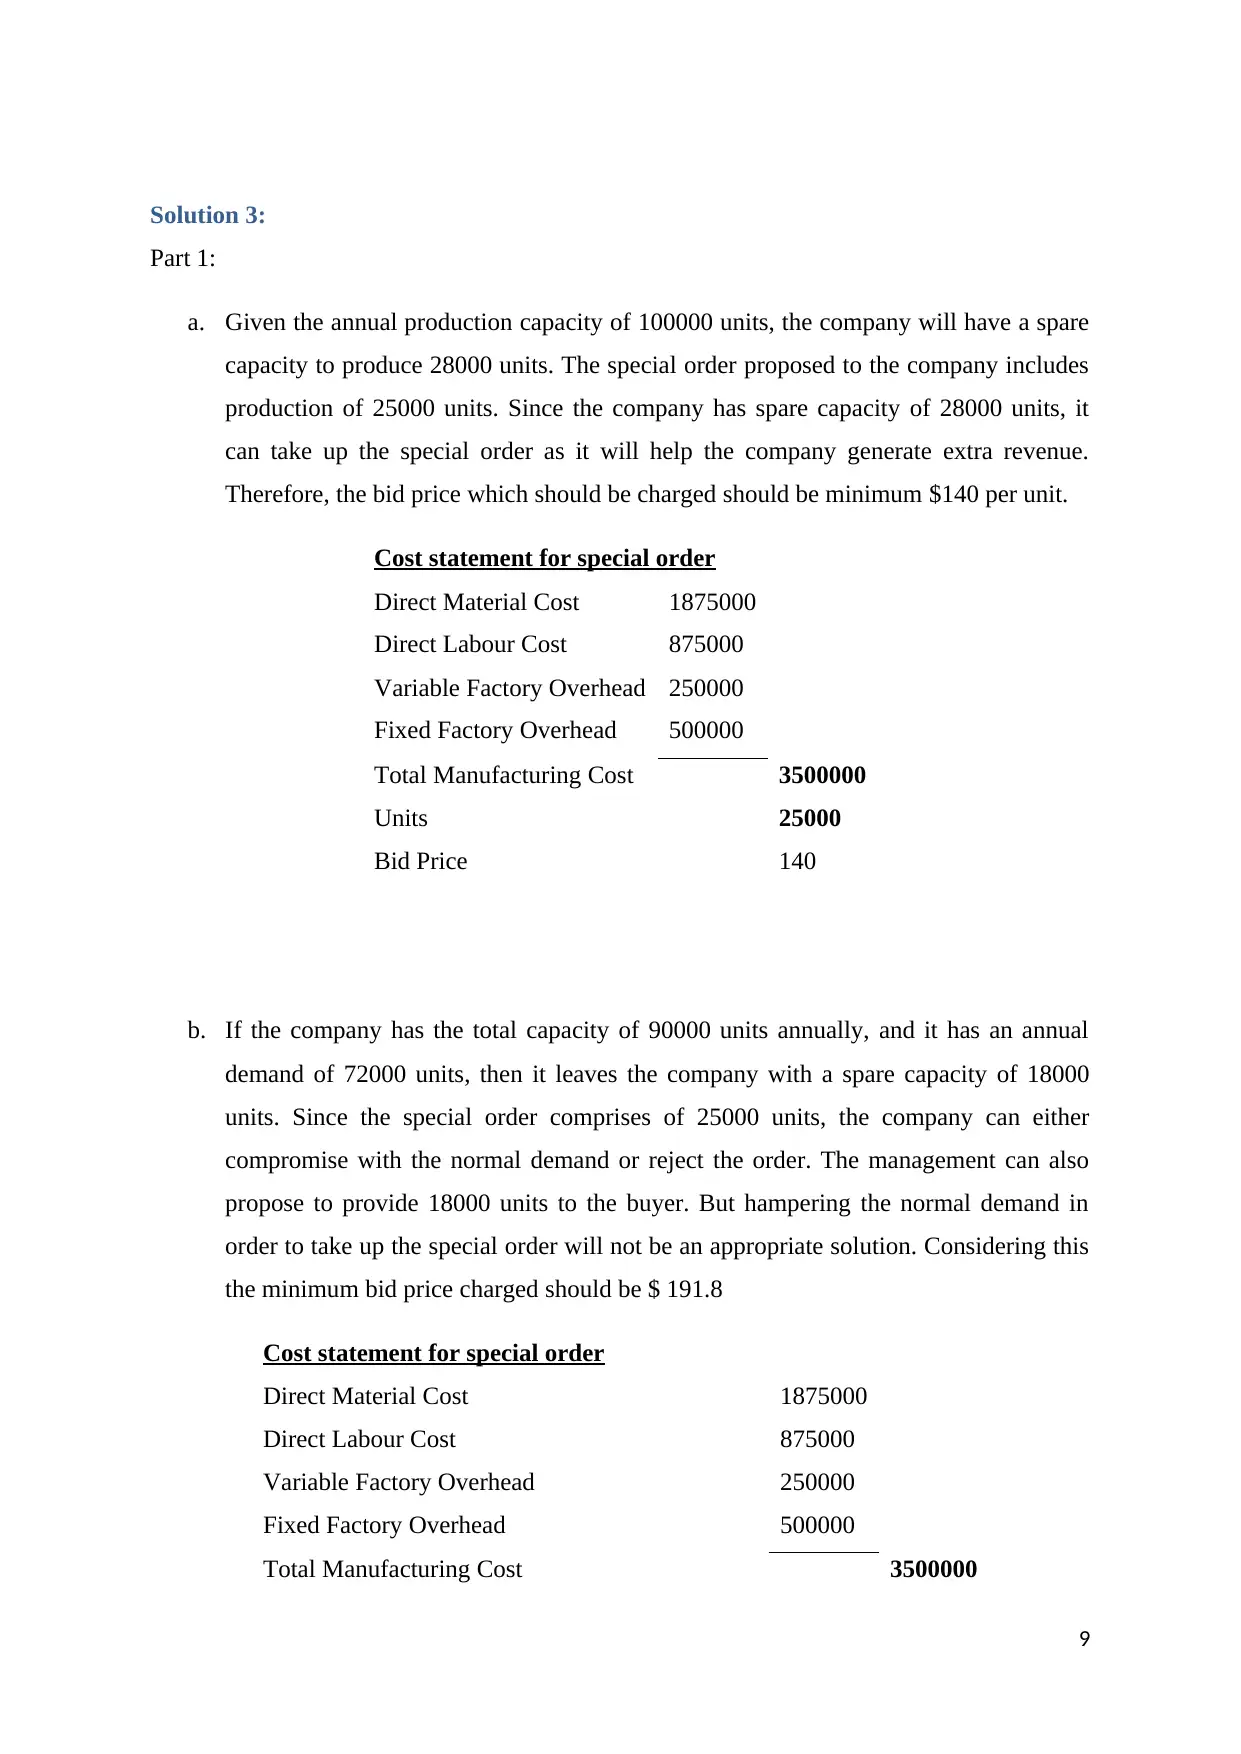
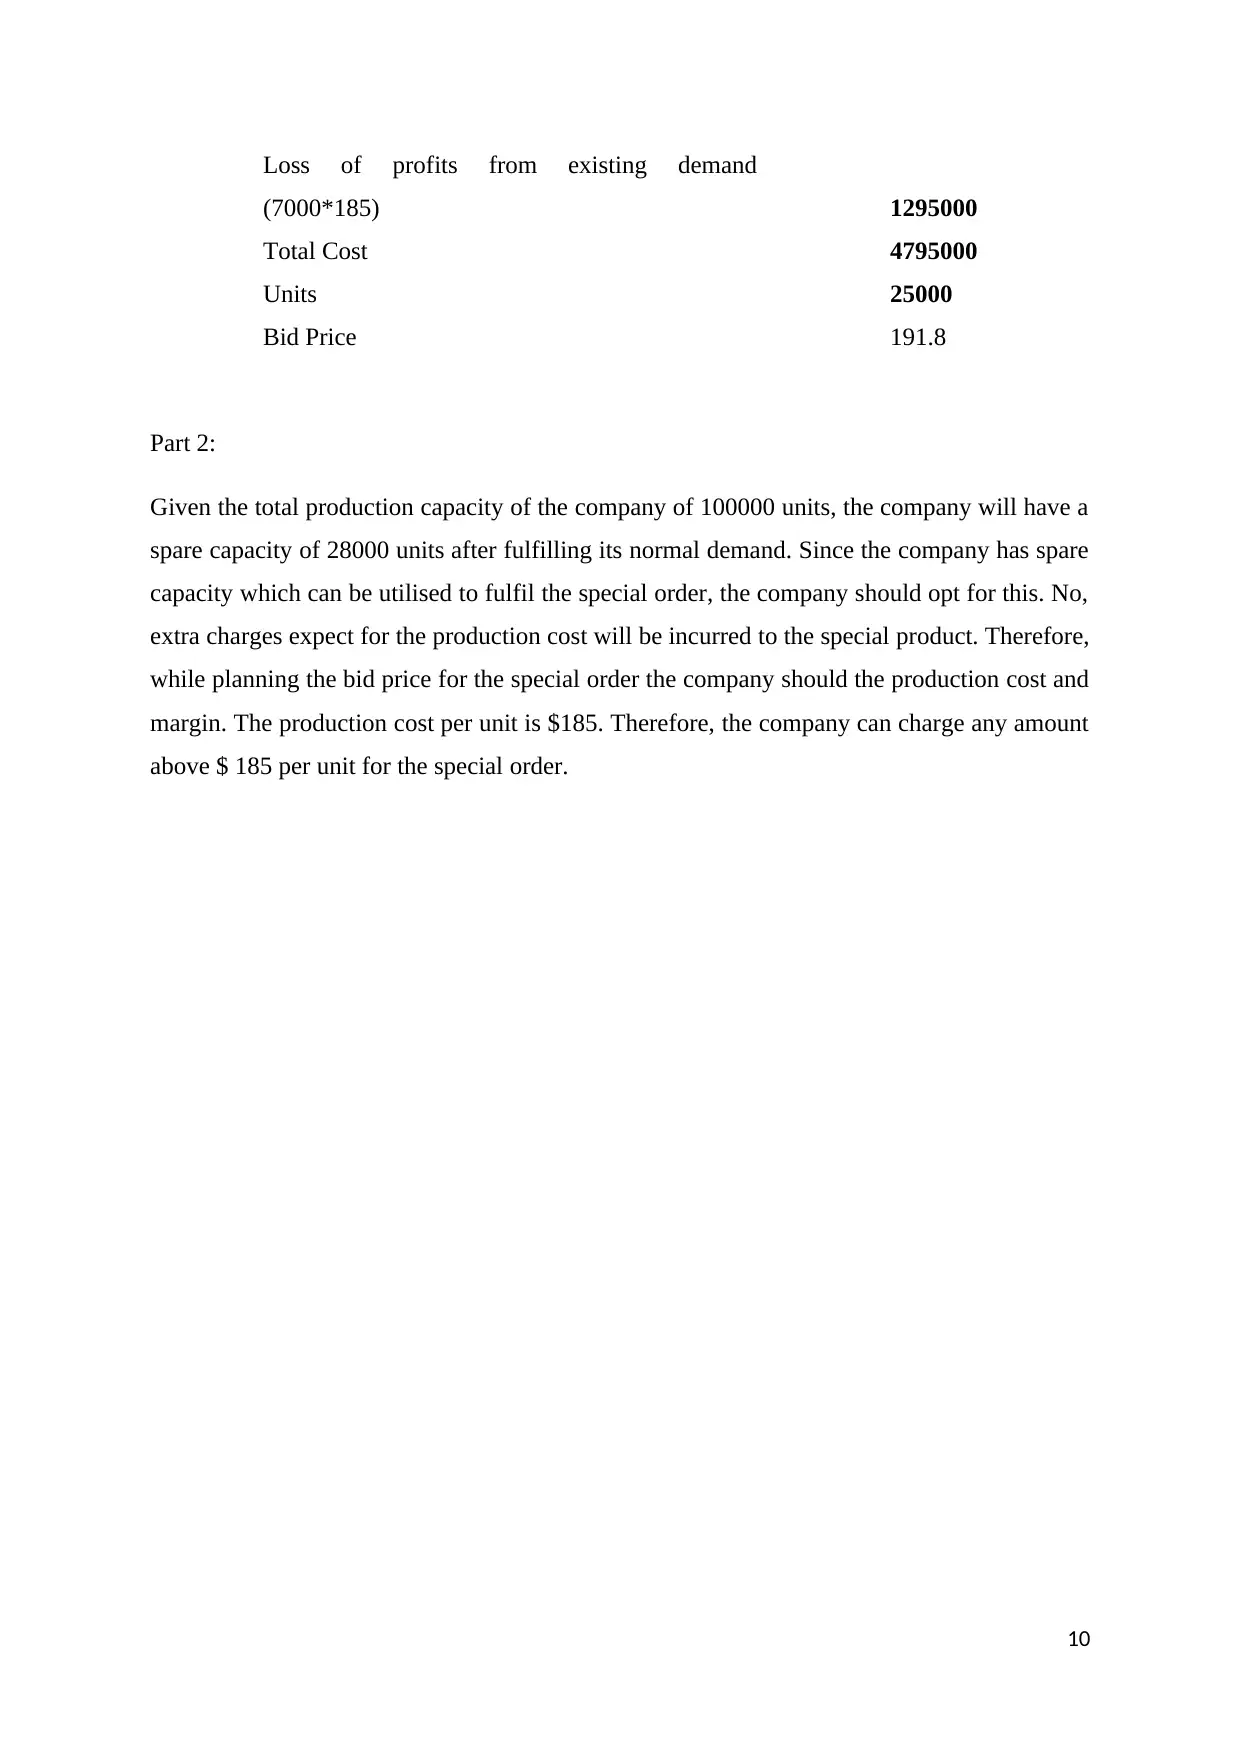
This report provides a detailed analysis of cash flow and profitability for a company, utilizing data from its annual reports and financial statements. It includes a calculation of the company's cash cycle over five years, an evaluation of cash flow trends, and an assessment of different strategies to enhance profitability. The analysis covers various scenarios, including changes in sales volume, pricing, and advertising expenses, to determine the most effective approach for maximizing profits. Furthermore, the report examines a special order scenario, considering factors such as production capacity and potential impact on existing demand, to determine an appropriate bid price. The report concludes with recommendations based on both quantitative and qualitative factors, emphasizing the importance of balancing profitability with product quality and effective promotional campaigns. Desklib offers a wealth of similar solved assignments and past papers to aid students in their studies.
Document Page
ACCOUNTING FOR MANAGERS
1
tabler-icon-diamond-filled.svg

Secure Best Marks with AI Grader

Need help grading? Try our AI Grader for instant feedback on your assignments.
Document Page
Contents
Solution 1:.............................................................................................................................................3
Solution 2:.............................................................................................................................................5
Solution 3:.............................................................................................................................................9
Bibliography........................................................................................................................................11
2
Document Page
Solution 1:
Taking the data for the latest annual report of Woolsworth group, we have calculated the cash
cycle of the company for the last five years:
Particulars 2018 2017 2016 2015 2014 2013
Inventory 4,233.00 4,080.40 4,558.50 4,872.20 4,693.20 4,205.40
Debtors 894.00 816.80 849.80 1,001.90 965.20 985.20
Creditors 5,316.00 5,068.20 4,809.10 5,040.00 4,588.40 4,080.00
Cogs
40,017.0
0
39,546.1
0
38,309.3
0
42,596.6
0
44,295.2
0
42,754.9
0
Sales
56,726.0
0
55,475.0
0
53,473.9
0
58,812.0
0
60,772.8
0
58,516.4
0
Average
Inventory
4,156.70 4,319.45 4,715.35 4,782.70 4,449.30 2,102.70
Average Debtor 855.40 833.30 925.85 983.55 975.20 492.60
Average Creditor 5,192.10 4,938.65 4,924.55 4,814.20 4,334.20 2,040.00
Inventory
Turnover
37.91 39.87 44.93 40.98 36.66 17.95
Debtor Turnover 5.50 5.48 6.32 6.10 5.86 3.07
Creditor Turnover 47.36 45.58 46.92 41.25 35.71 17.42
Cash Cycle -3.94 -0.23 4.33 5.83 6.81 3.61
Cash cycle is the time period in which the business makes and receives payment from its
creditors and debtors. (Ittelson, 2009) Cash cycle include the time taken to recover cash form
inventories, debtors net of payment made to creditor (McLaney & Adril, 2016)s. Lower the
cash cycle better is the cash movement. We can see that the company has a very cash cycle,
which indicates high liquidity. This is good for the company.
The cash flow statement of the company depicts that the net cash flow for the company has
increased to $360 million from negative $38 million. The cash flows from operating activities
show a major decline in outflow of cash towards financing cost. But since the company has
3
Document Page
made higher payments to its creditors in the current year the overall cash from operating
activities of the company has declined from $ 3122 million to $ 2930 million. Also there has
been a lower cash outflows from investing and financing activities of the company from last
year which have contributed towards higher net cash inflow.
4
tabler-icon-diamond-filled.svg

Secure Best Marks with AI Grader

Need help grading? Try our AI Grader for instant feedback on your assignments.
Document Page
Solution 2:
Following is calculation of profits for the company under various alternatives:
Financial data from last year
Sales 5000
Selling price 420
Variable manufacturing cost 144
Fixed manufacturing costs 460000
Variable selling and administrative costs 36
Fixed selling and administrative costs 500000
Profit statement (under current circumstances)
Particulars Amount
Sales 21,00,000
Less:
Variable manufacturing cost 7,20,000
Fixed manufacturing costs 4,60,000
Variable selling and administrative costs 1,80,000
Fixed selling and administrative costs 5,00,000
Profit/Loss 2,40,000
Alternative 1
Sales 6500
Selling price 420
Variable manufacturing cost 172
Fixed manufacturing costs 460000
Variable selling and administrative costs 36
Fixed selling and administrative costs 500000
Advertisement charges 30000
Profit statement
5
Document Page
Particulars Amount
Sales 27,30,000
Less:
Variable manufacturing cost 11,18,000
Fixed manufacturing costs 4,60,000
Variable selling and administrative costs 2,34,000
Fixed selling and administrative costs 5,00,000
Advertisement charges 30,000
Profit/Loss 3,88,000
Under this alternative, we see that the company will earn higher profits than expected.
Expending extra on advertisement expenses will help the company earn profits higher by
$148000.
Alternative 2
Sales 4500
Selling price 480
Variable manufacturing cost 144
Fixed manufacturing costs 460000
Variable selling and administrative costs 36
Fixed selling and administrative costs 500000
Advertisement charges 50000
Profit statement
Particulars Amount
Sales 21,60,000
Less:
Variable manufacturing cost 6,48,000
Fixed manufacturing costs 4,60,000
Variable selling and administrative costs 1,62,000
Fixed selling and administrative costs 5,00,000
Advertisement charges 50,000
Profit/Loss 3,40,000
6
Document Page
Under the second alternative, we see that the company is expected to earn higher profits than
the normal circumstances. Increase in the advertisement expense and sale price will help the
company earn $100000 more than normal.
Alternative 3
Sales 6000
Selling price 420
Variable manufacturing cost 144
Fixed manufacturing costs 460000
Variable selling and administrative costs 36
Fixed selling and administrative costs 500000
Rebate 45000
Advertisement charges 60000
Profit statement
Particulars Amount
Sales 25,20,000
Less:
Variable manufacturing cost 8,64,000
Fixed manufacturing costs 4,60,000
Variable selling and administrative costs 2,16,000
Fixed selling and administrative costs 5,00,000
Rebate 45,000
Advertisement charges 60,000
Profit/Loss 4,80,000
Under this alternative the company will earn the highest level of profits. The proposal of
providing rebate and advertisement expense will help the company earn double profits than
expected.
From the above data we can see that all the alternatives will help the company earn higher
profits than the normal level. While evaluating the pricing policy of a product, not only
quantitative but all the other qualitative factors should also be taken into consideration.
Taking the quantitative factors, the alternative with the highest profits should be considered,
that is the thirds alternative proposed by Jennifer should be opted for. The other qualitative
7
tabler-icon-diamond-filled.svg

Paraphrase This Document

Need a fresh take? Get an instant paraphrase of this document with our AI Paraphraser
Document Page
factors which should be taken care of while evaluating the pricing policy include quality of a
product. In order to increase the profitability of the company, many times the management
compromises with the quality of the product. Quality of a product should be compromised
with. In order to improve the profitability of a product it is important that a proper campaign
for promotion ne conducted for the product. Creating aware née for the product will help
increase sales which will assist in increased profitability.
8
Document Page
Solution 3:
Part 1:
a. Given the annual production capacity of 100000 units, the company will have a spare
capacity to produce 28000 units. The special order proposed to the company includes
production of 25000 units. Since the company has spare capacity of 28000 units, it
can take up the special order as it will help the company generate extra revenue.
Therefore, the bid price which should be charged should be minimum $140 per unit.
Cost statement for special order
Direct Material Cost 1875000
Direct Labour Cost 875000
Variable Factory Overhead 250000
Fixed Factory Overhead 500000
Total Manufacturing Cost 3500000
Units 25000
Bid Price 140
b. If the company has the total capacity of 90000 units annually, and it has an annual
demand of 72000 units, then it leaves the company with a spare capacity of 18000
units. Since the special order comprises of 25000 units, the company can either
compromise with the normal demand or reject the order. The management can also
propose to provide 18000 units to the buyer. But hampering the normal demand in
order to take up the special order will not be an appropriate solution. Considering this
the minimum bid price charged should be $ 191.8
Cost statement for special order
Direct Material Cost 1875000
Direct Labour Cost 875000
Variable Factory Overhead 250000
Fixed Factory Overhead 500000
Total Manufacturing Cost 3500000
9
Document Page
Loss of profits from existing demand
(7000*185) 1295000
Total Cost 4795000
Units 25000
Bid Price 191.8
Part 2:
Given the total production capacity of the company of 100000 units, the company will have a
spare capacity of 28000 units after fulfilling its normal demand. Since the company has spare
capacity which can be utilised to fulfil the special order, the company should opt for this. No,
extra charges expect for the production cost will be incurred to the special product. Therefore,
while planning the bid price for the special order the company should the production cost and
margin. The production cost per unit is $185. Therefore, the company can charge any amount
above $ 185 per unit for the special order.
10
tabler-icon-diamond-filled.svg

Secure Best Marks with AI Grader

Need help grading? Try our AI Grader for instant feedback on your assignments.
Document Page
Bibliography
Ittelson, T. (2009). Financial Statements: A Step-by-Step Guide to Understanding and
Creating Financial Reports. Franklin Lakes, N.J.: Career Press.
McLaney, E., & Adril, D. P. (2016). Accounting and Finance: An Introduction. United
Kingdom: Pearson.
11
chevron_up_icon
1 out of 11
circle_padding
hide_on_mobile
zoom_out_icon
[object Object]