ACC00724 Corporate Accounting: Financial Analysis Report S3 2019

Verified

Added on  2022/08/21

|11
|1340
|16
Report
AI Summary
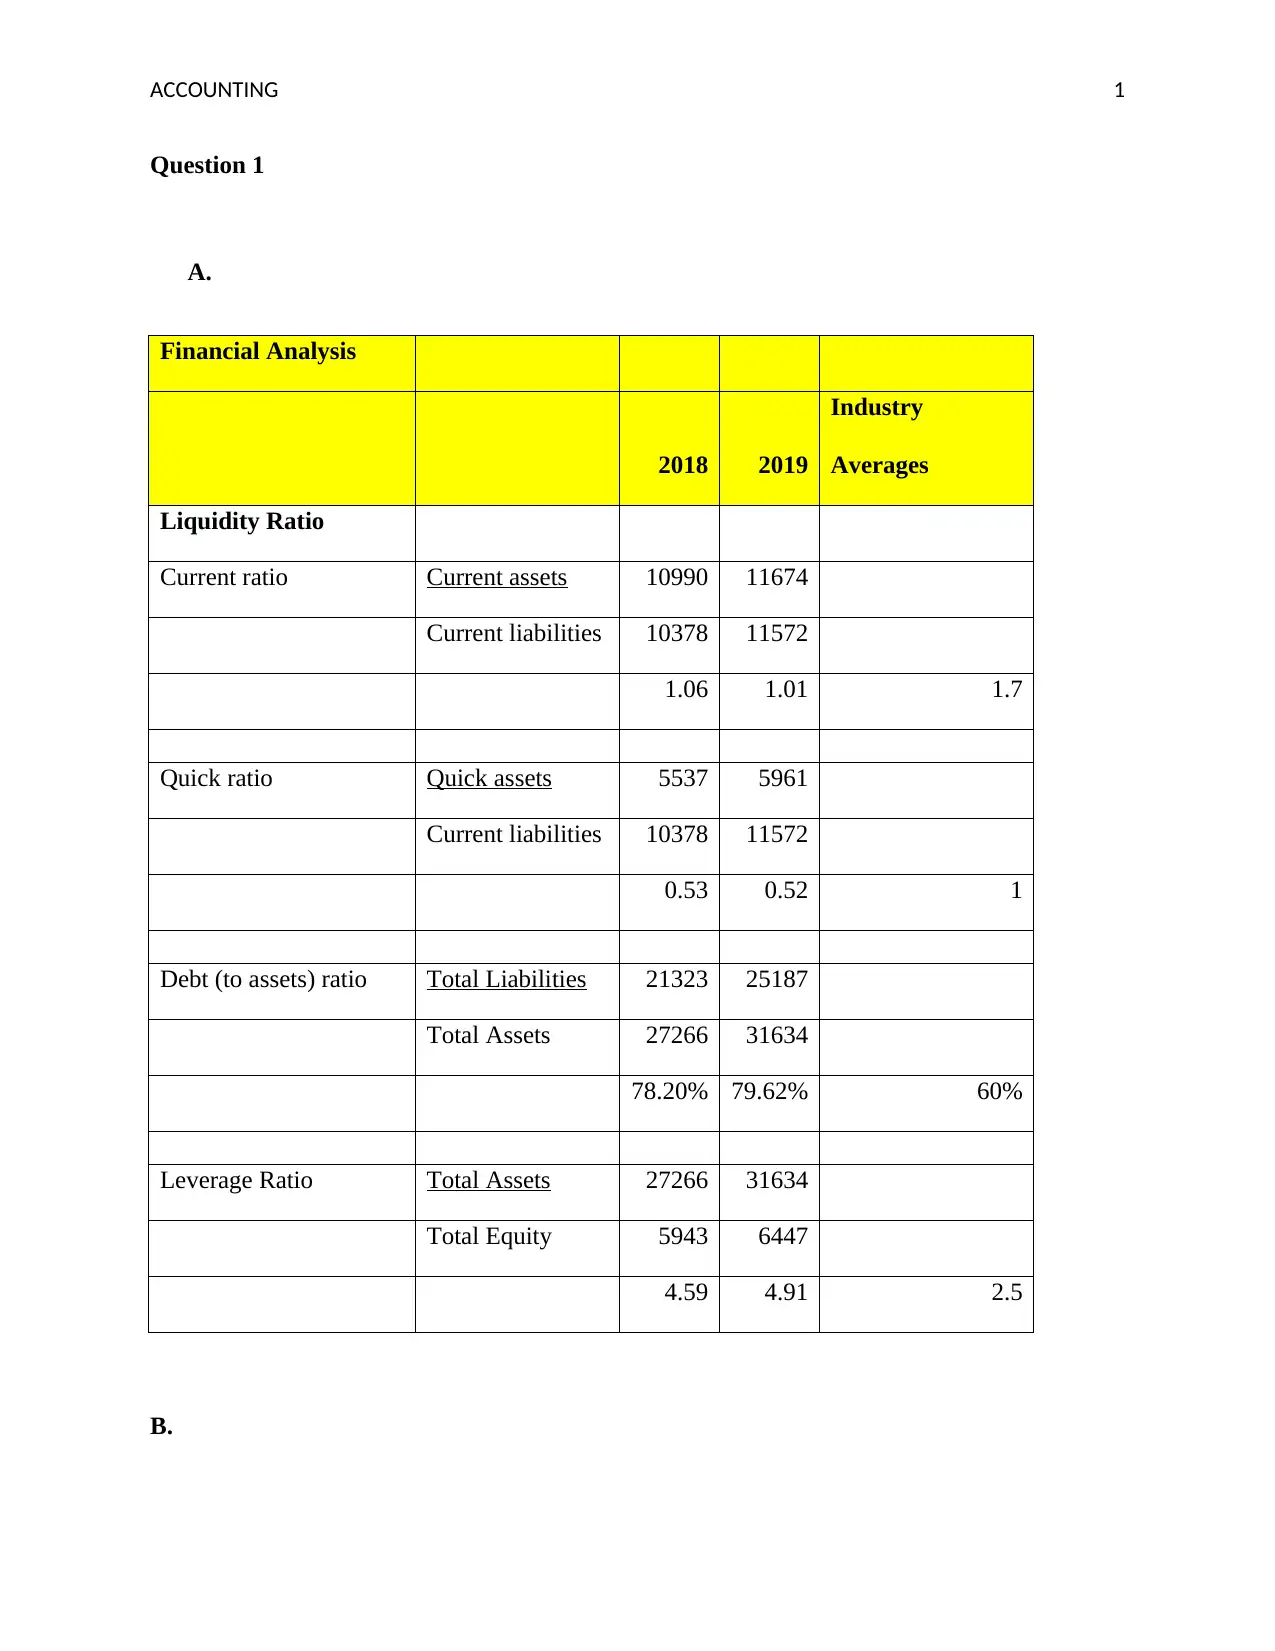
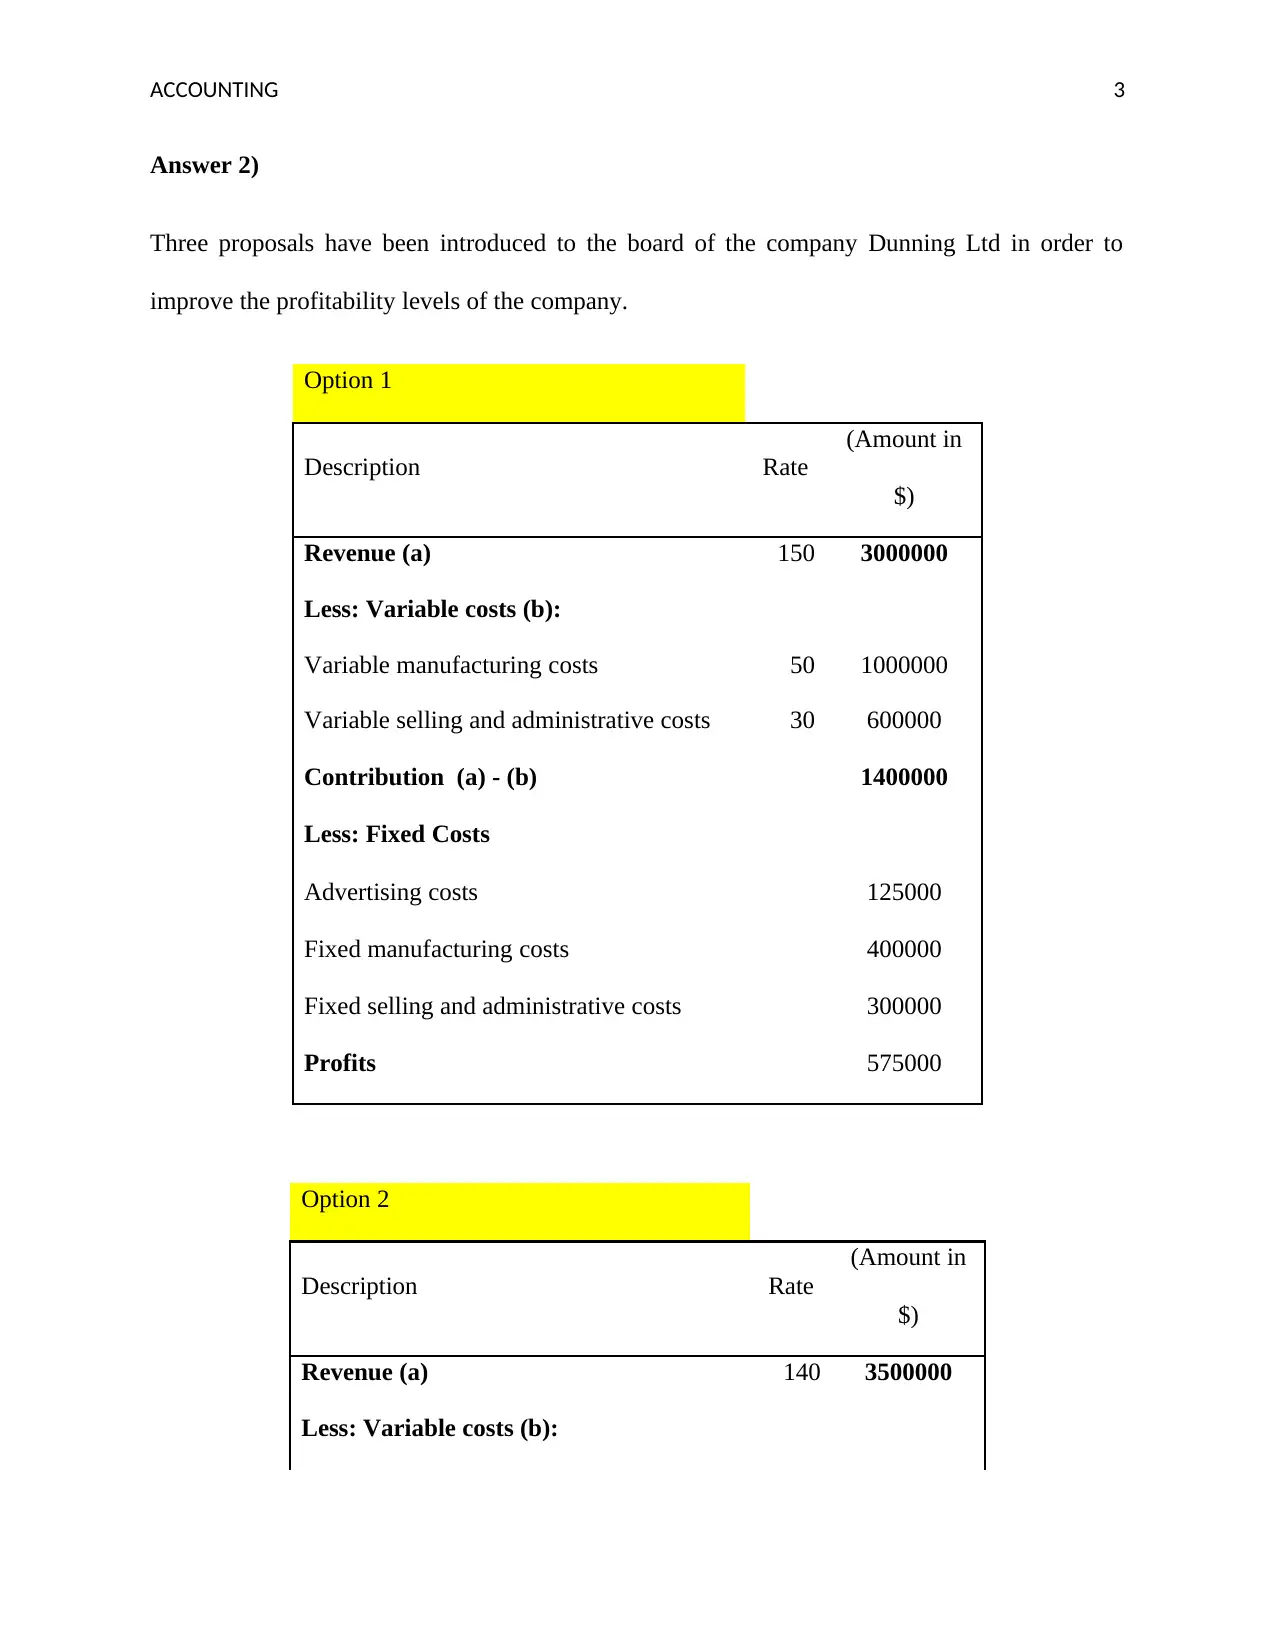
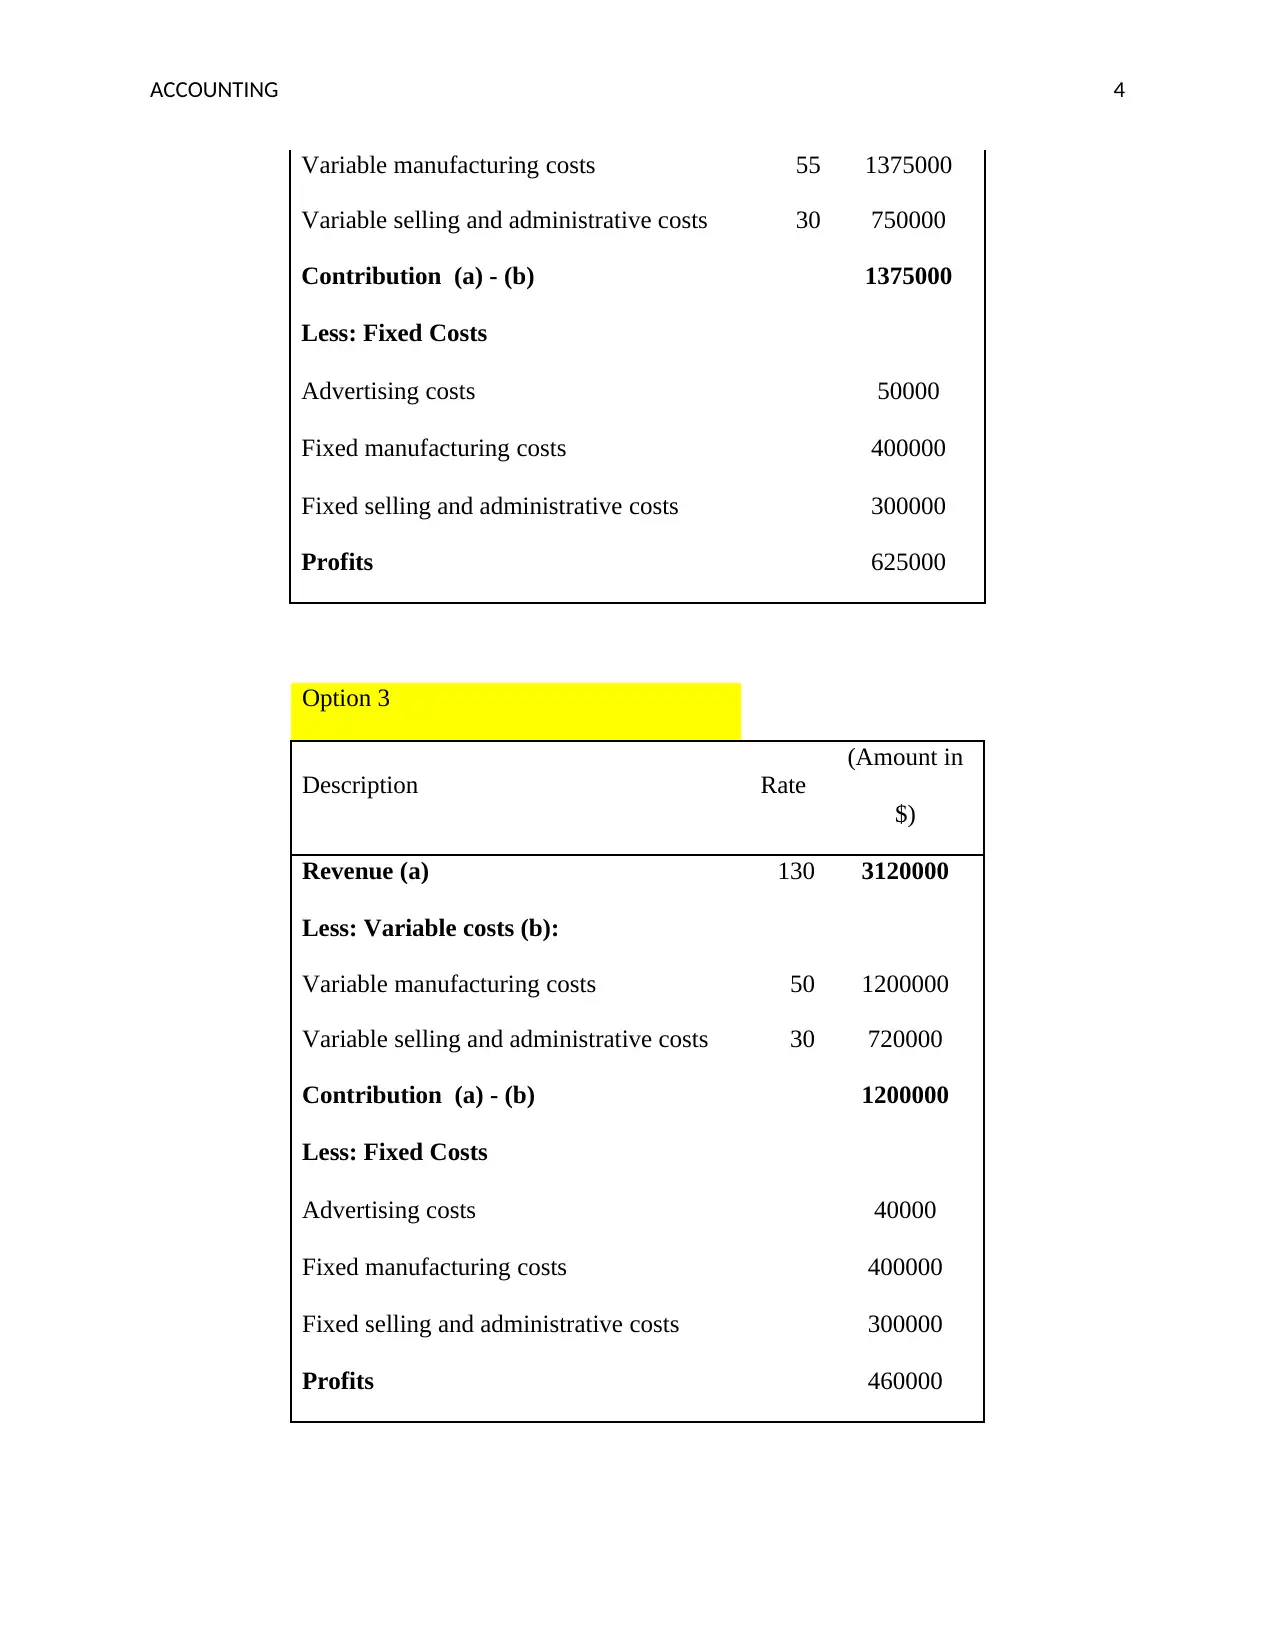
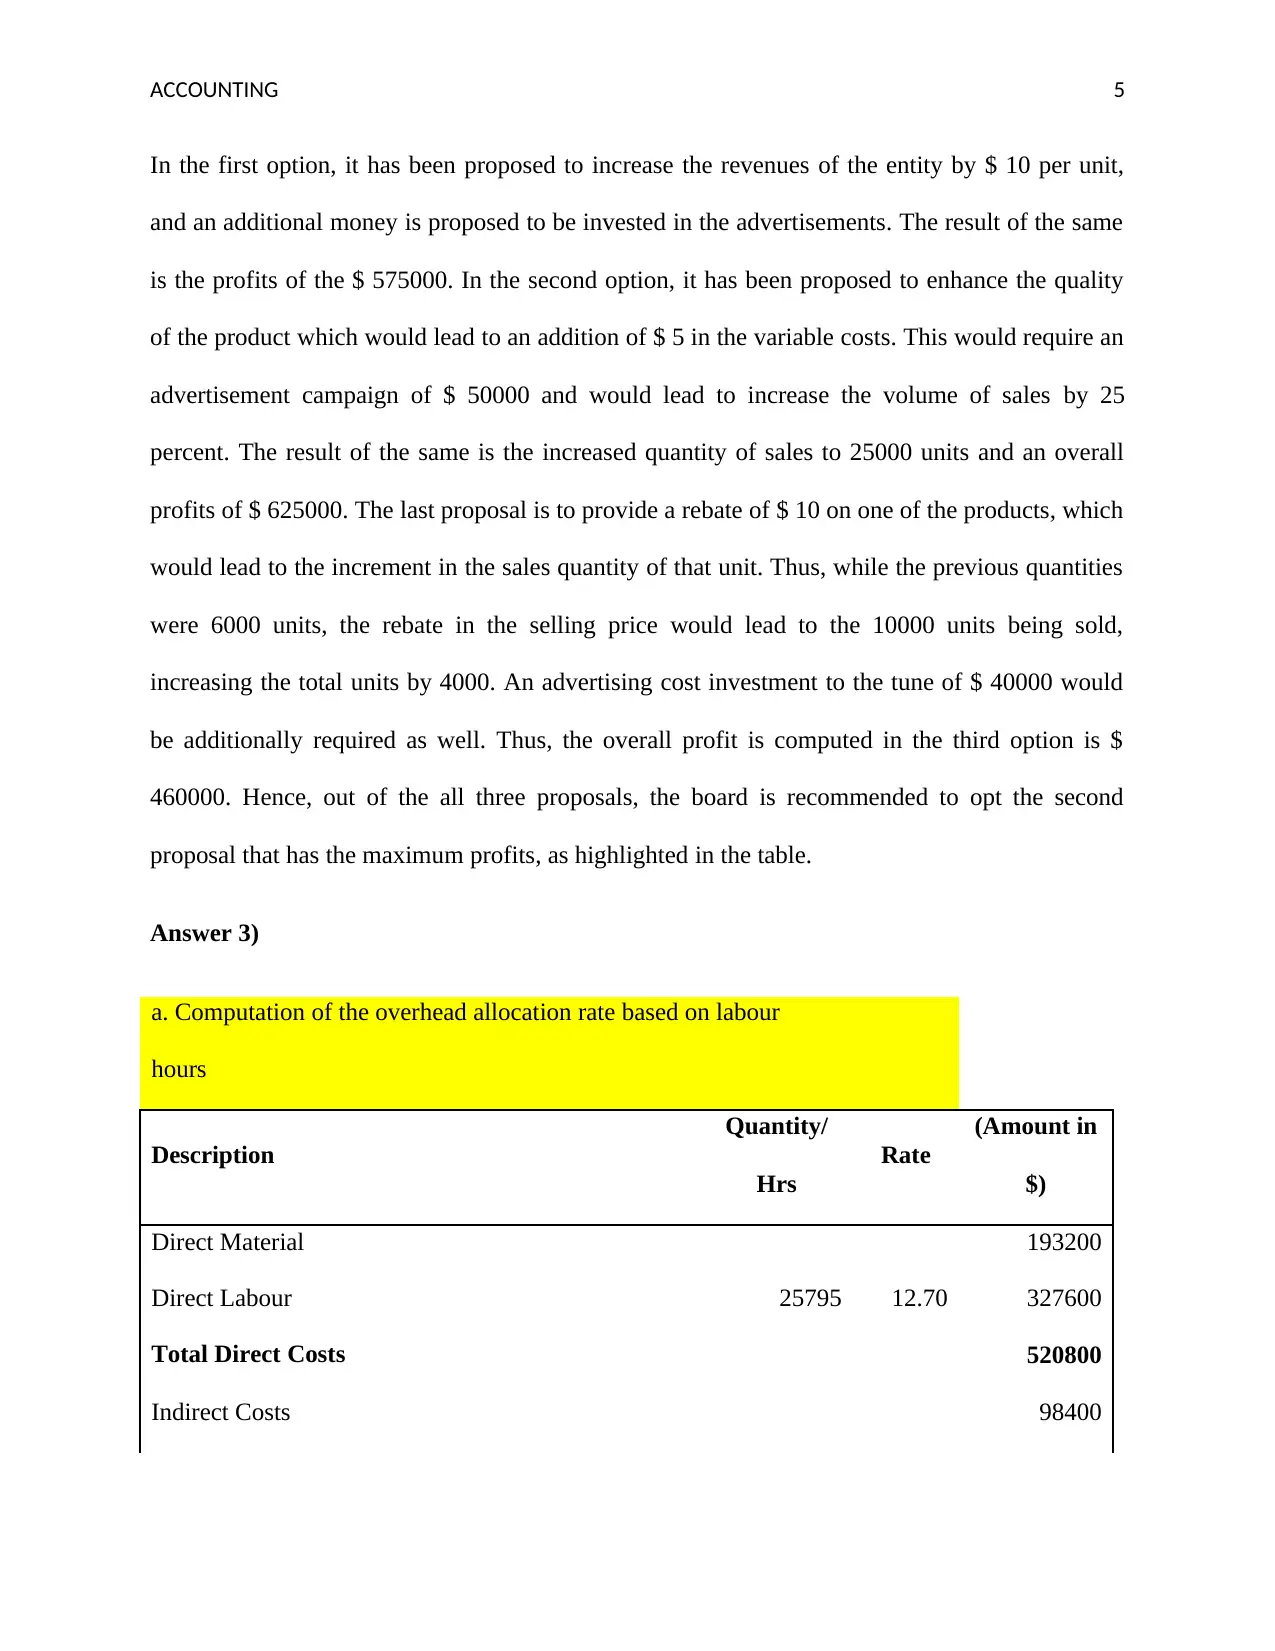
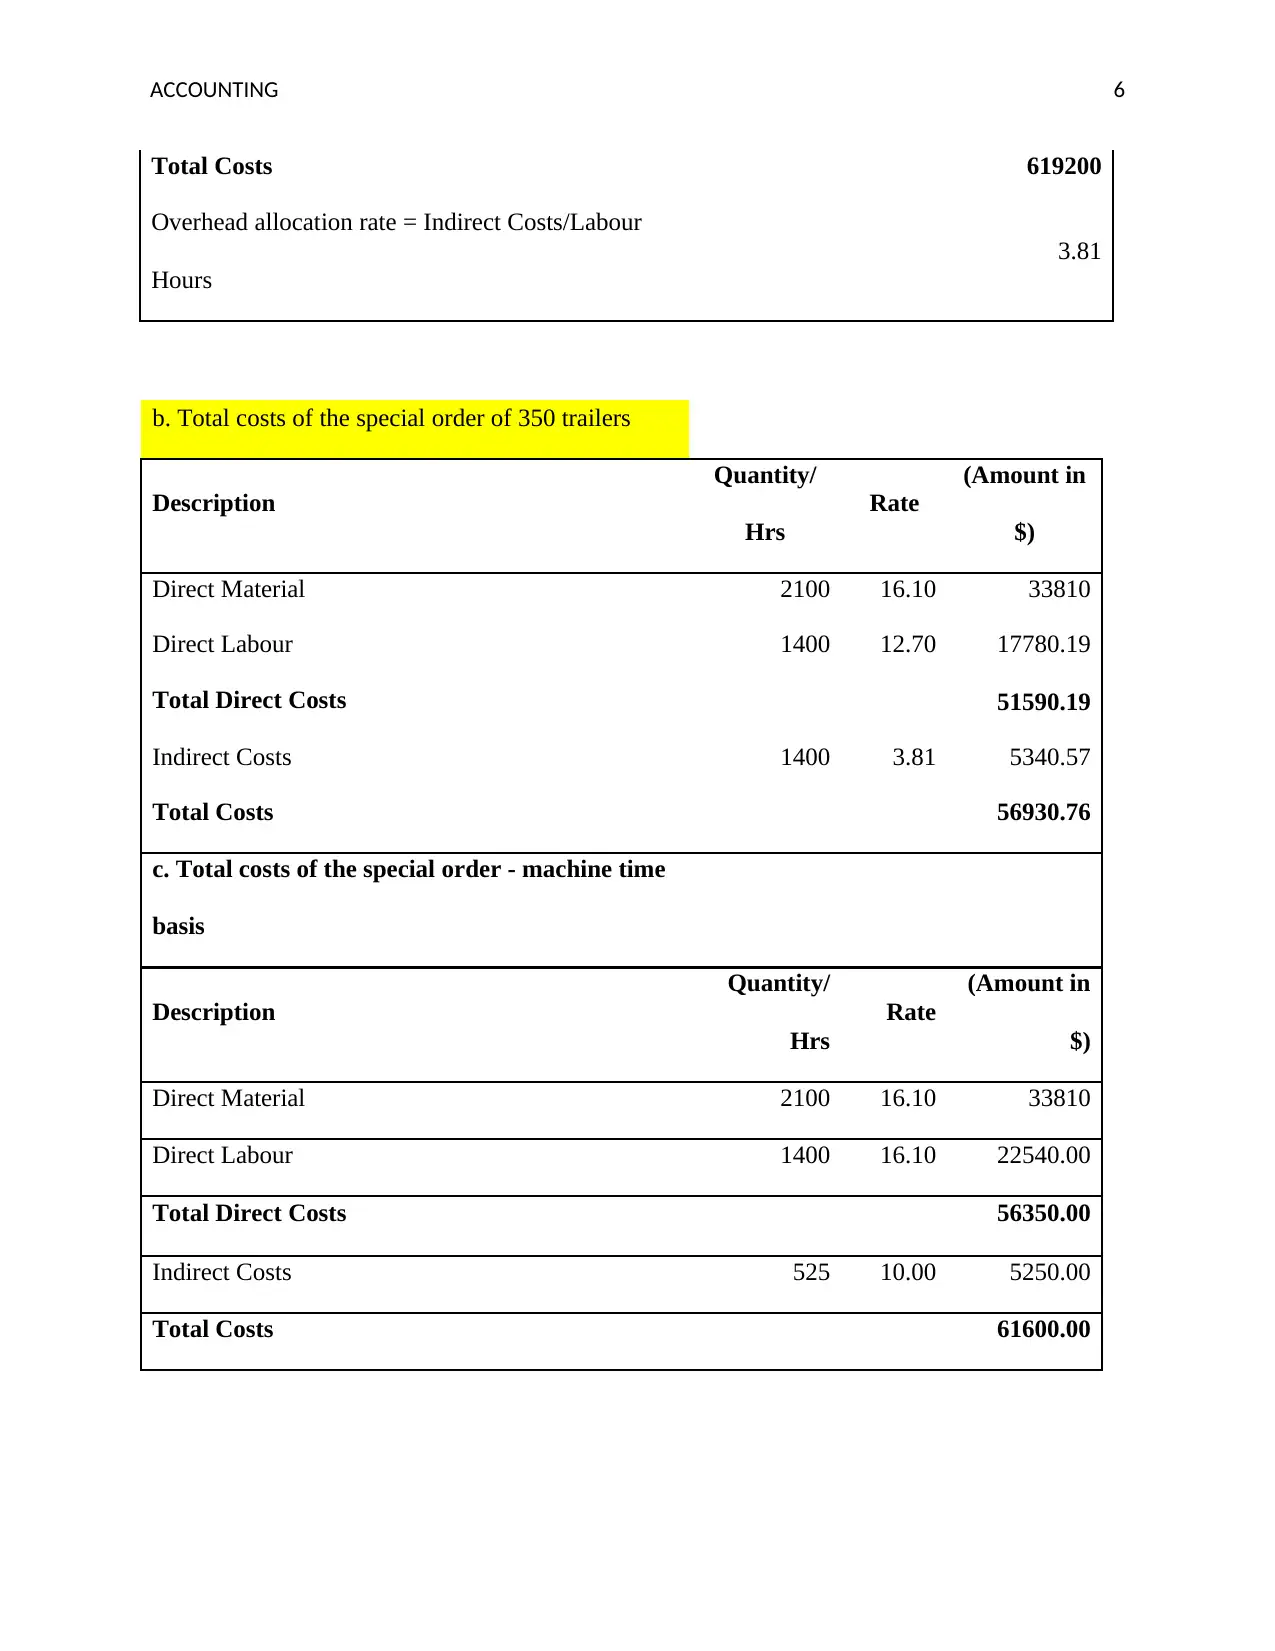
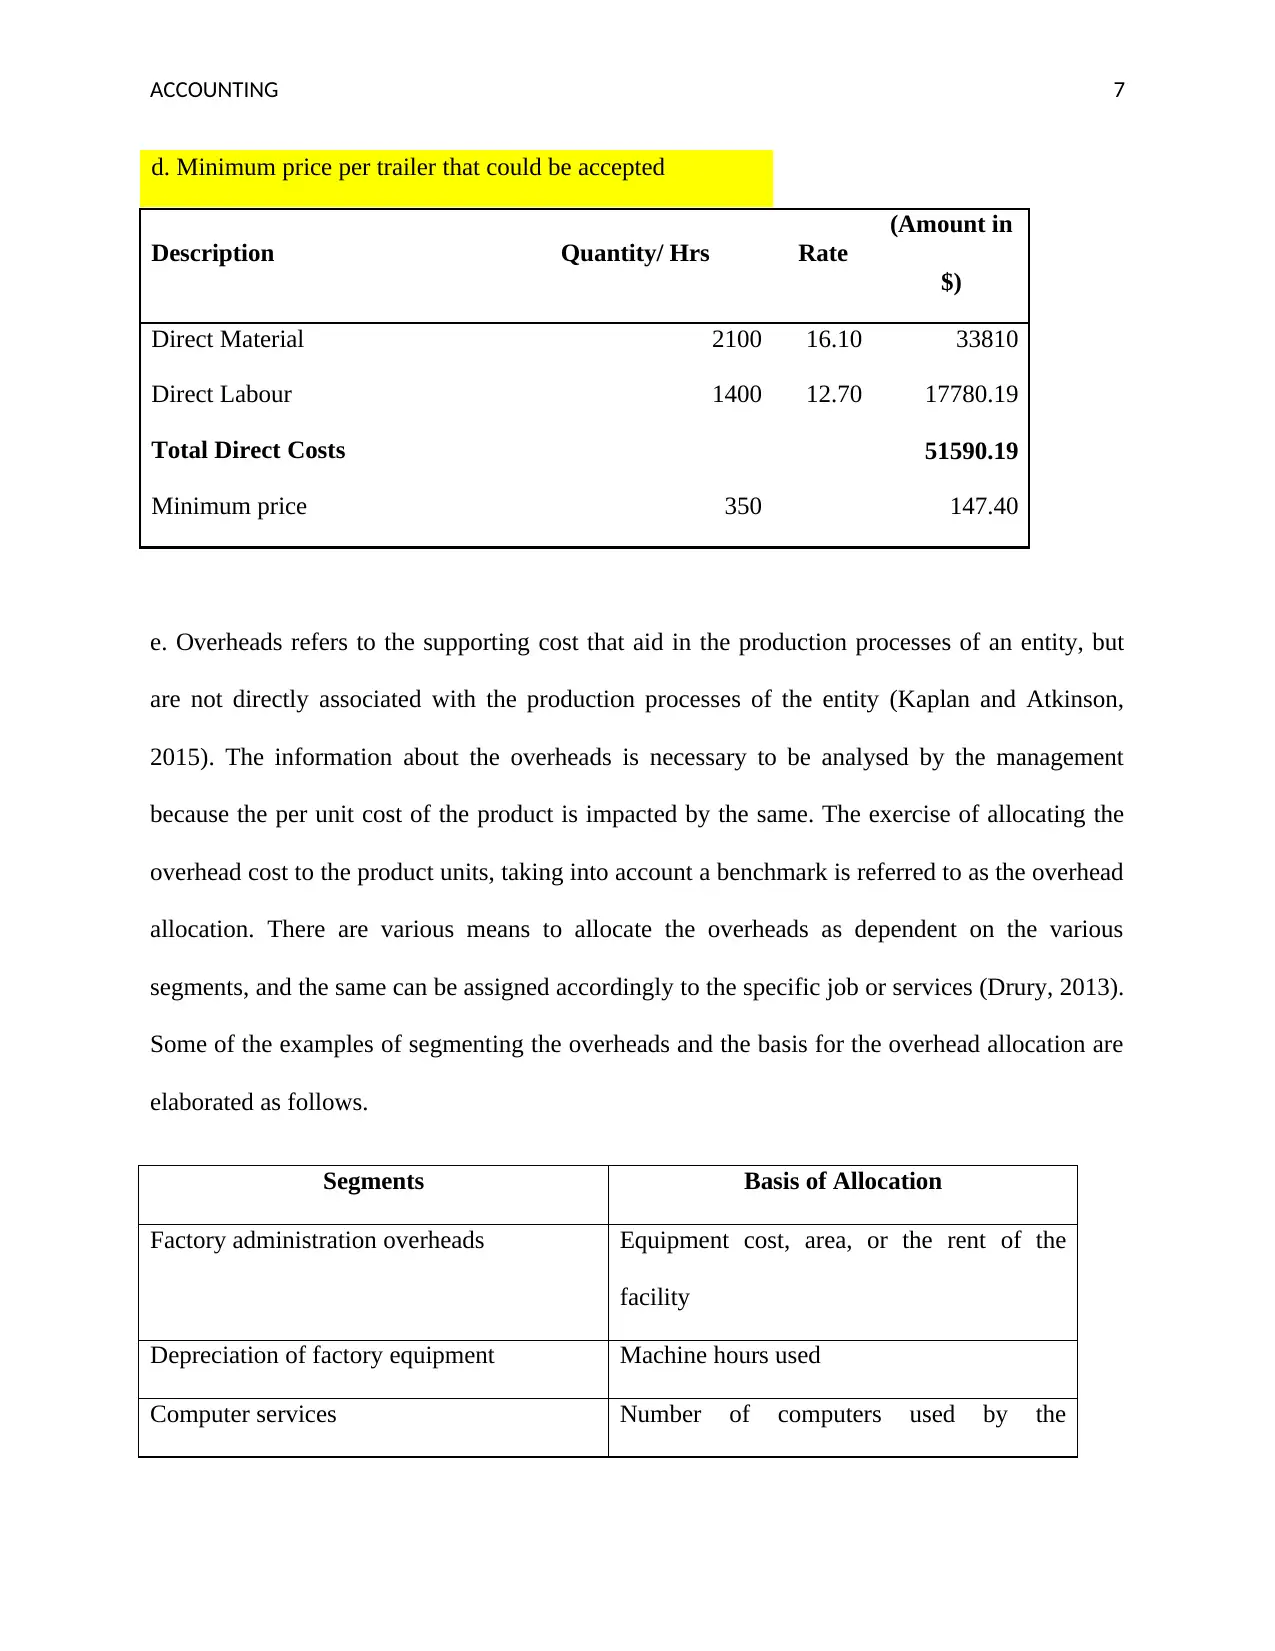
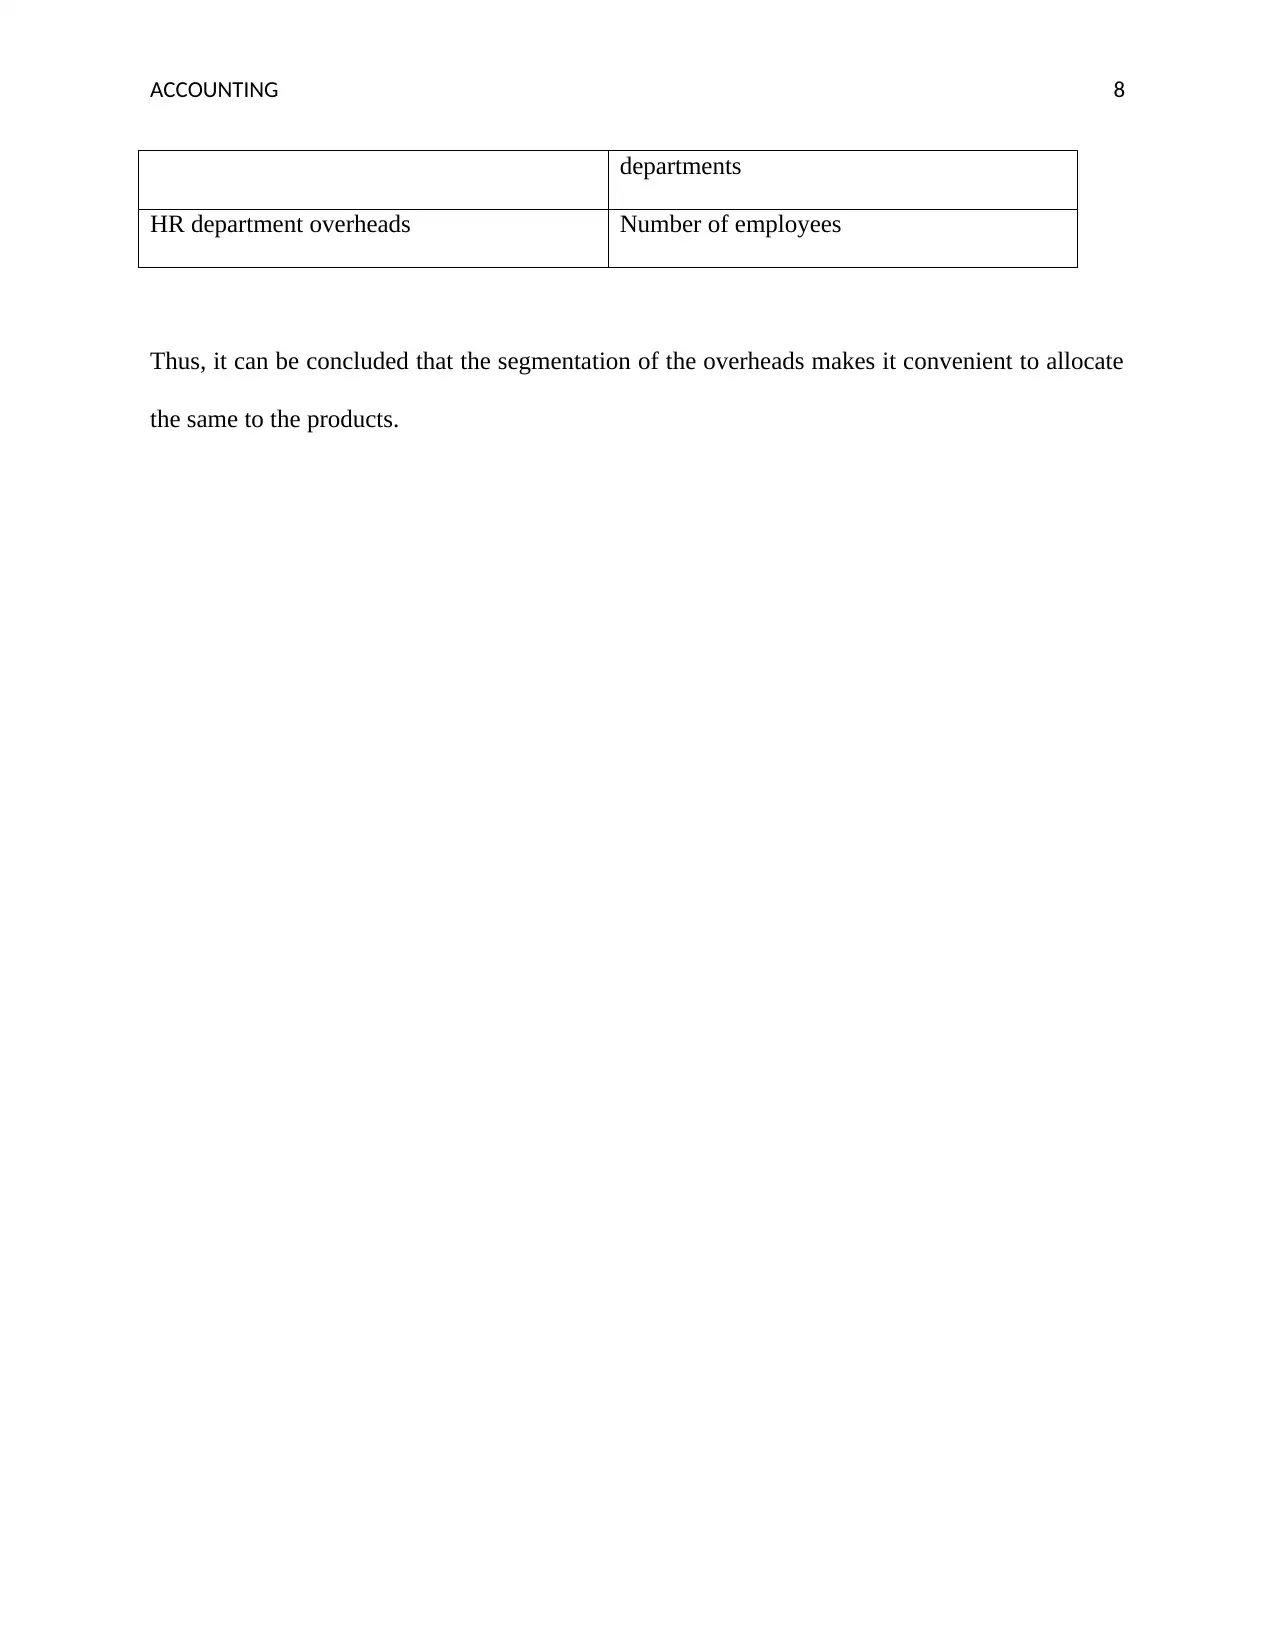
This assignment provides a comprehensive financial analysis of a company, calculating liquidity and financial stability ratios for the years 2018 and 2019, and compares them to industry averages. It evaluates the company's financial performance and risk from an investor's perspective. The assignment also analyzes three proposals to improve the company's profitability, recommending the option with the highest projected profits. Furthermore, it calculates overhead allocation rates and total costs for a special order under different allocation methods, determining the minimum acceptable price per trailer. Finally, it discusses the importance of overhead allocation and provides examples of segmenting overheads based on different allocation methods. Desklib offers a range of study tools and solved assignments for students seeking to enhance their understanding of corporate accounting and financial analysis.
tabler-icon-diamond-filled.svg

Contribute Materials

Your contribution can guide someone’s learning journey. Share your documents today.
Document Page
Corporate Accounting
tabler-icon-diamond-filled.svg

Secure Best Marks with AI Grader

Need help grading? Try our AI Grader for instant feedback on your assignments.
Document Page
ACCOUNTING 1
Question 1
A.
Financial Analysis
2018 2019
Industry
Averages
Liquidity Ratio
Current ratio Current assets 10990 11674
Current liabilities 10378 11572
1.06 1.01 1.7
Quick ratio Quick assets 5537 5961
Current liabilities 10378 11572
0.53 0.52 1
Debt (to assets) ratio Total Liabilities 21323 25187
Total Assets 27266 31634
78.20% 79.62% 60%
Leverage Ratio Total Assets 27266 31634
Total Equity 5943 6447
4.59 4.91 2.5
B.
Document Page
ACCOUNTING 2
Liquidity Ratio
It has been determined that current ratio of the firm has been decreases from the previous year’s
such as 1.06 to 1.01 in 2018 to 2019. Industry Current Ratio is 1.7 which is high as compare to
the company ratio. The main reason of decreasing the current ratio such as current liabilities has
been increases with the increasing amount of current assets. The quick ratio of the company is
also less as compare to industry average as it is 0.52 and industry average is 1 which depicts that
liquidity position of the firm is not that strong. The poor liquidity position states that the
company is not able to pay its all short term liabilities by using the current assets (Williams and
Dobelman, 2017).
Financial Stability
In order to evaluate the financial stability, leverage and debt ratio has been determined.
According to leverage ratio evaluation, it has been found that the company debt ratio is high as
compare to industry average which such as it is 78.20 and 79.62% in the year 2018 and 2019
respectively and industry average is 60%. This ratio states that the firm has the capacity to pay
the short term or long term obligations by using the assets as the amount of assets is high as
compare to its total liabilities. Leverage Ratio of the industry average is also less as compare to
the company (Zainudin, and Hashim, 2016).
C.
As per the above evaluation, it has been found that the firm financial performance is moderate
due to which the chance of risk is also moderate. Being an investor, I would like to lend money
to the company as it has high amount of assets that can be used to pay all liabilities so that the
chances of loss has been decreases.
Document Page
ACCOUNTING 3
Answer 2)
Three proposals have been introduced to the board of the company Dunning Ltd in order to
improve the profitability levels of the company.
Option 1
Description Rate
(Amount in
$)
Revenue (a) 150 3000000
Less: Variable costs (b):
Variable manufacturing costs 50 1000000
Variable selling and administrative costs 30 600000
Contribution (a) - (b) 1400000
Less: Fixed Costs
Advertising costs 125000
Fixed manufacturing costs 400000
Fixed selling and administrative costs 300000
Profits 575000
Option 2
Description Rate
(Amount in
$)
Revenue (a) 140 3500000
Less: Variable costs (b):
tabler-icon-diamond-filled.svg

Secure Best Marks with AI Grader

Need help grading? Try our AI Grader for instant feedback on your assignments.
Document Page
ACCOUNTING 4
Variable manufacturing costs 55 1375000
Variable selling and administrative costs 30 750000
Contribution (a) - (b) 1375000
Less: Fixed Costs
Advertising costs 50000
Fixed manufacturing costs 400000
Fixed selling and administrative costs 300000
Profits 625000
Option 3
Description Rate
(Amount in
$)
Revenue (a) 130 3120000
Less: Variable costs (b):
Variable manufacturing costs 50 1200000
Variable selling and administrative costs 30 720000
Contribution (a) - (b) 1200000
Less: Fixed Costs
Advertising costs 40000
Fixed manufacturing costs 400000
Fixed selling and administrative costs 300000
Profits 460000
Document Page
ACCOUNTING 5
In the first option, it has been proposed to increase the revenues of the entity by $ 10 per unit,
and an additional money is proposed to be invested in the advertisements. The result of the same
is the profits of the $ 575000. In the second option, it has been proposed to enhance the quality
of the product which would lead to an addition of $ 5 in the variable costs. This would require an
advertisement campaign of $ 50000 and would lead to increase the volume of sales by 25
percent. The result of the same is the increased quantity of sales to 25000 units and an overall
profits of $ 625000. The last proposal is to provide a rebate of $ 10 on one of the products, which
would lead to the increment in the sales quantity of that unit. Thus, while the previous quantities
were 6000 units, the rebate in the selling price would lead to the 10000 units being sold,
increasing the total units by 4000. An advertising cost investment to the tune of $ 40000 would
be additionally required as well. Thus, the overall profit is computed in the third option is $
460000. Hence, out of the all three proposals, the board is recommended to opt the second
proposal that has the maximum profits, as highlighted in the table.
Answer 3)
a. Computation of the overhead allocation rate based on labour
hours
Description
Quantity/
Hrs
Rate
(Amount in
$)
Direct Material 193200
Direct Labour 25795 12.70 327600
Total Direct Costs 520800
Indirect Costs 98400
Document Page
ACCOUNTING 6
Total Costs 619200
Overhead allocation rate = Indirect Costs/Labour
Hours
3.81
b. Total costs of the special order of 350 trailers
Description
Quantity/
Hrs
Rate
(Amount in
$)
Direct Material 2100 16.10 33810
Direct Labour 1400 12.70 17780.19
Total Direct Costs 51590.19
Indirect Costs 1400 3.81 5340.57
Total Costs 56930.76
c. Total costs of the special order - machine time
basis
Description
Quantity/
Hrs
Rate
(Amount in
$)
Direct Material 2100 16.10 33810
Direct Labour 1400 16.10 22540.00
Total Direct Costs 56350.00
Indirect Costs 525 10.00 5250.00
Total Costs 61600.00
tabler-icon-diamond-filled.svg

Paraphrase This Document

Need a fresh take? Get an instant paraphrase of this document with our AI Paraphraser
Document Page
ACCOUNTING 7
d. Minimum price per trailer that could be accepted
Description Quantity/ Hrs Rate
(Amount in
$)
Direct Material 2100 16.10 33810
Direct Labour 1400 12.70 17780.19
Total Direct Costs 51590.19
Minimum price 350 147.40
e. Overheads refers to the supporting cost that aid in the production processes of an entity, but
are not directly associated with the production processes of the entity (Kaplan and Atkinson,
2015). The information about the overheads is necessary to be analysed by the management
because the per unit cost of the product is impacted by the same. The exercise of allocating the
overhead cost to the product units, taking into account a benchmark is referred to as the overhead
allocation. There are various means to allocate the overheads as dependent on the various
segments, and the same can be assigned accordingly to the specific job or services (Drury, 2013).
Some of the examples of segmenting the overheads and the basis for the overhead allocation are
elaborated as follows.
Segments Basis of Allocation
Factory administration overheads Equipment cost, area, or the rent of the
facility
Depreciation of factory equipment Machine hours used
Computer services Number of computers used by the
Document Page
ACCOUNTING 8
departments
HR department overheads Number of employees
Thus, it can be concluded that the segmentation of the overheads makes it convenient to allocate
the same to the products.
Document Page
ACCOUNTING 9
tabler-icon-diamond-filled.svg

Secure Best Marks with AI Grader

Need help grading? Try our AI Grader for instant feedback on your assignments.
Document Page
ACCOUNTING 10
References
Drury, C. M. (2013) Management and cost accounting. UK: Springer.
Kaplan, R. S. and Atkinson, A. A. (2015) Advanced management accounting. PHI Learning.
Williams, E. E., and Dobelman, J. A. (2017) Financial statement analysis. World Scientific Book
Chapters, 109-169.
Zainudin, E. F., and Hashim, H. A. (2016) Detecting fraudulent financial reporting using
financial ratio. Journal of Financial Reporting and Accounting, 14(2), 266-278.
chevron_up_icon
1 out of 11
circle_padding
hide_on_mobile
zoom_out_icon
logo.png

Your All-in-One AI-Powered Toolkit for Academic Success.

Available 24*7 on WhatsApp / Email

[object Object]