ACC09901 Corporate Financial Management: A.G. Barr Plc Analysis
VerifiedAdded on 2023/06/14
|18
|3789
|262
Report
AI Summary
This report provides a comprehensive financial analysis of A.G. Barr Plc, prepared for the Amicable Pension Fund. It assesses the company's strategic direction, key business activities, and financial performance over a five-year period, including growth rates, cash conversion cycles, and financial ratios. The report identifies future business opportunities and risks, such as changing consumer preferences and the impact of sugar tax. It also evaluates A.G. Barr Plc's financial strengths and weaknesses, including its diverse portfolio and risk management framework. The analysis incorporates the Efficient Market Hypothesis and examines stock market pricing efficiency, concluding with investment recommendations based on valuation methods like the dividend discount model and net asset value.
Running head: CORPORATE FINANCE
Corporate Finance
Name of the Student
Name of the University
Authors Note
Course ID
Corporate Finance
Name of the Student
Name of the University
Authors Note
Course ID
Paraphrase This Document
Need a fresh take? Get an instant paraphrase of this document with our AI Paraphraser
1CORPORATE FINANCE
Table of Contents
Introduction:...............................................................................................................................2
Strategic Direction:....................................................................................................................2
Vital features of business strategies:..........................................................................................3
Five year trend performance:.....................................................................................................3
Yearly percentage growth rates:.................................................................................................4
Cash conversion cycle:...............................................................................................................4
Financial ratios:..........................................................................................................................5
Future business opportunities and risk for A.G. Barr Plc:.........................................................5
Financial performance:...............................................................................................................6
Financial strength and weakness:...............................................................................................6
Efficiency Market Hypothesis:..................................................................................................8
Stock Market Pricing Efficiency in A.G. Barr Plc Share Price:................................................8
Semi strong market form of market efficiency:.........................................................................9
Justification and description of assumptions:..........................................................................10
Usefulness and limitations of valuation methods:...................................................................11
Share price information............................................................................................................11
Conclusion:..............................................................................................................................13
Reference List:.........................................................................................................................15
2CORPORATE FINANCE
Introduction:
A.G. Barr Plc is regarded as the soft drink producer from Scotland that has its
operational base in Cumbernauld. A.G. Barr Plc is known as the popular manufacturer of
Scottish drink (Agbarr.Co.Uk, 2018). The company is listed on the London stock exchange
and it is viewed as the constituent of FTSE 250 Index. The present report is takes into
consideration the determination of strategic decision of A.G. Barr Plc by defining the main
activities carried out by the company together with the necessary features of the strategy
undertaken. The analysis will focus on the business opportunities and risk facing the
company with the emphasis on the operating performance of the firm.
The current report will be addressing the Amicable Pension Fund to take into the
account the details of financial performance over the period of five years. The study will refer
to stock market pricing efficient and efficient market hypothesis would be performed to
determine the market efficiency of A.G. Barr Plc. Additional coverage will made in the share
price performance of the firm to offer brief commentary on the share performance and
suitable recommendations will be provided relating to investment prospect for Amicable
Pension Fund.
Strategic Direction:
The primary business activates of A.G. Barr Plc is associated with the production
capabilities, generating higher quality products all through the well-funded and operative
manufacturing location. The chief business functions of A.G. Barr Plc is related to sourcing
of raw materials throughout the world to create the packaging materials for continuous
improvement. A.G. Barr Plc has its fleet of around hundred vehicles that has long relation
with the vital distribution partners (Agbarr.Co.Uk, 2018). A.G. Barr Plc strives to provide
greater service to all the customers from small to big local outlets. A.G. Barr Plc has its
⊘ This is a preview!⊘
Do you want full access?
Subscribe today to unlock all pages.
Trusted by 1+ million students worldwide
3CORPORATE FINANCE
business operations through numerous roads to market its products. The primary business
activities of company is linked with the operating activities and effective distribution
networks with direct delivery to store channel.
Vital features of business strategies:
Taking account of vital business features of A.G. Barr Plc it provides the clarity of
purpose and reliability approach forms the best outcomes (Agbarr.Co.Uk, 2018). The vital
business features for A.G. Barr Plc are;
a. Flexible and effective business operations
b. Strongly differentiated brands
c. Innovating customer understanding
d. Partnership that promotes growth
e. The company leverages its business strength and commitment of its team.
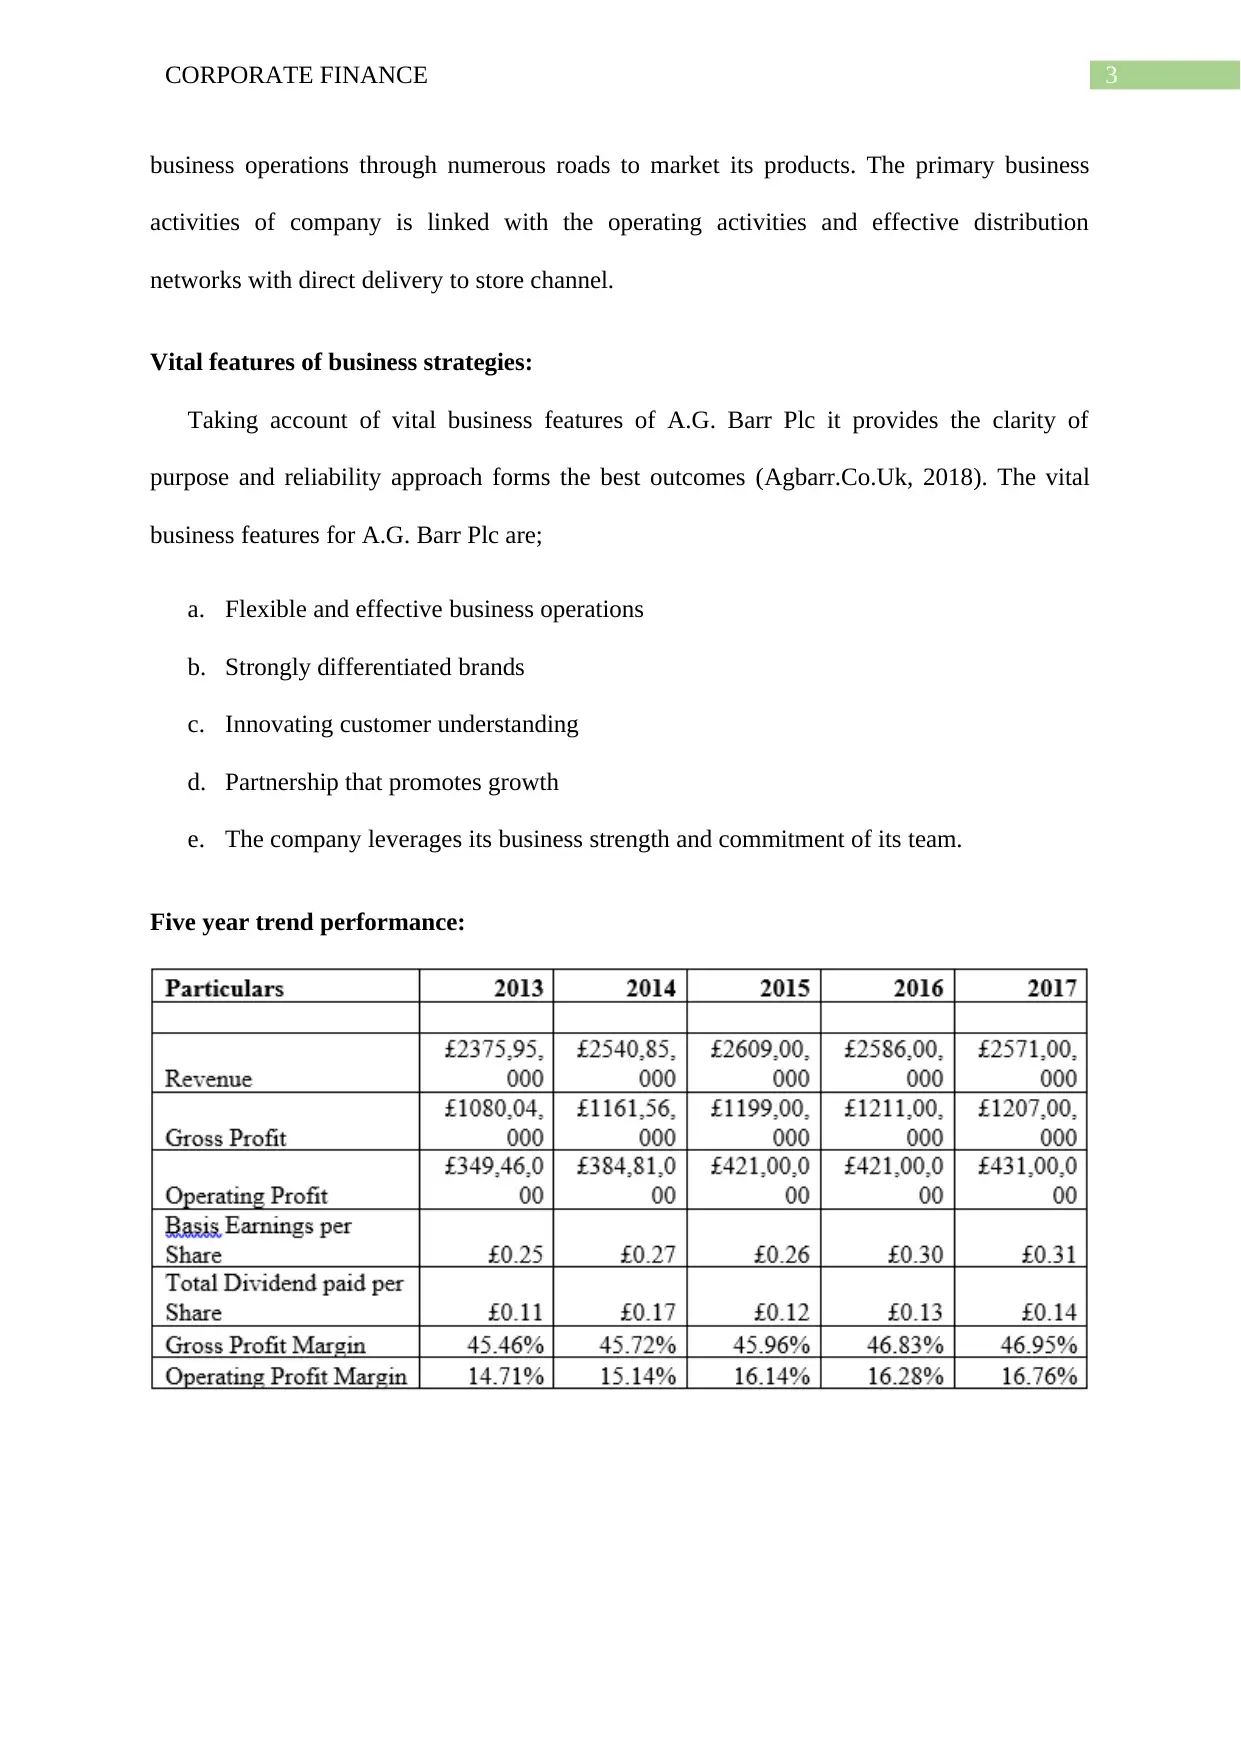
Five year trend performance:
business operations through numerous roads to market its products. The primary business
activities of company is linked with the operating activities and effective distribution
networks with direct delivery to store channel.
Vital features of business strategies:
Taking account of vital business features of A.G. Barr Plc it provides the clarity of
purpose and reliability approach forms the best outcomes (Agbarr.Co.Uk, 2018). The vital
business features for A.G. Barr Plc are;
a. Flexible and effective business operations
b. Strongly differentiated brands
c. Innovating customer understanding
d. Partnership that promotes growth
e. The company leverages its business strength and commitment of its team.
Five year trend performance:
Paraphrase This Document
Need a fresh take? Get an instant paraphrase of this document with our AI Paraphraser
4CORPORATE FINANCE
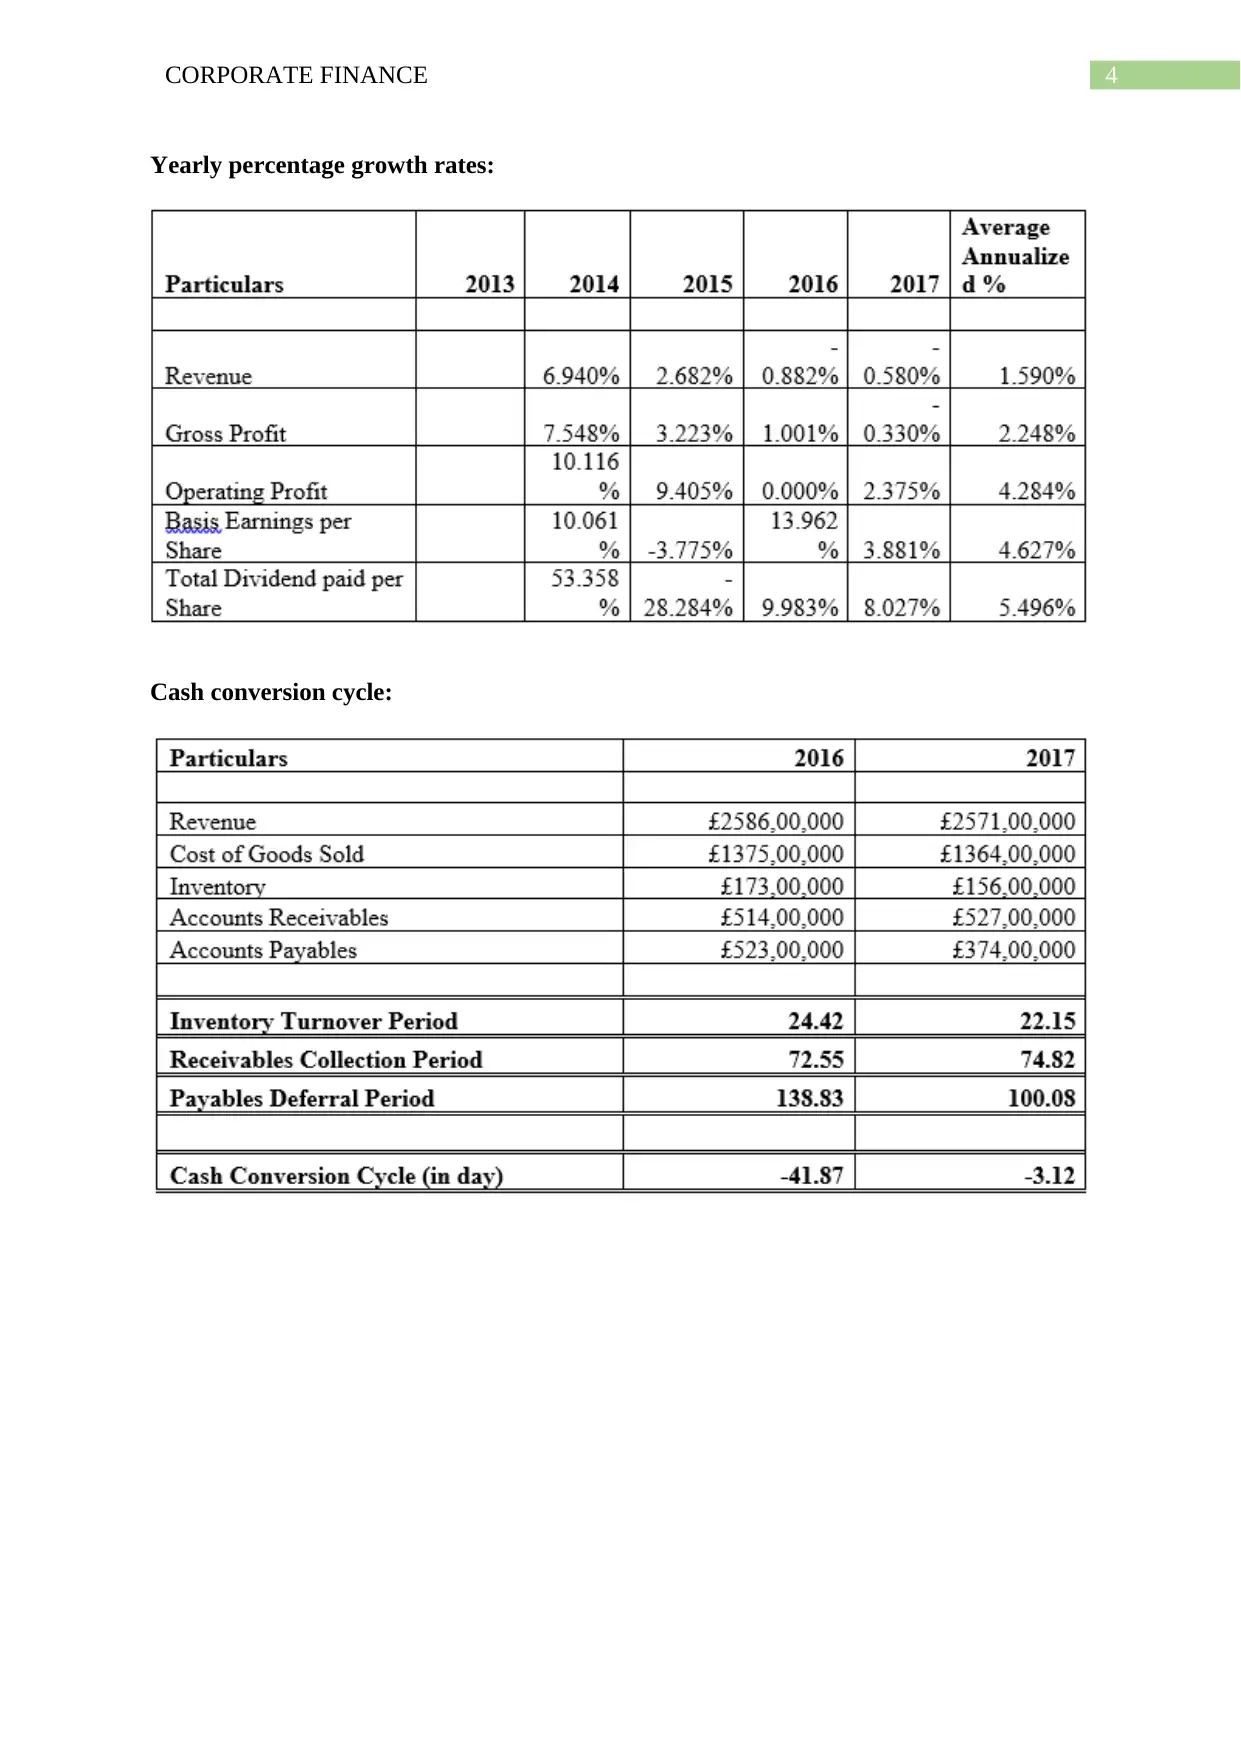
Yearly percentage growth rates:
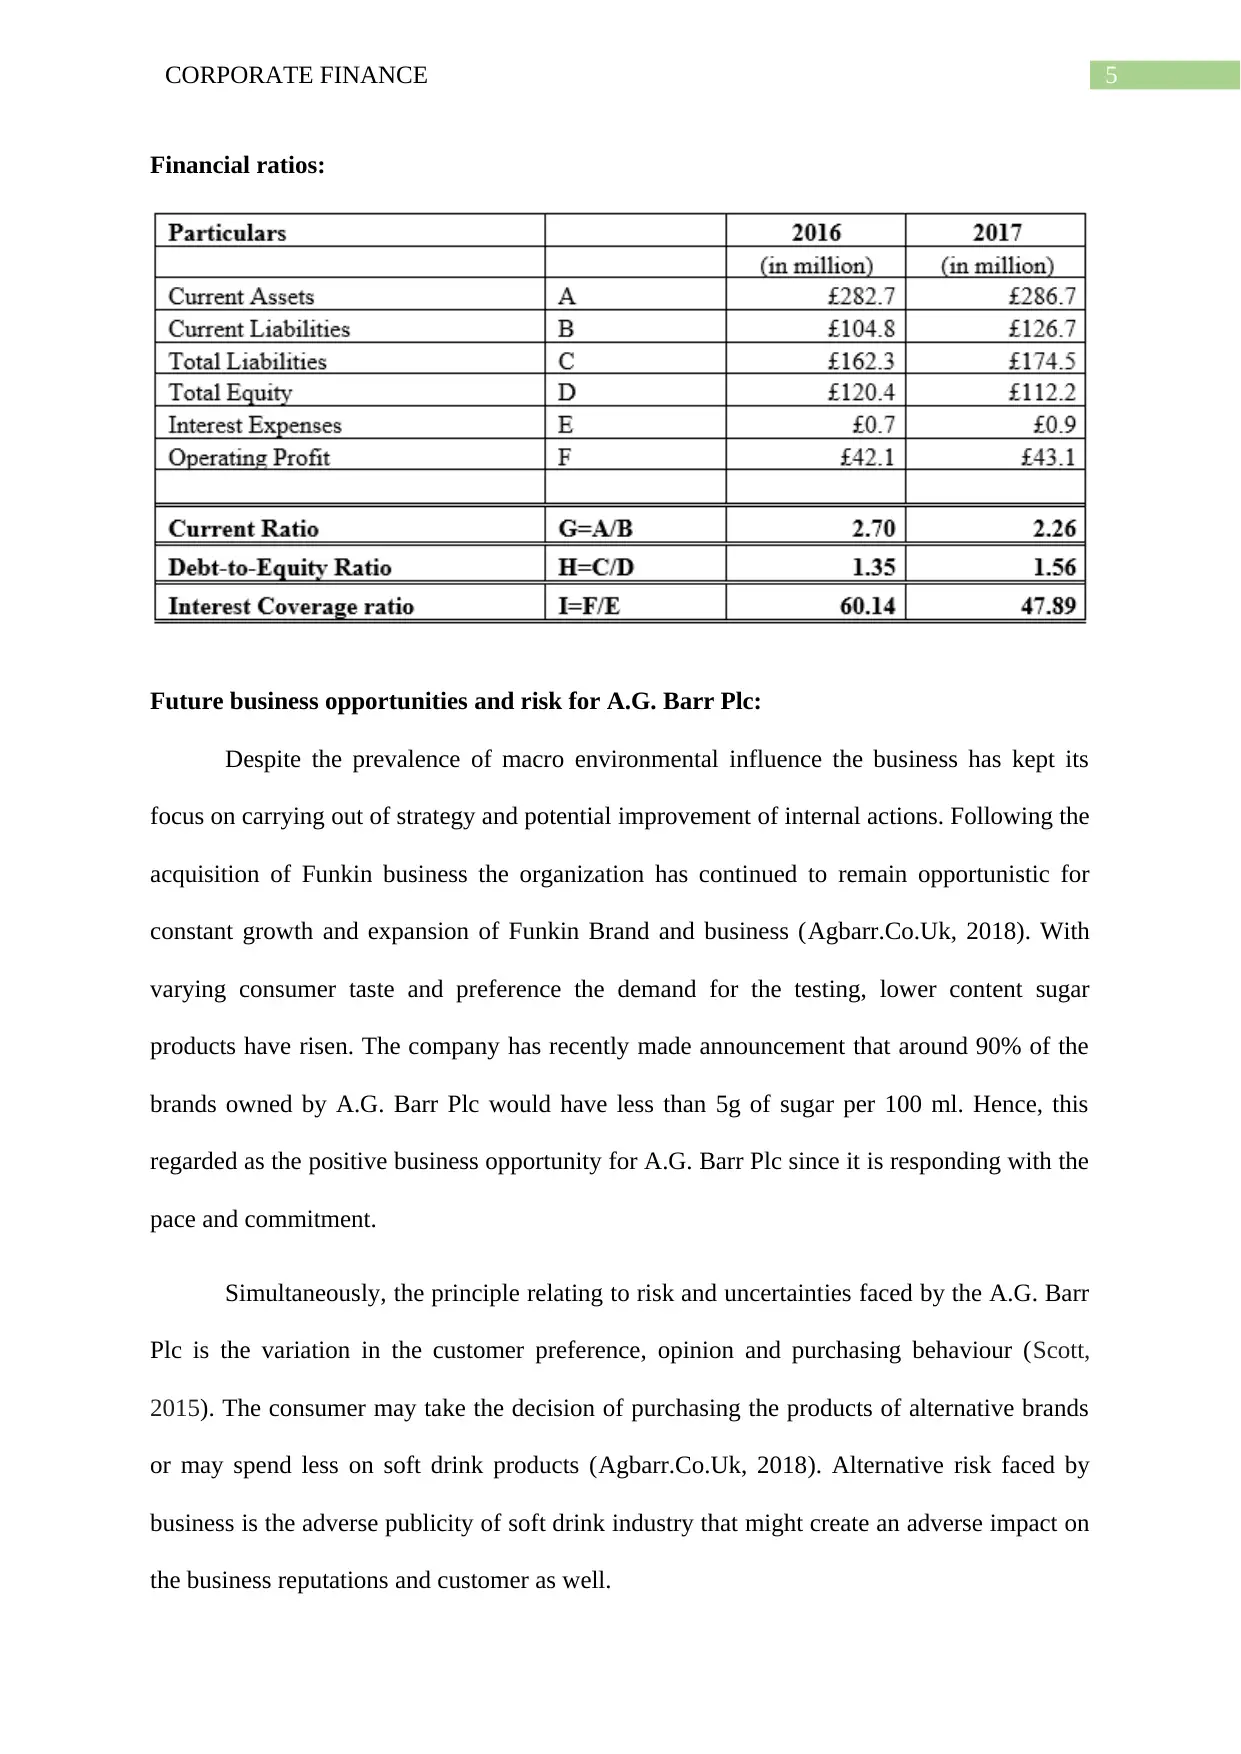
Cash conversion cycle:
Yearly percentage growth rates:
Cash conversion cycle:
5CORPORATE FINANCE
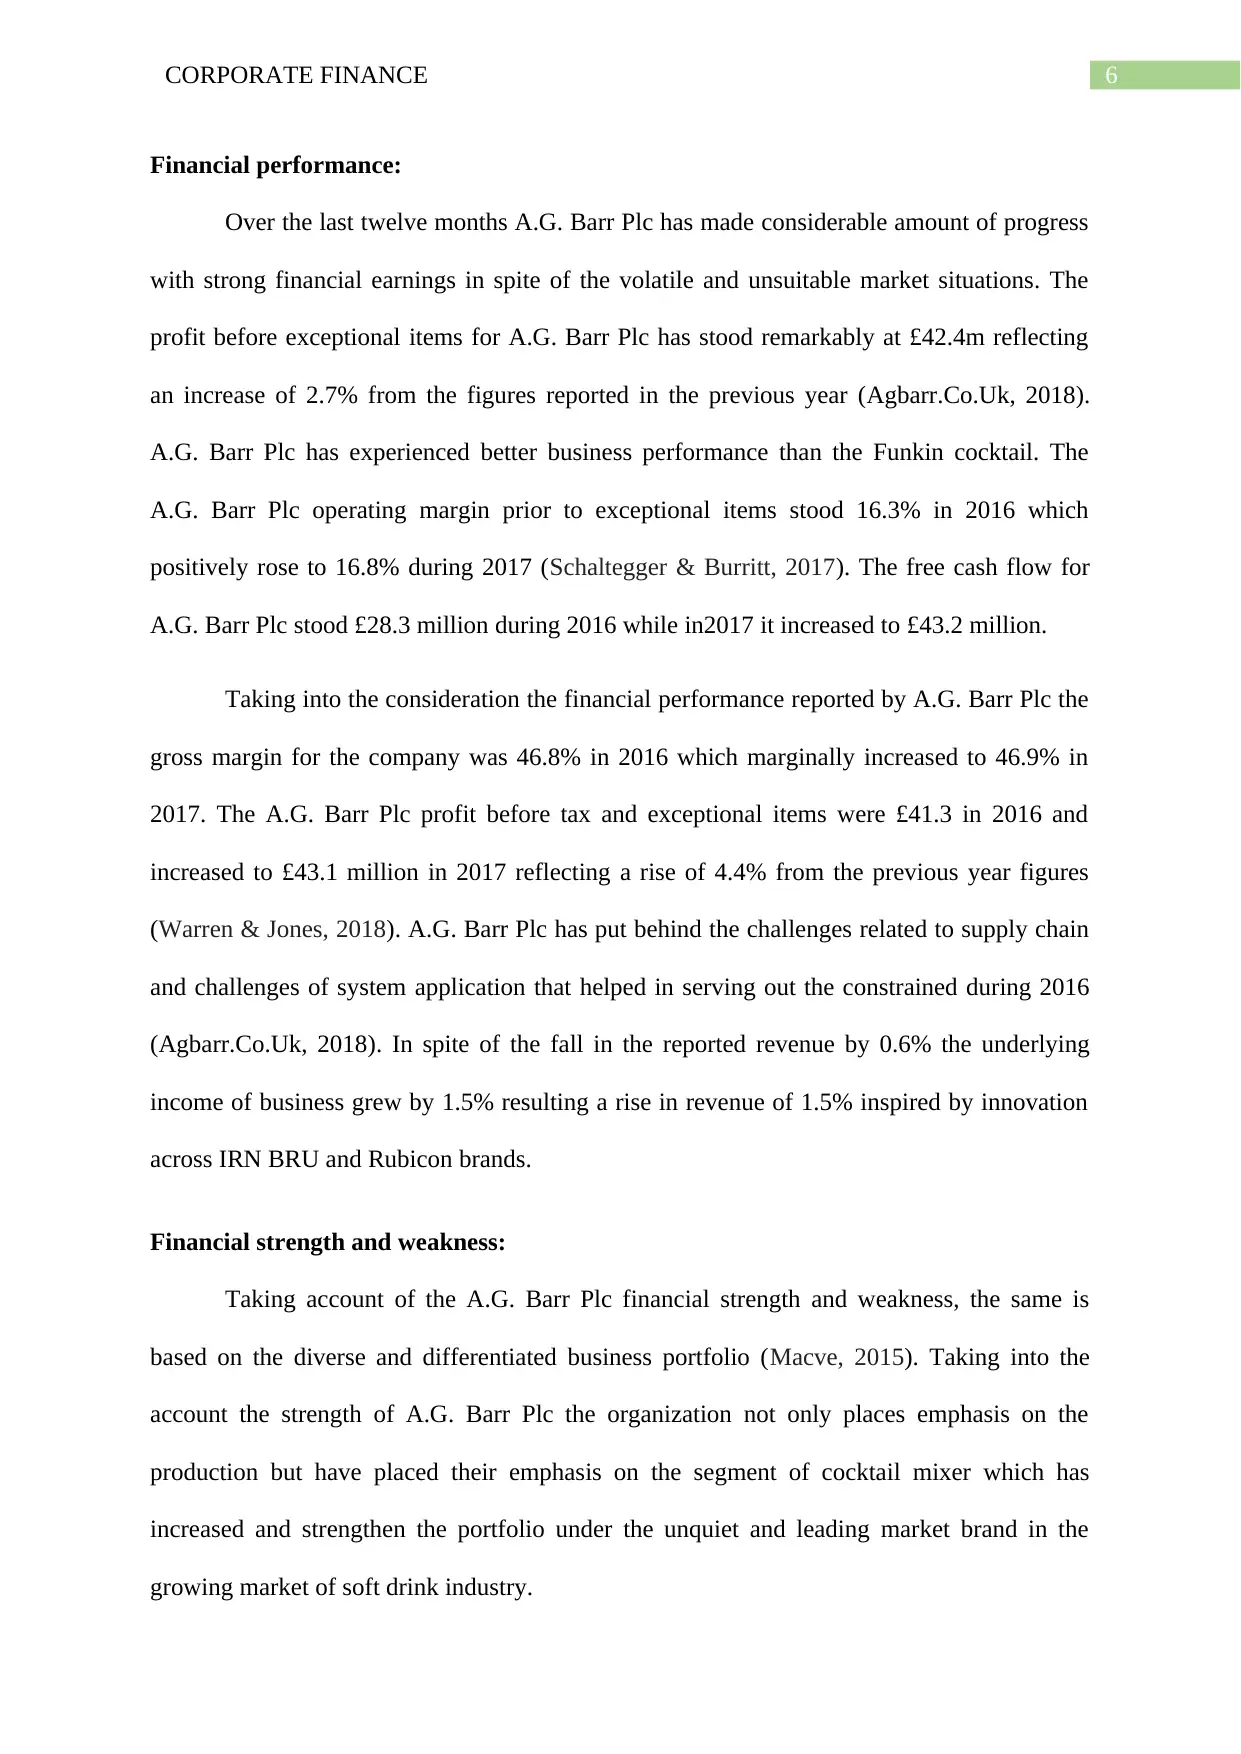
Financial ratios:
Future business opportunities and risk for A.G. Barr Plc:
Despite the prevalence of macro environmental influence the business has kept its
focus on carrying out of strategy and potential improvement of internal actions. Following the
acquisition of Funkin business the organization has continued to remain opportunistic for
constant growth and expansion of Funkin Brand and business (Agbarr.Co.Uk, 2018). With
varying consumer taste and preference the demand for the testing, lower content sugar
products have risen. The company has recently made announcement that around 90% of the
brands owned by A.G. Barr Plc would have less than 5g of sugar per 100 ml. Hence, this
regarded as the positive business opportunity for A.G. Barr Plc since it is responding with the
pace and commitment.
Simultaneously, the principle relating to risk and uncertainties faced by the A.G. Barr
Plc is the variation in the customer preference, opinion and purchasing behaviour (Scott,
2015). The consumer may take the decision of purchasing the products of alternative brands
or may spend less on soft drink products (Agbarr.Co.Uk, 2018). Alternative risk faced by
business is the adverse publicity of soft drink industry that might create an adverse impact on
the business reputations and customer as well.
⊘ This is a preview!⊘
Do you want full access?
Subscribe today to unlock all pages.
Trusted by 1+ million students worldwide
6CORPORATE FINANCE
Financial performance:
Over the last twelve months A.G. Barr Plc has made considerable amount of progress
with strong financial earnings in spite of the volatile and unsuitable market situations. The
profit before exceptional items for A.G. Barr Plc has stood remarkably at £42.4m reflecting
an increase of 2.7% from the figures reported in the previous year (Agbarr.Co.Uk, 2018).
A.G. Barr Plc has experienced better business performance than the Funkin cocktail. The
A.G. Barr Plc operating margin prior to exceptional items stood 16.3% in 2016 which
positively rose to 16.8% during 2017 (Schaltegger & Burritt, 2017). The free cash flow for
A.G. Barr Plc stood £28.3 million during 2016 while in2017 it increased to £43.2 million.
Taking into the consideration the financial performance reported by A.G. Barr Plc the
gross margin for the company was 46.8% in 2016 which marginally increased to 46.9% in
2017. The A.G. Barr Plc profit before tax and exceptional items were £41.3 in 2016 and
increased to £43.1 million in 2017 reflecting a rise of 4.4% from the previous year figures
(Warren & Jones, 2018). A.G. Barr Plc has put behind the challenges related to supply chain
and challenges of system application that helped in serving out the constrained during 2016
(Agbarr.Co.Uk, 2018). In spite of the fall in the reported revenue by 0.6% the underlying
income of business grew by 1.5% resulting a rise in revenue of 1.5% inspired by innovation
across IRN BRU and Rubicon brands.
Financial strength and weakness:
Taking account of the A.G. Barr Plc financial strength and weakness, the same is
based on the diverse and differentiated business portfolio (Macve, 2015). Taking into the
account the strength of A.G. Barr Plc the organization not only places emphasis on the
production but have placed their emphasis on the segment of cocktail mixer which has
increased and strengthen the portfolio under the unquiet and leading market brand in the
growing market of soft drink industry.
Paraphrase This Document
Need a fresh take? Get an instant paraphrase of this document with our AI Paraphraser
7CORPORATE FINANCE
One more business strength for A.G. Barr Plc is the robust balance sheet and cash
derived by the firm (Agbarr.Co.Uk, 2018). This has resulted the board to undertake the
decision of returning the £30 million to its shareholders with the help of share repurchase
programme. Additionally, A.G. Barr Plc has dedicated set of people which have immensely
contributed to the success of the business.
The increasing growth reported by A.G. Barr Plc in the net asset have led the balance
sheet of the firm to significantly gain strength (Trotman et al., 2015). The strong balance
sheet has empowered the business to gain access of the cost effective and flexible facilities of
debt to make sure that the A.G. Barr Plc possess the agility of benefiting from the
opportunities that is recognized.
A.G. Barr Plc has strong structure of risk management of assessing the risk. The
framework of risk management lay down the systematic approach of managing the risk
(Waegenaere et al., 2015). A.G. Barr Plc strength is bestowed in the re-evaluation of risk by
modifying the range of brands of offered. A.G. Barr Plc offers its consumers with the range
of products from numerous brands across wide variety of business channels and customers.
There are certain weakness and failure recognized in the financial year. A.G. Barr Plc
faces the weakness in maintaining appropriate customer relationships. As a result of this,
A.G. Barr Plc may face the problem of reduced customer base which may create an adverse
impact on the sales with fall in operating profit as well (Carlon et al., 2015). Furthermore,
another weakness that is identified for A.G. Barr Plc is the failure in protecting the
intellectual property rights of the company. The failure of maintaining in appropriate
customer relation and intellectual property rights may result in loss of brand worth.
Evidences from the analysis represents that the company reported a current ratio of
2.70 in 2016 which subsequently declined to 2.36. Furthermore the debt to equity ratio of
8CORPORATE FINANCE
A.G. Barr Plc has stood 1.35 during 2016 which relatively increased to 1.56 during the year
2017 (Kahng, 2016). The situation defines that A.G. Barr Plc took higher debt and this may
potentially lead to rise in the operational risk of A.G. Barr Plc.
Efficiency Market Hypothesis:
Stock Market Pricing Efficiency in A.G. Barr Plc Share Price:
The efficient market hypothesis is viewed as the investment theory which states that it
is not probable to beat down the market since the stock market efficiency reflects the price of
share to incorporate and reflect the essential information. It is noticed that the recent
application of sugar tax in UK is regarded as the semi-strong information (Damodaran,
2016). Stocks are traded constantly at the fair value on stock exchange which is not possible
for the investors either purchase the undervalued stocks or sell the stocks at higher price. The
government measure of announcing the sugar tax can be considered as the semi-strong
measure since the information derived to forecast the performance of stock might be
highlighted in the stock price.
The information concerning the higher tax on sugar might enable the organizations to
quicken the long awaited sugar soft drink programme. Therefore, this would result the firm in
capitalizing on the price trends of the securities trending in the market. The main reason for
the variation in the share price of A.G. Barr Plc is arrival of new information. As a result of
this, the present prices of shares offers all the required information from the outside sources
and subsequently there are hardly any reason to believe that the share price are very high or
very low (Ang, 2018). Concerning the A.G. Barr Plc, the new information relating to sugar
tax can be viewed as the prevalence of efficient market for the investors to gain profit from
the new information.
⊘ This is a preview!⊘
Do you want full access?
Subscribe today to unlock all pages.
Trusted by 1+ million students worldwide
9CORPORATE FINANCE
Semi strong market form of market efficiency:
Under the efficient market hypothesis semi strong form of efficiency means that all the
necessary public information has been taken account in determining the current share price.
Therefore, neither the technical nor the fundamental analysis can be implemented to obtain
higher gains (Fracassi, 2016). Under the semi-strong forms of market efficiency information
provided is based on the public available benefits which the investors are looking to earn
from the abnormal returns on investment.
As evident in the circumstances of of A.G.Barr Plc the government action of applying
sugar tax suggest that the information relates to the assistance of the investors to derive
abnormal return on investment (Ehrhardt & Brigham, 2016). The information that is derived
for A.G.Barr Plc is considered in stock price and resulting in semi-strong classification of
stock price as the information that is obtained is through the outside sources. Therefore, the
investors that are looking for abnormal return on their investment can derive benefit from the
stock of of A.G.Barr Plc.
Valuation:
Paraphrase This Document
Need a fresh take? Get an instant paraphrase of this document with our AI Paraphraser
10CORPORATE FINANCE
Dividend discount Model:
Justification and description of assumptions:
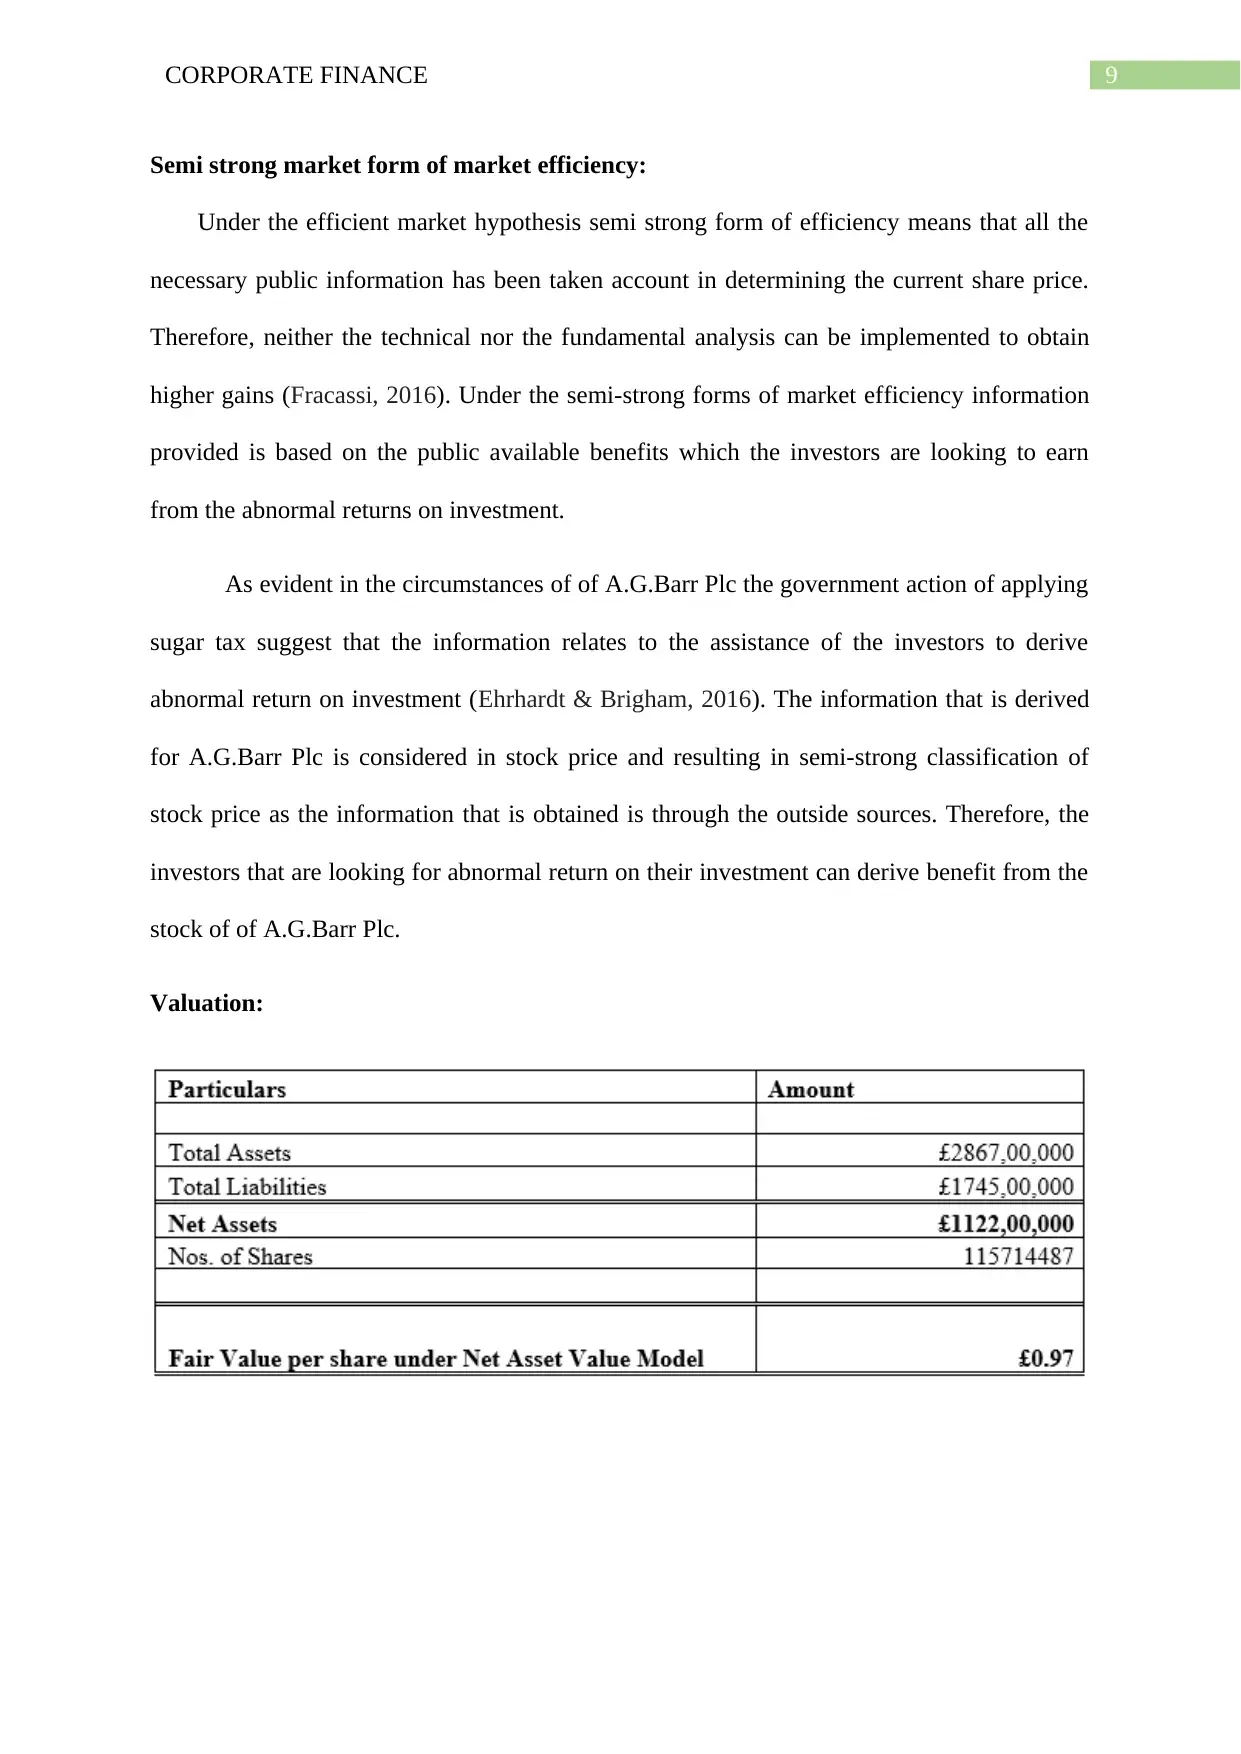
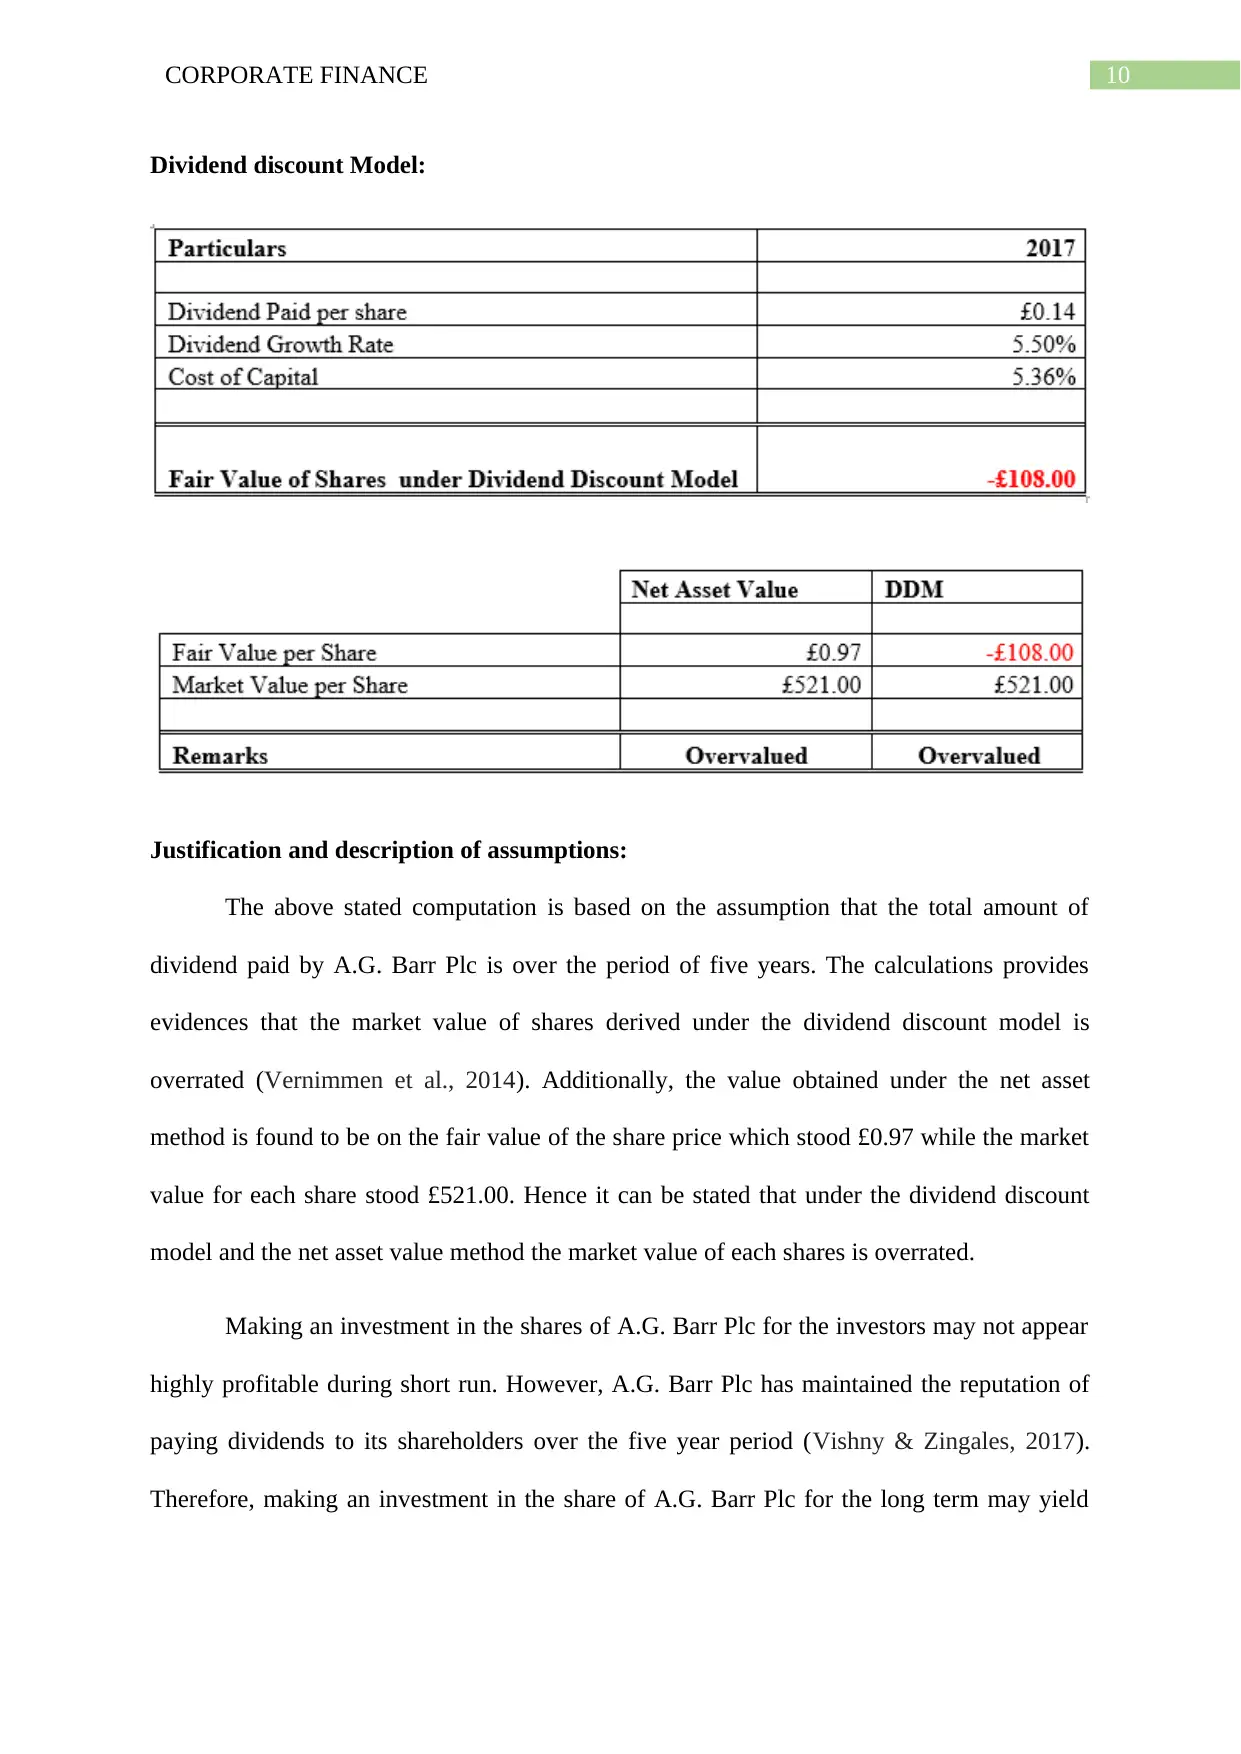
The above stated computation is based on the assumption that the total amount of
dividend paid by A.G. Barr Plc is over the period of five years. The calculations provides
evidences that the market value of shares derived under the dividend discount model is
overrated (Vernimmen et al., 2014). Additionally, the value obtained under the net asset
method is found to be on the fair value of the share price which stood £0.97 while the market
value for each share stood £521.00. Hence it can be stated that under the dividend discount
model and the net asset value method the market value of each shares is overrated.
Making an investment in the shares of A.G. Barr Plc for the investors may not appear
highly profitable during short run. However, A.G. Barr Plc has maintained the reputation of
paying dividends to its shareholders over the five year period (Vishny & Zingales, 2017).
Therefore, making an investment in the share of A.G. Barr Plc for the long term may yield
Dividend discount Model:
Justification and description of assumptions:
The above stated computation is based on the assumption that the total amount of
dividend paid by A.G. Barr Plc is over the period of five years. The calculations provides
evidences that the market value of shares derived under the dividend discount model is
overrated (Vernimmen et al., 2014). Additionally, the value obtained under the net asset
method is found to be on the fair value of the share price which stood £0.97 while the market
value for each share stood £521.00. Hence it can be stated that under the dividend discount
model and the net asset value method the market value of each shares is overrated.
Making an investment in the shares of A.G. Barr Plc for the investors may not appear
highly profitable during short run. However, A.G. Barr Plc has maintained the reputation of
paying dividends to its shareholders over the five year period (Vishny & Zingales, 2017).
Therefore, making an investment in the share of A.G. Barr Plc for the long term may yield
11CORPORATE FINANCE
sufficient amount of benefit for the shareholders under food and beverage industry while
other market players have paid higher dividends to its shareholders.
Usefulness and limitations of valuation methods:
Valuation of stock under the dividend discount model is viewed as the useful method
based on the notion that stock of the organization holds the worth in respect to all the sum
value of future dividend payments (Titman et al., 2017). To determine the intrinsic value of
stock the dividend discount model is regarded useful since it excludes the present value
conditions. The model is helpful in determining the current value of shares and future
dividend payments.
The net asset value method on the other hand is regarded as the useful tool of business
valuation that places emphasis on the organization net asset or the fair market value of the
total assets following the subtraction of total liabilities (Gitman et al., 2015). The net asset
method is best suited in determining the financial picture of the organization from the
information presented in the balance sheet.
Taking account of the limitation of dividend discount model, the model fails to
account the non-dividend factors namely the brand loyalty and the proportion of the
intangible assets. Since these components increases the value of the organization (Barberis et
al., 2015). Additionally, the model is based on the assumption that rate of growth is constant
and stable. These assumptions hardly exists in the modern world.
The net asset value simultaneously is regarded as the difficult method of determining
the value of intangible assets particularly the property rights (Lazzati & Menichini, 2015).
Additionally, the statement of financial position may prematurely value the assets because of
the existence of depreciation.
⊘ This is a preview!⊘
Do you want full access?
Subscribe today to unlock all pages.
Trusted by 1+ million students worldwide
1 out of 18
Related Documents


Your All-in-One AI-Powered Toolkit for Academic Success.
+13062052269
info@desklib.com
Available 24*7 on WhatsApp / Email
![[object Object]](/_next/static/media/star-bottom.7253800d.svg)
Unlock your academic potential
Copyright © 2020–2026 A2Z Services. All Rights Reserved. Developed and managed by ZUCOL.