ACC210 - Management Accounting: Budgeting, Costing and Performance
VerifiedAdded on 2023/06/13
|17
|3521
|466
Report
AI Summary
This management accounting report provides a detailed analysis of various concepts and applications, including manufacturing cost flows, international issues in management accounting, and comprehensive manufacturing budgets. It covers topics such as the advantages of Australian dairy products in China, differences in Western and Chinese approaches to management accounting, and the concepts of Guanxi and power distance. The report includes a five-year budget analysis, an evaluation of increased production constraints, and a report to the CEO on project opportunities and risks. Furthermore, it distinguishes between variable and fixed costs, product and period costs, and discusses the relevant range concept. The report also features a strategic management accounting case study, including a before-and-after budget comparison and an ethics case study, offering advice and recommended actions. Students can find similar assignments and study resources on Desklib.
MANAGEMENT ACCOUNTING
Management accounting
Name of the student
Name of the university
Student ID
Author note
Management accounting
Name of the student
Name of the university
Student ID
Author note
Paraphrase This Document
Need a fresh take? Get an instant paraphrase of this document with our AI Paraphraser
1MANAGEMENT ACCOUNTING
Table of Contents
Question 1..................................................................................................................................2
Manufacturing cost flows.......................................................................................................2
Question 2..................................................................................................................................3
International issues in management account..........................................................................3
(i) Advantage of Australian dairy product in China............................................................3
(ii) Difference in western and Chinese approaches of management accounting..............4
(iii) Concepts of Guanxi and power distance.....................................................................4
Question 3..................................................................................................................................5
Comprehensive manufacturing budget..................................................................................5
(a) Five year budget..........................................................................................................5
(b) Increased production constraint...................................................................................7
(c) Report to CEO.............................................................................................................7
Question 4..................................................................................................................................8
(i) Distinguish between variable cost and fixed cost and product cost and period cost......8
(ii) Relevant range...........................................................................................................10
Question 5................................................................................................................................10
Strategic Management Accounting case study....................................................................10
(i) Before and after budget comparison.............................................................................10
(ii) Drop in sales for the competitor Death Star manufacturing......................................11
(iii) Report........................................................................................................................12

2MANAGEMENT ACCOUNTING
Question 5................................................................................................................................12
Ethics case study..................................................................................................................12
(i) Advice to Burdon..........................................................................................................12
(ii) Recommended actions for Burdon............................................................................13
Reference..................................................................................................................................14
⊘ This is a preview!⊘
Do you want full access?
Subscribe today to unlock all pages.
Trusted by 1+ million students worldwide
3MANAGEMENT ACCOUNTING
Question 1
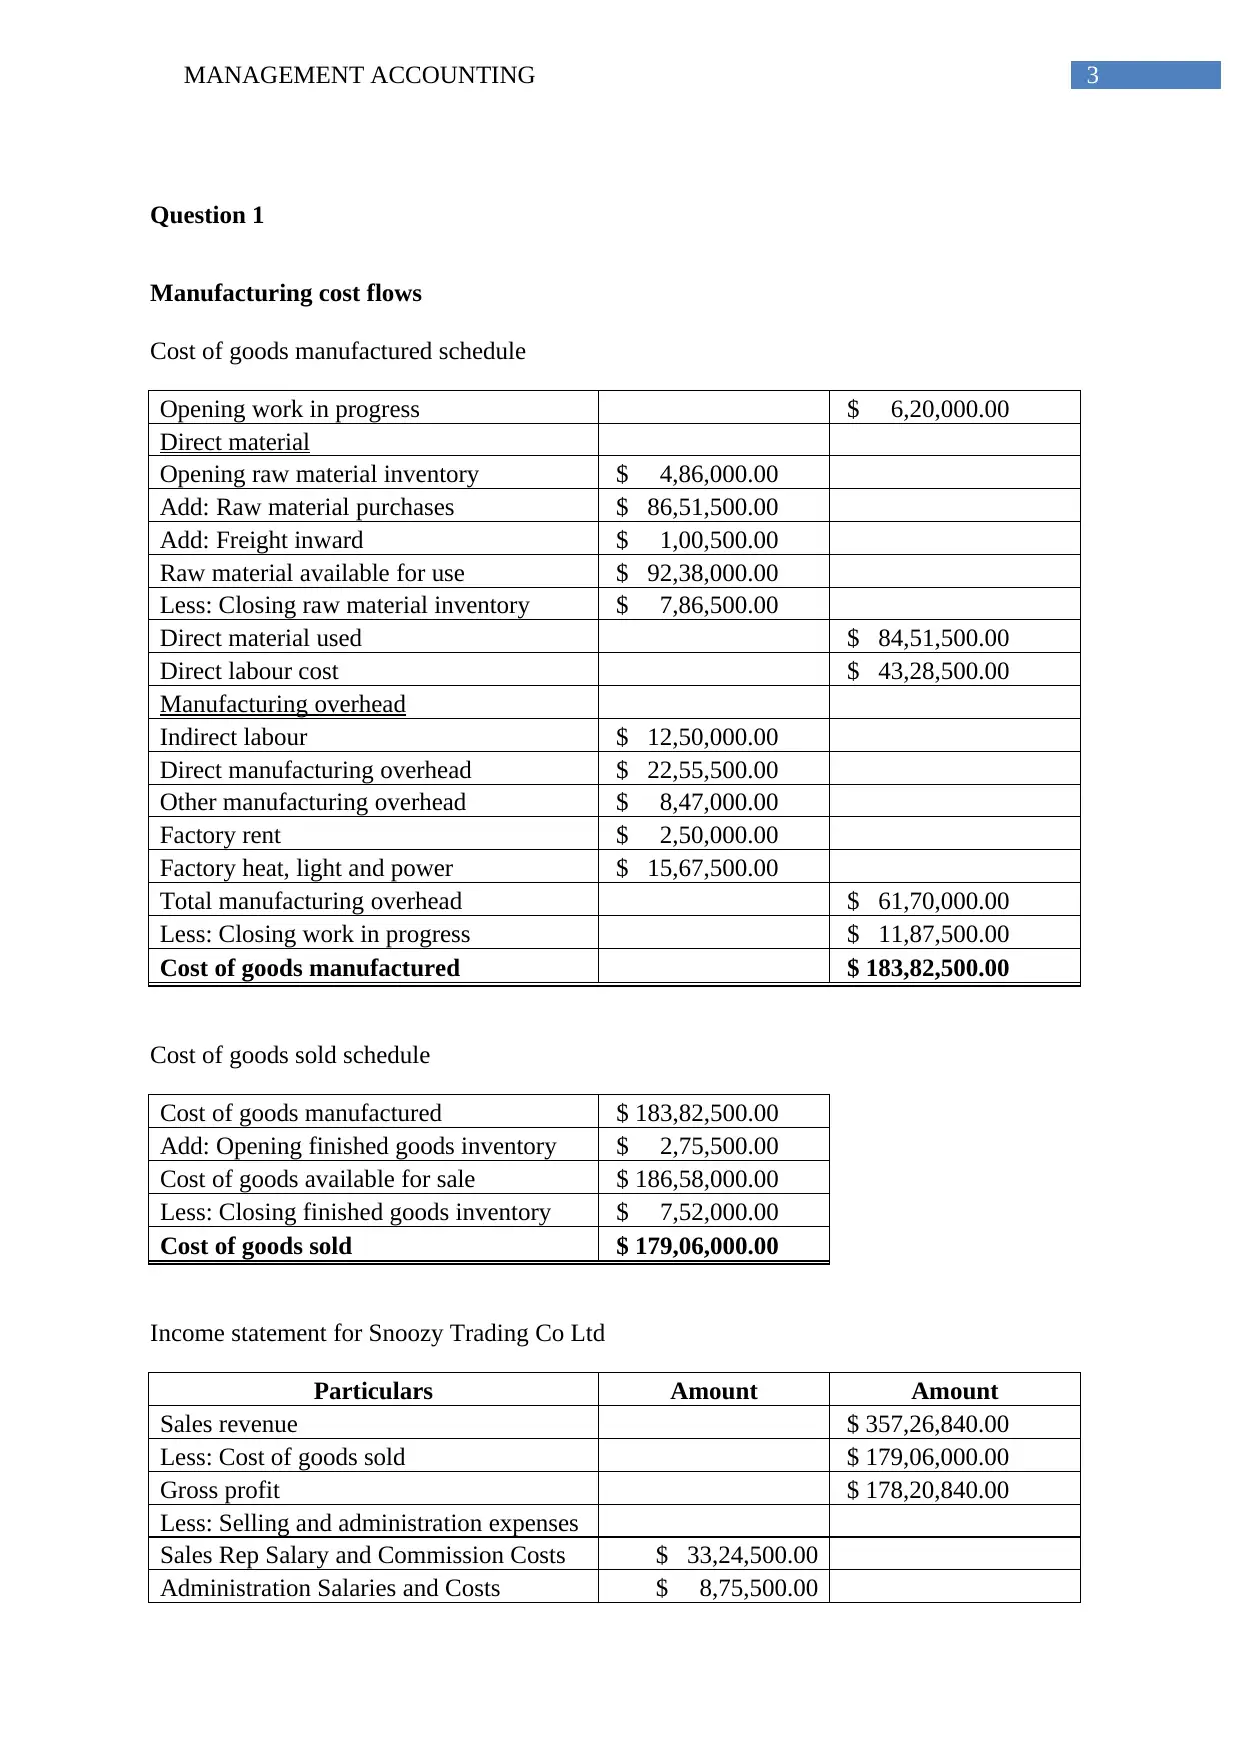
Manufacturing cost flows
Cost of goods manufactured schedule
Opening work in progress $ 6,20,000.00
Direct material
Opening raw material inventory $ 4,86,000.00
Add: Raw material purchases $ 86,51,500.00
Add: Freight inward $ 1,00,500.00
Raw material available for use $ 92,38,000.00
Less: Closing raw material inventory $ 7,86,500.00
Direct material used $ 84,51,500.00
Direct labour cost $ 43,28,500.00
Manufacturing overhead
Indirect labour $ 12,50,000.00
Direct manufacturing overhead $ 22,55,500.00
Other manufacturing overhead $ 8,47,000.00
Factory rent $ 2,50,000.00
Factory heat, light and power $ 15,67,500.00
Total manufacturing overhead $ 61,70,000.00
Less: Closing work in progress $ 11,87,500.00
Cost of goods manufactured $ 183,82,500.00
Cost of goods sold schedule
Cost of goods manufactured $ 183,82,500.00
Add: Opening finished goods inventory $ 2,75,500.00
Cost of goods available for sale $ 186,58,000.00
Less: Closing finished goods inventory $ 7,52,000.00
Cost of goods sold $ 179,06,000.00
Income statement for Snoozy Trading Co Ltd
Particulars Amount Amount
Sales revenue $ 357,26,840.00
Less: Cost of goods sold $ 179,06,000.00
Gross profit $ 178,20,840.00
Less: Selling and administration expenses
Sales Rep Salary and Commission Costs $ 33,24,500.00
Administration Salaries and Costs $ 8,75,500.00
Question 1
Manufacturing cost flows
Cost of goods manufactured schedule
Opening work in progress $ 6,20,000.00
Direct material
Opening raw material inventory $ 4,86,000.00
Add: Raw material purchases $ 86,51,500.00
Add: Freight inward $ 1,00,500.00
Raw material available for use $ 92,38,000.00
Less: Closing raw material inventory $ 7,86,500.00
Direct material used $ 84,51,500.00
Direct labour cost $ 43,28,500.00
Manufacturing overhead
Indirect labour $ 12,50,000.00
Direct manufacturing overhead $ 22,55,500.00
Other manufacturing overhead $ 8,47,000.00
Factory rent $ 2,50,000.00
Factory heat, light and power $ 15,67,500.00
Total manufacturing overhead $ 61,70,000.00
Less: Closing work in progress $ 11,87,500.00
Cost of goods manufactured $ 183,82,500.00
Cost of goods sold schedule
Cost of goods manufactured $ 183,82,500.00
Add: Opening finished goods inventory $ 2,75,500.00
Cost of goods available for sale $ 186,58,000.00
Less: Closing finished goods inventory $ 7,52,000.00
Cost of goods sold $ 179,06,000.00
Income statement for Snoozy Trading Co Ltd
Particulars Amount Amount
Sales revenue $ 357,26,840.00
Less: Cost of goods sold $ 179,06,000.00
Gross profit $ 178,20,840.00
Less: Selling and administration expenses
Sales Rep Salary and Commission Costs $ 33,24,500.00
Administration Salaries and Costs $ 8,75,500.00
Paraphrase This Document
Need a fresh take? Get an instant paraphrase of this document with our AI Paraphraser
4MANAGEMENT ACCOUNTING
Accounting and audit costs $ 1,50,000.00
Sales & marketing expenses $ 8,71,500.00
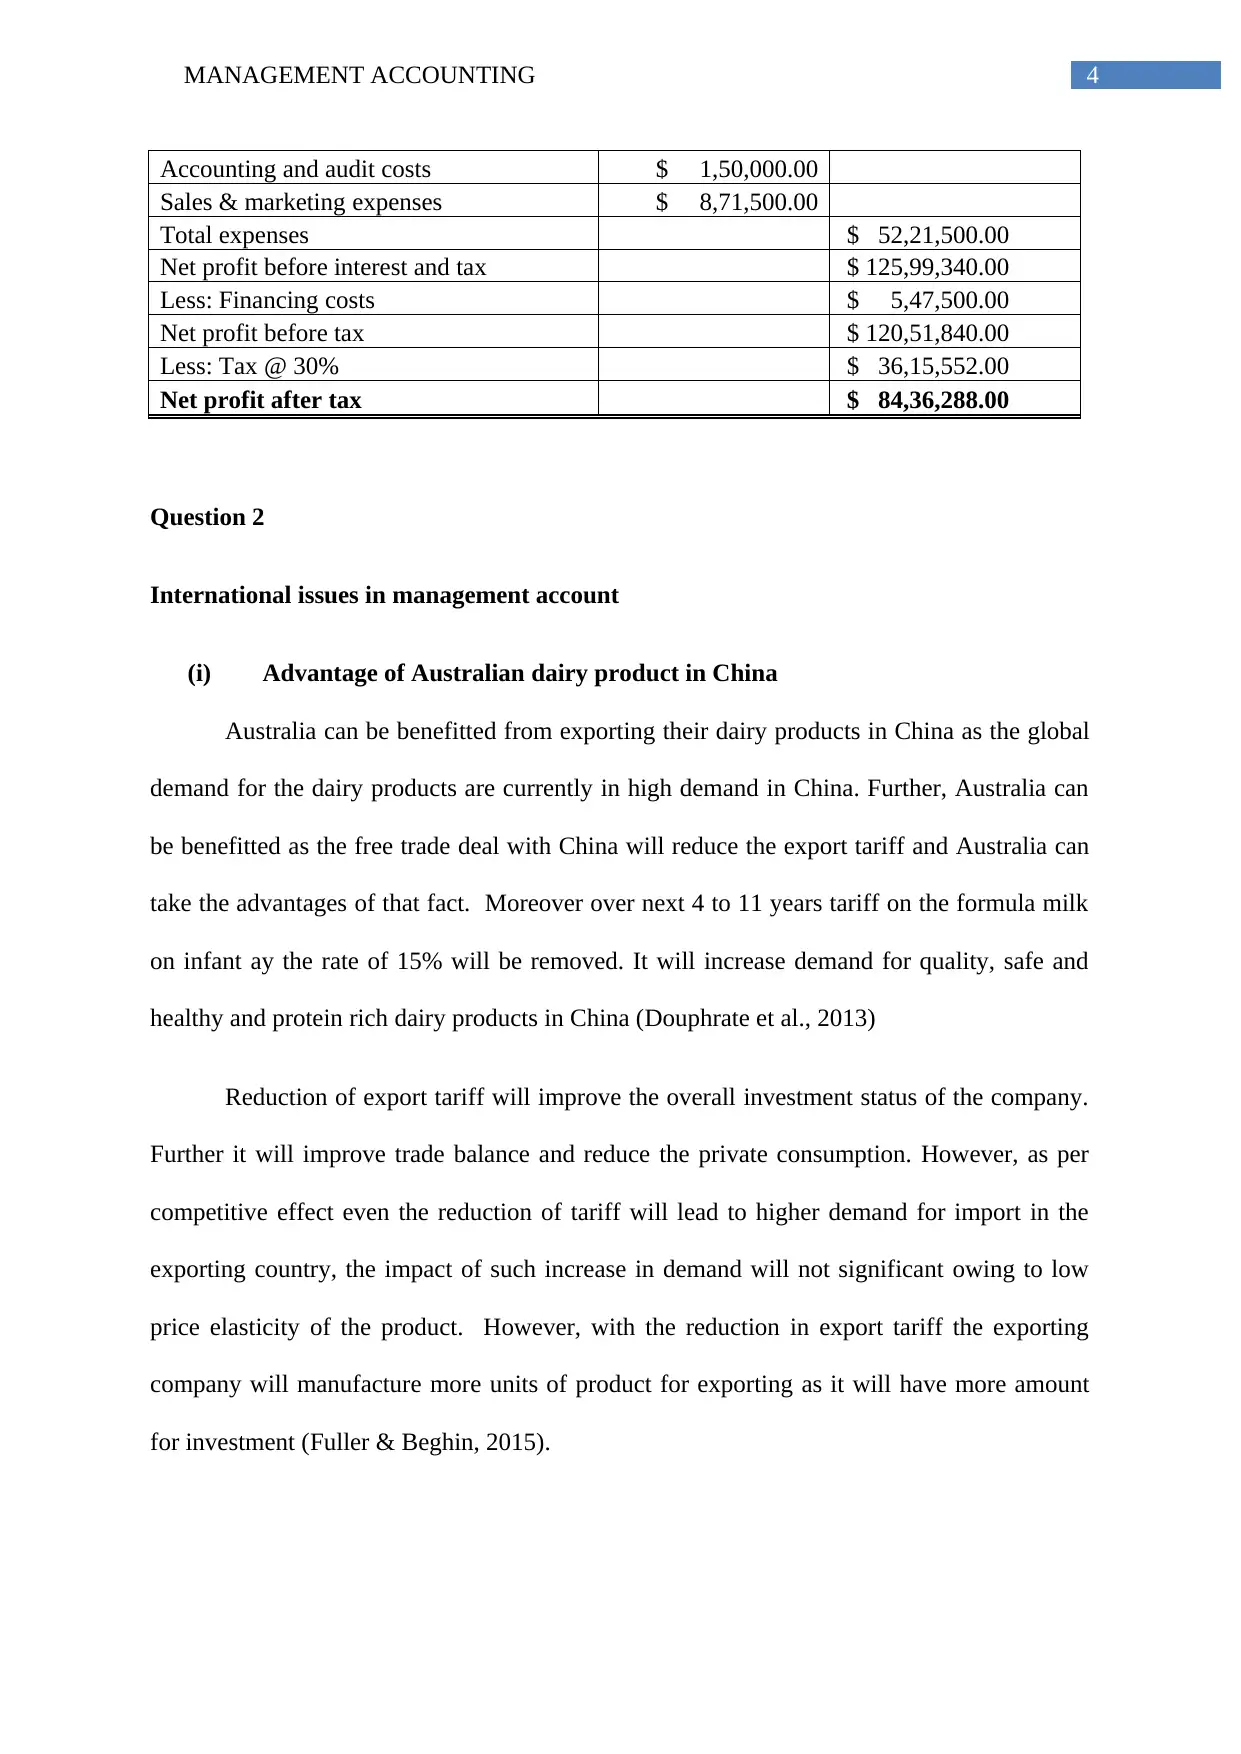
Total expenses $ 52,21,500.00
Net profit before interest and tax $ 125,99,340.00
Less: Financing costs $ 5,47,500.00
Net profit before tax $ 120,51,840.00
Less: Tax @ 30% $ 36,15,552.00
Net profit after tax $ 84,36,288.00
Question 2
International issues in management account
(i) Advantage of Australian dairy product in China
Australia can be benefitted from exporting their dairy products in China as the global
demand for the dairy products are currently in high demand in China. Further, Australia can
be benefitted as the free trade deal with China will reduce the export tariff and Australia can
take the advantages of that fact. Moreover over next 4 to 11 years tariff on the formula milk
on infant ay the rate of 15% will be removed. It will increase demand for quality, safe and
healthy and protein rich dairy products in China (Douphrate et al., 2013)
Reduction of export tariff will improve the overall investment status of the company.
Further it will improve trade balance and reduce the private consumption. However, as per
competitive effect even the reduction of tariff will lead to higher demand for import in the
exporting country, the impact of such increase in demand will not significant owing to low
price elasticity of the product. However, with the reduction in export tariff the exporting
company will manufacture more units of product for exporting as it will have more amount
for investment (Fuller & Beghin, 2015).
Accounting and audit costs $ 1,50,000.00
Sales & marketing expenses $ 8,71,500.00
Total expenses $ 52,21,500.00
Net profit before interest and tax $ 125,99,340.00
Less: Financing costs $ 5,47,500.00
Net profit before tax $ 120,51,840.00
Less: Tax @ 30% $ 36,15,552.00
Net profit after tax $ 84,36,288.00
Question 2
International issues in management account
(i) Advantage of Australian dairy product in China
Australia can be benefitted from exporting their dairy products in China as the global
demand for the dairy products are currently in high demand in China. Further, Australia can
be benefitted as the free trade deal with China will reduce the export tariff and Australia can
take the advantages of that fact. Moreover over next 4 to 11 years tariff on the formula milk
on infant ay the rate of 15% will be removed. It will increase demand for quality, safe and
healthy and protein rich dairy products in China (Douphrate et al., 2013)
Reduction of export tariff will improve the overall investment status of the company.
Further it will improve trade balance and reduce the private consumption. However, as per
competitive effect even the reduction of tariff will lead to higher demand for import in the
exporting country, the impact of such increase in demand will not significant owing to low
price elasticity of the product. However, with the reduction in export tariff the exporting
company will manufacture more units of product for exporting as it will have more amount
for investment (Fuller & Beghin, 2015).
5MANAGEMENT ACCOUNTING
(ii) Difference in western and Chinese approaches of management accounting
In China the system of management accounting is developing for the last 3 decades
and it is among the other fields that is undergoing rapid changes. Concepts of western
management accounting have been in practice in China from 1970s and since then it is
developing steadily. Generally it is assumed that there is no consistent and comprehensive
theory for management accounting anywhere in the world. Therefore, various discrete
management accounting branches like activity based costing faces various challenges in
application and adoption. It is further difficult while quantifying the information and values
in management accounting for the purpose of strategic management and decision making.
Further, in China the management accounting is not properly emphasized from the firm as
well the government perspectives. Moreover, there are lack of required software for
supporting the calculations and decision making under management accounting.
(iii) Concepts of Guanxi and power distance
Guanxi refers to have strong relationship and personal trust with someone that can
involve exchange of favours and moral obligations. Sometimes it is wrongly perceived under
western business as bordering the unethical behaviour related to corruption. Guanxi is
generally translated as relationship, networks or connections (Kaynak, Wong & Leung,
2013). However, none of the mentioned terms justifies the complex and fundamental concept
of the term and its role in the Chinese culture. The term can also be used to state the network
of contacts that the individual can call while something is required to be done (Luo, 2013).
On the other hand, the term power distance is stated as the extent by which less
powerful members of the institutions and organization expect and accept that the power is
unequally distributed. In Australia power distance is low that is there is no gap among the
wealthy and poor people. On the contrary, power distance in China is at very high level
(Sriramesh, 2013). Therefore, the culture inequalities in Chian are normal and acceptable.
⊘ This is a preview!⊘
Do you want full access?
Subscribe today to unlock all pages.
Trusted by 1+ million students worldwide
6MANAGEMENT ACCOUNTING
They feel more comfortable when the superiors do not waive the power to the subordinates.
On the other hand, the superiors will prefer to take decisions themselves (Hu, Chand &
Evans, 2013).
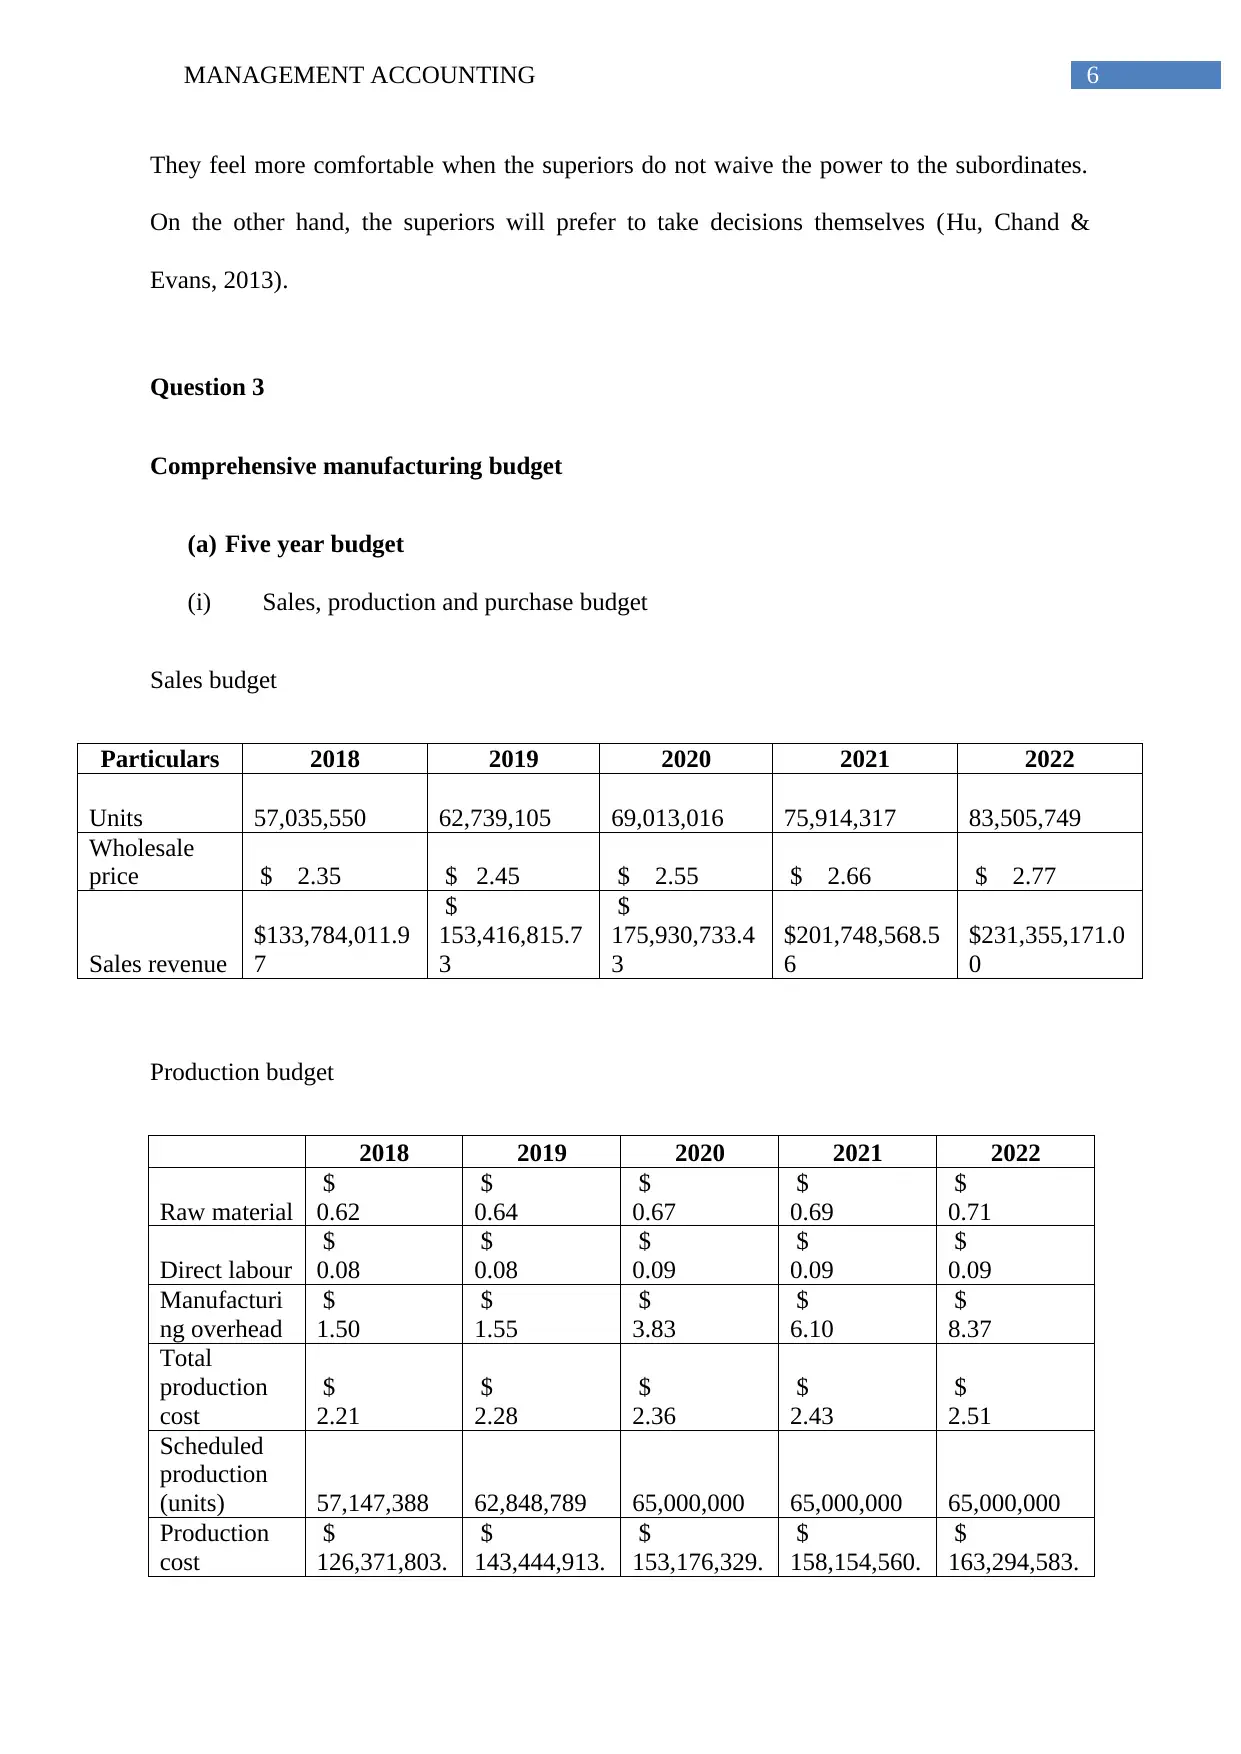
Question 3
Comprehensive manufacturing budget
(a) Five year budget
(i) Sales, production and purchase budget
Sales budget
Particulars 2018 2019 2020 2021 2022
Units 57,035,550 62,739,105 69,013,016 75,914,317 83,505,749
Wholesale
price $ 2.35 $ 2.45 $ 2.55 $ 2.66 $ 2.77
Sales revenue
$133,784,011.9
7
$
153,416,815.7
3
$
175,930,733.4
3
$201,748,568.5
6
$231,355,171.0
0
Production budget
2018 2019 2020 2021 2022
Raw material
$
0.62
$
0.64
$
0.67
$
0.69
$
0.71
Direct labour
$
0.08
$
0.08
$
0.09
$
0.09
$
0.09
Manufacturi
ng overhead
$
1.50
$
1.55
$
3.83
$
6.10
$
8.37
Total
production
cost
$
2.21
$
2.28
$
2.36
$
2.43
$
2.51
Scheduled
production
(units) 57,147,388 62,848,789 65,000,000 65,000,000 65,000,000
Production
cost
$
126,371,803.
$
143,444,913.
$
153,176,329.
$
158,154,560.
$
163,294,583.
They feel more comfortable when the superiors do not waive the power to the subordinates.
On the other hand, the superiors will prefer to take decisions themselves (Hu, Chand &
Evans, 2013).
Question 3
Comprehensive manufacturing budget
(a) Five year budget
(i) Sales, production and purchase budget
Sales budget
Particulars 2018 2019 2020 2021 2022
Units 57,035,550 62,739,105 69,013,016 75,914,317 83,505,749
Wholesale
price $ 2.35 $ 2.45 $ 2.55 $ 2.66 $ 2.77
Sales revenue
$133,784,011.9
7
$
153,416,815.7
3
$
175,930,733.4
3
$201,748,568.5
6
$231,355,171.0
0
Production budget
2018 2019 2020 2021 2022
Raw material
$
0.62
$
0.64
$
0.67
$
0.69
$
0.71
Direct labour
$
0.08
$
0.08
$
0.09
$
0.09
$
0.09
Manufacturi
ng overhead
$
1.50
$
1.55
$
3.83
$
6.10
$
8.37
Total
production
cost
$
2.21
$
2.28
$
2.36
$
2.43
$
2.51
Scheduled
production
(units) 57,147,388 62,848,789 65,000,000 65,000,000 65,000,000
Production
cost
$
126,371,803.
$
143,444,913.
$
153,176,329.
$
158,154,560.
$
163,294,583.
Paraphrase This Document
Need a fresh take? Get an instant paraphrase of this document with our AI Paraphraser
7MANAGEMENT ACCOUNTING
83 72 47 18 38
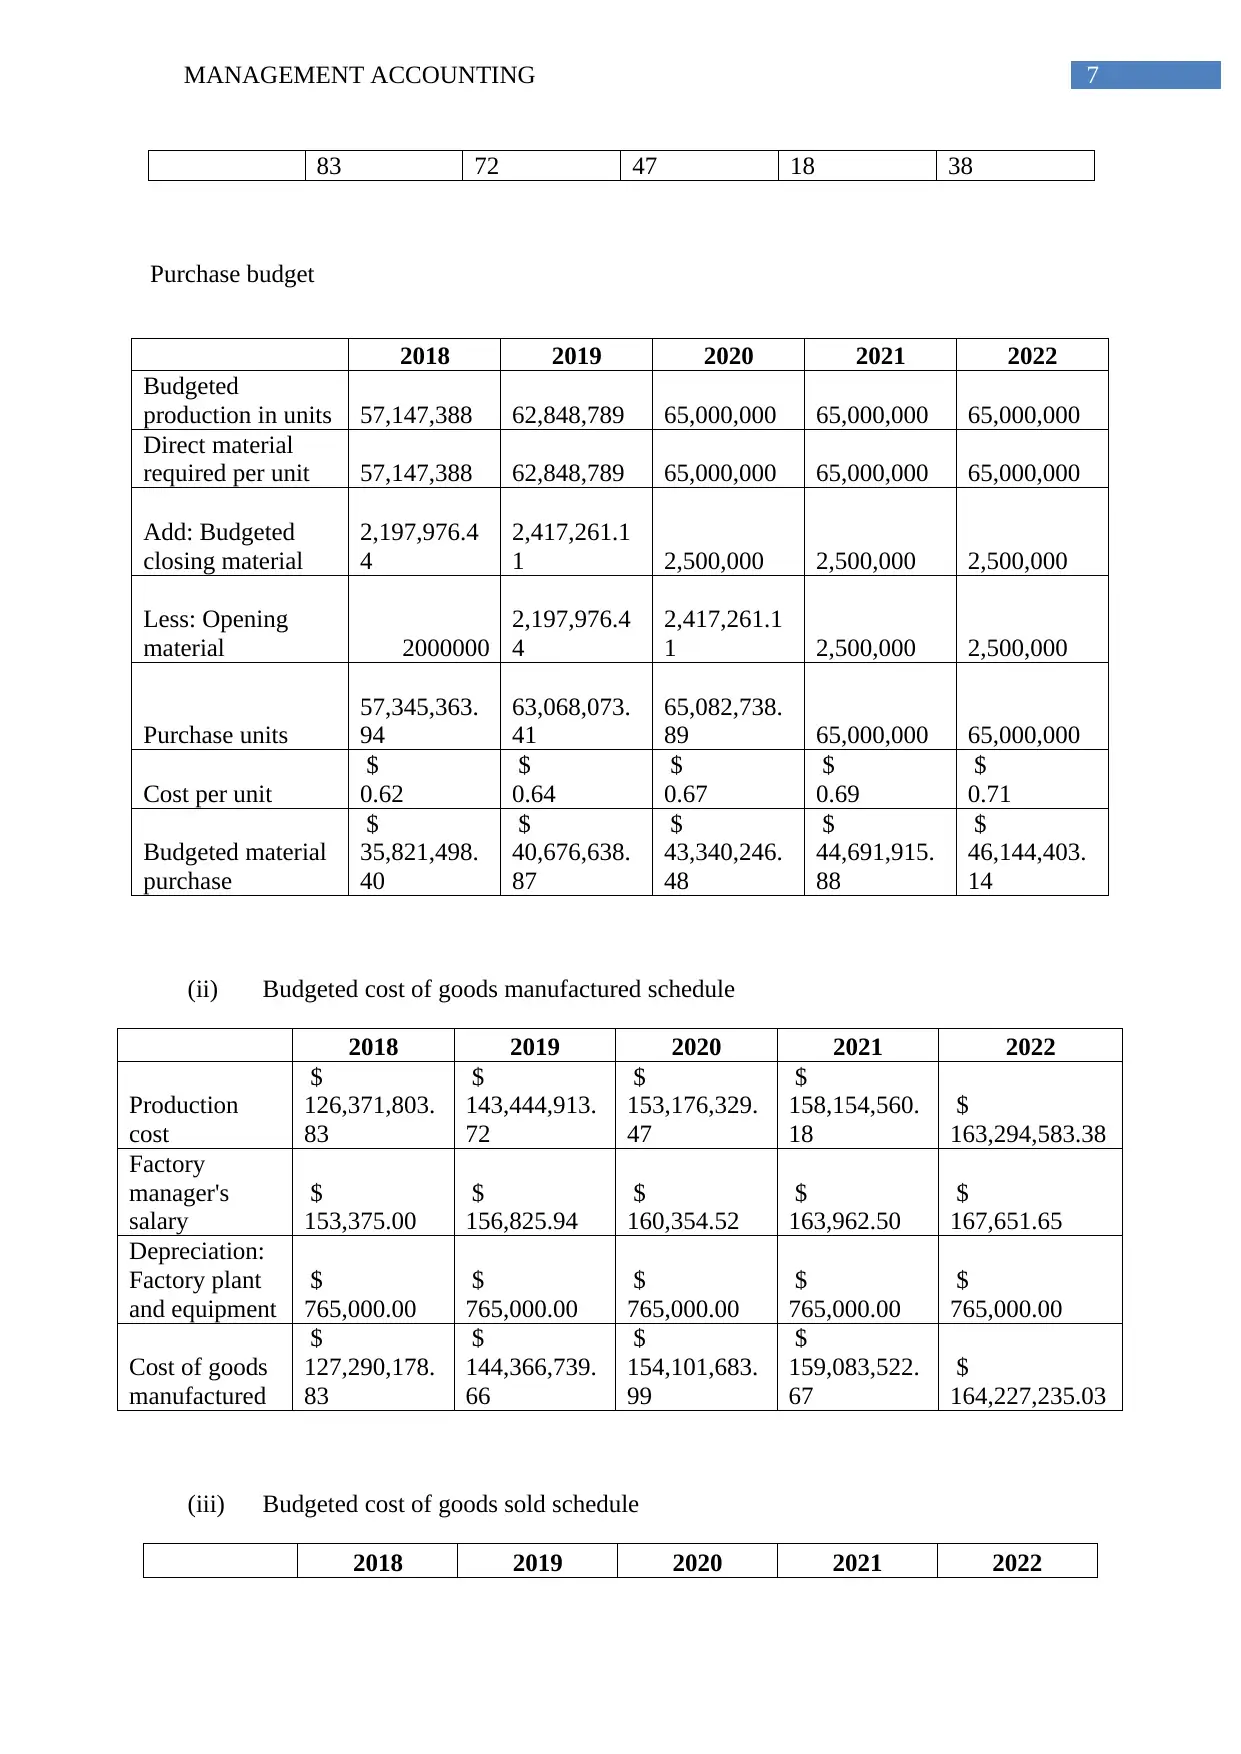
Purchase budget
2018 2019 2020 2021 2022
Budgeted
production in units 57,147,388 62,848,789 65,000,000 65,000,000 65,000,000
Direct material
required per unit 57,147,388 62,848,789 65,000,000 65,000,000 65,000,000
Add: Budgeted
closing material
2,197,976.4
4
2,417,261.1
1 2,500,000 2,500,000 2,500,000
Less: Opening
material 2000000
2,197,976.4
4
2,417,261.1
1 2,500,000 2,500,000
Purchase units
57,345,363.
94
63,068,073.
41
65,082,738.
89 65,000,000 65,000,000
Cost per unit
$
0.62
$
0.64
$
0.67
$
0.69
$
0.71
Budgeted material
purchase
$
35,821,498.
40
$
40,676,638.
87
$
43,340,246.
48
$
44,691,915.
88
$
46,144,403.
14
(ii) Budgeted cost of goods manufactured schedule
2018 2019 2020 2021 2022
Production
cost
$
126,371,803.
83
$
143,444,913.
72
$
153,176,329.
47
$
158,154,560.
18
$
163,294,583.38
Factory
manager's
salary
$
153,375.00
$
156,825.94
$
160,354.52
$
163,962.50
$
167,651.65
Depreciation:
Factory plant
and equipment
$
765,000.00
$
765,000.00
$
765,000.00
$
765,000.00
$
765,000.00
Cost of goods
manufactured
$
127,290,178.
83
$
144,366,739.
66
$
154,101,683.
99
$
159,083,522.
67
$
164,227,235.03
(iii) Budgeted cost of goods sold schedule
2018 2019 2020 2021 2022
83 72 47 18 38
Purchase budget
2018 2019 2020 2021 2022
Budgeted
production in units 57,147,388 62,848,789 65,000,000 65,000,000 65,000,000
Direct material
required per unit 57,147,388 62,848,789 65,000,000 65,000,000 65,000,000
Add: Budgeted
closing material
2,197,976.4
4
2,417,261.1
1 2,500,000 2,500,000 2,500,000
Less: Opening
material 2000000
2,197,976.4
4
2,417,261.1
1 2,500,000 2,500,000
Purchase units
57,345,363.
94
63,068,073.
41
65,082,738.
89 65,000,000 65,000,000
Cost per unit
$
0.62
$
0.64
$
0.67
$
0.69
$
0.71
Budgeted material
purchase
$
35,821,498.
40
$
40,676,638.
87
$
43,340,246.
48
$
44,691,915.
88
$
46,144,403.
14
(ii) Budgeted cost of goods manufactured schedule
2018 2019 2020 2021 2022
Production
cost
$
126,371,803.
83
$
143,444,913.
72
$
153,176,329.
47
$
158,154,560.
18
$
163,294,583.38
Factory
manager's
salary
$
153,375.00
$
156,825.94
$
160,354.52
$
163,962.50
$
167,651.65
Depreciation:
Factory plant
and equipment
$
765,000.00
$
765,000.00
$
765,000.00
$
765,000.00
$
765,000.00
Cost of goods
manufactured
$
127,290,178.
83
$
144,366,739.
66
$
154,101,683.
99
$
159,083,522.
67
$
164,227,235.03
(iii) Budgeted cost of goods sold schedule
2018 2019 2020 2021 2022
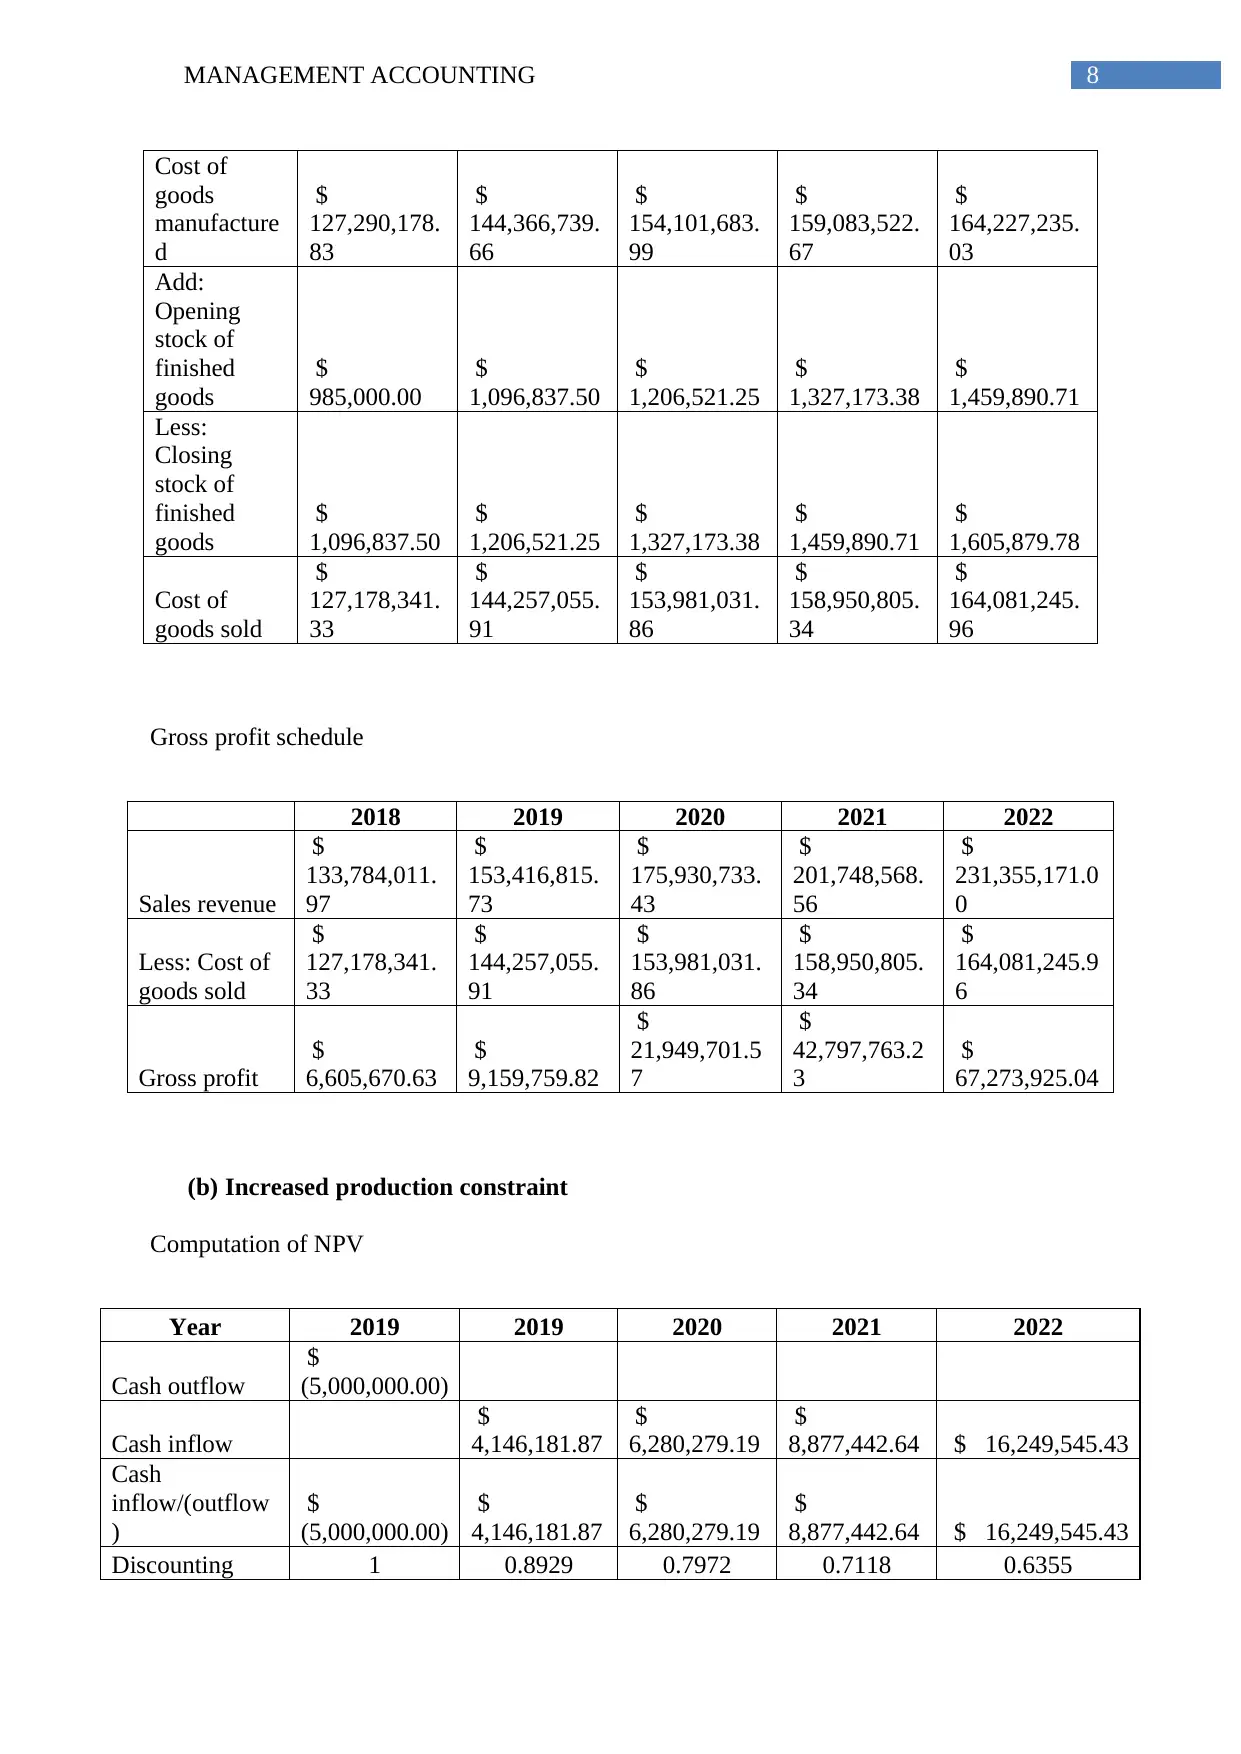
8MANAGEMENT ACCOUNTING
Cost of
goods
manufacture
d
$
127,290,178.
83
$
144,366,739.
66
$
154,101,683.
99
$
159,083,522.
67
$
164,227,235.
03
Add:
Opening
stock of
finished
goods
$
985,000.00
$
1,096,837.50
$
1,206,521.25
$
1,327,173.38
$
1,459,890.71
Less:
Closing
stock of
finished
goods
$
1,096,837.50
$
1,206,521.25
$
1,327,173.38
$
1,459,890.71
$
1,605,879.78
Cost of
goods sold
$
127,178,341.
33
$
144,257,055.
91
$
153,981,031.
86
$
158,950,805.
34
$
164,081,245.
96
Gross profit schedule
2018 2019 2020 2021 2022
Sales revenue
$
133,784,011.
97
$
153,416,815.
73
$
175,930,733.
43
$
201,748,568.
56
$
231,355,171.0
0
Less: Cost of
goods sold
$
127,178,341.
33
$
144,257,055.
91
$
153,981,031.
86
$
158,950,805.
34
$
164,081,245.9
6
Gross profit
$
6,605,670.63
$
9,159,759.82
$
21,949,701.5
7
$
42,797,763.2
3
$
67,273,925.04
(b) Increased production constraint
Computation of NPV
Year 2019 2019 2020 2021 2022
Cash outflow
$
(5,000,000.00)
Cash inflow
$
4,146,181.87
$
6,280,279.19
$
8,877,442.64 $ 16,249,545.43
Cash
inflow/(outflow
)
$
(5,000,000.00)
$
4,146,181.87
$
6,280,279.19
$
8,877,442.64 $ 16,249,545.43
Discounting 1 0.8929 0.7972 0.7118 0.6355
Cost of
goods
manufacture
d
$
127,290,178.
83
$
144,366,739.
66
$
154,101,683.
99
$
159,083,522.
67
$
164,227,235.
03
Add:
Opening
stock of
finished
goods
$
985,000.00
$
1,096,837.50
$
1,206,521.25
$
1,327,173.38
$
1,459,890.71
Less:
Closing
stock of
finished
goods
$
1,096,837.50
$
1,206,521.25
$
1,327,173.38
$
1,459,890.71
$
1,605,879.78
Cost of
goods sold
$
127,178,341.
33
$
144,257,055.
91
$
153,981,031.
86
$
158,950,805.
34
$
164,081,245.
96
Gross profit schedule
2018 2019 2020 2021 2022
Sales revenue
$
133,784,011.
97
$
153,416,815.
73
$
175,930,733.
43
$
201,748,568.
56
$
231,355,171.0
0
Less: Cost of
goods sold
$
127,178,341.
33
$
144,257,055.
91
$
153,981,031.
86
$
158,950,805.
34
$
164,081,245.9
6
Gross profit
$
6,605,670.63
$
9,159,759.82
$
21,949,701.5
7
$
42,797,763.2
3
$
67,273,925.04
(b) Increased production constraint
Computation of NPV
Year 2019 2019 2020 2021 2022
Cash outflow
$
(5,000,000.00)
Cash inflow
$
4,146,181.87
$
6,280,279.19
$
8,877,442.64 $ 16,249,545.43
Cash
inflow/(outflow
)
$
(5,000,000.00)
$
4,146,181.87
$
6,280,279.19
$
8,877,442.64 $ 16,249,545.43
Discounting 1 0.8929 0.7972 0.7118 0.6355
⊘ This is a preview!⊘
Do you want full access?
Subscribe today to unlock all pages.
Trusted by 1+ million students worldwide
9MANAGEMENT ACCOUNTING
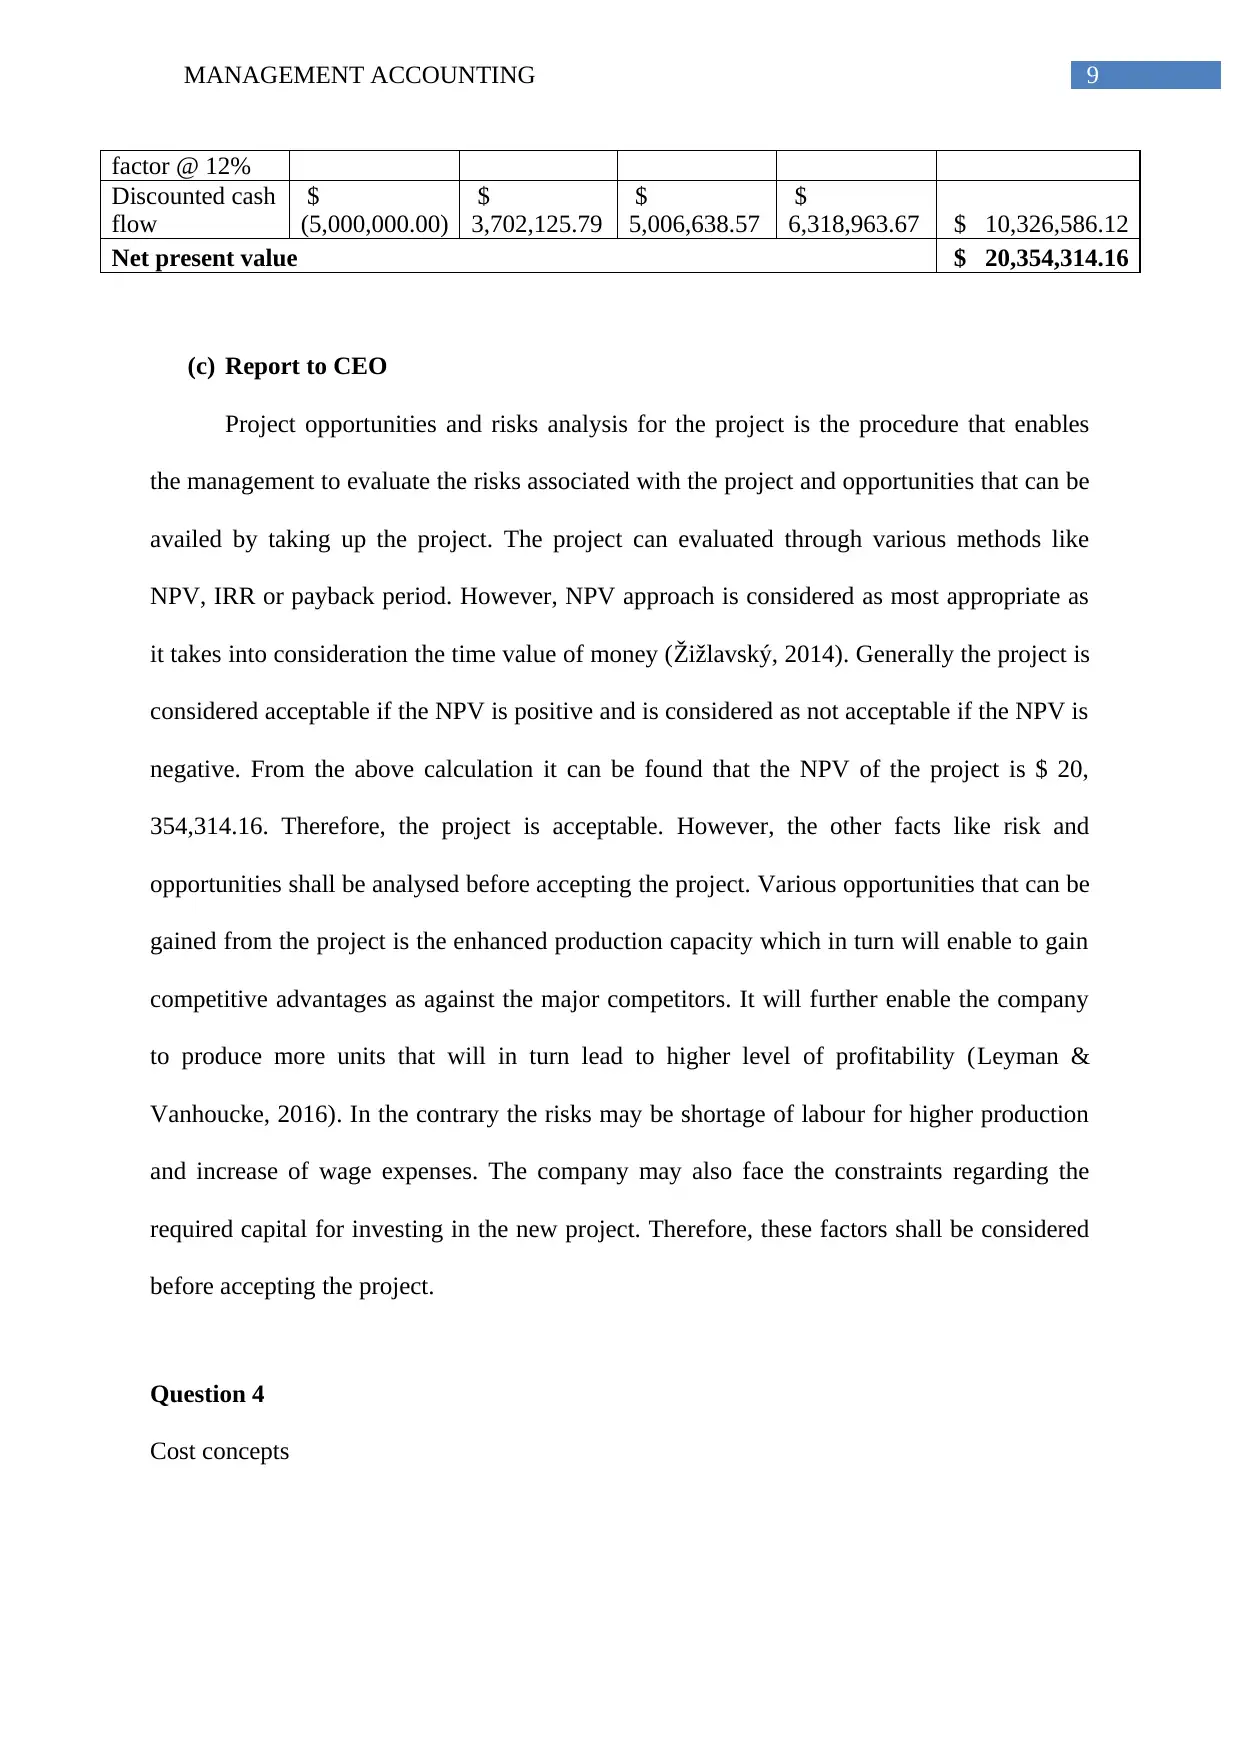
factor @ 12%
Discounted cash
flow
$
(5,000,000.00)
$
3,702,125.79
$
5,006,638.57
$
6,318,963.67 $ 10,326,586.12
Net present value $ 20,354,314.16
(c) Report to CEO
Project opportunities and risks analysis for the project is the procedure that enables
the management to evaluate the risks associated with the project and opportunities that can be
availed by taking up the project. The project can evaluated through various methods like
NPV, IRR or payback period. However, NPV approach is considered as most appropriate as
it takes into consideration the time value of money (Žižlavský, 2014). Generally the project is
considered acceptable if the NPV is positive and is considered as not acceptable if the NPV is
negative. From the above calculation it can be found that the NPV of the project is $ 20,
354,314.16. Therefore, the project is acceptable. However, the other facts like risk and
opportunities shall be analysed before accepting the project. Various opportunities that can be
gained from the project is the enhanced production capacity which in turn will enable to gain
competitive advantages as against the major competitors. It will further enable the company
to produce more units that will in turn lead to higher level of profitability (Leyman &
Vanhoucke, 2016). In the contrary the risks may be shortage of labour for higher production
and increase of wage expenses. The company may also face the constraints regarding the
required capital for investing in the new project. Therefore, these factors shall be considered
before accepting the project.
Question 4
Cost concepts
Paraphrase This Document
Need a fresh take? Get an instant paraphrase of this document with our AI Paraphraser
10MANAGEMENT ACCOUNTING
(i) Distinguish between variable cost and fixed cost and product cost and period
cost
Variable costs are the costs that changes with the changes in units. It reduces and
increases with the decrease or increase in the units produced. Therefore, the variable costs per
unit remain same and are incurred only when there is any production. The main components
of variable costs are generally the cost of direct material, direct labour and variable
overheads.
On the other hand, fixed costs are the costs that do not change with the changes in
units. It does not reduces or increases with the decrease or increase in the units produced.
Therefore, the fixed costs per unit reduce with the increase in production and vice versa.
However, the fixed costs are incurred even when there is no production. The main
components of fixed costs are generally the cost of distribution overhead, selling and
administration overheads.
Period cost and product cost –
Period costs are not related to the production and is not distributed to the product.
These costs are fixed; time based and includes fixed manufacturing costs like selling cost,
distribution cost and administration cost. On the other hand, the product costs are allocated to
the product and can be recognized with the product. It forms the inventory part and volume
based. Product cost includes manufacturing or production cost that includes cost of raw
material and labour (Drury, 2013).
(ii) Relevant range
It is the particular activity level that is abided by the minimum and maximum amount.
With the particular level of boundaries particular revenues or costs take place. If the revenues
or expenses fall outside the boundaries the expected amount will also change. For assessing
11MANAGEMENT ACCOUNTING
the production level relevant range recognition is crucial as it will be used for financial
planning, budgeting and accounting (Seuring & Goldbach (Eds.), 2013). However, apart from
fixed cost the relevant range is also applicable for the variable costs like selling overhead.
The volume that is more than or less than the relevant range will change the per unit variable
cost.
Question 5
Strategic Management Accounting case study
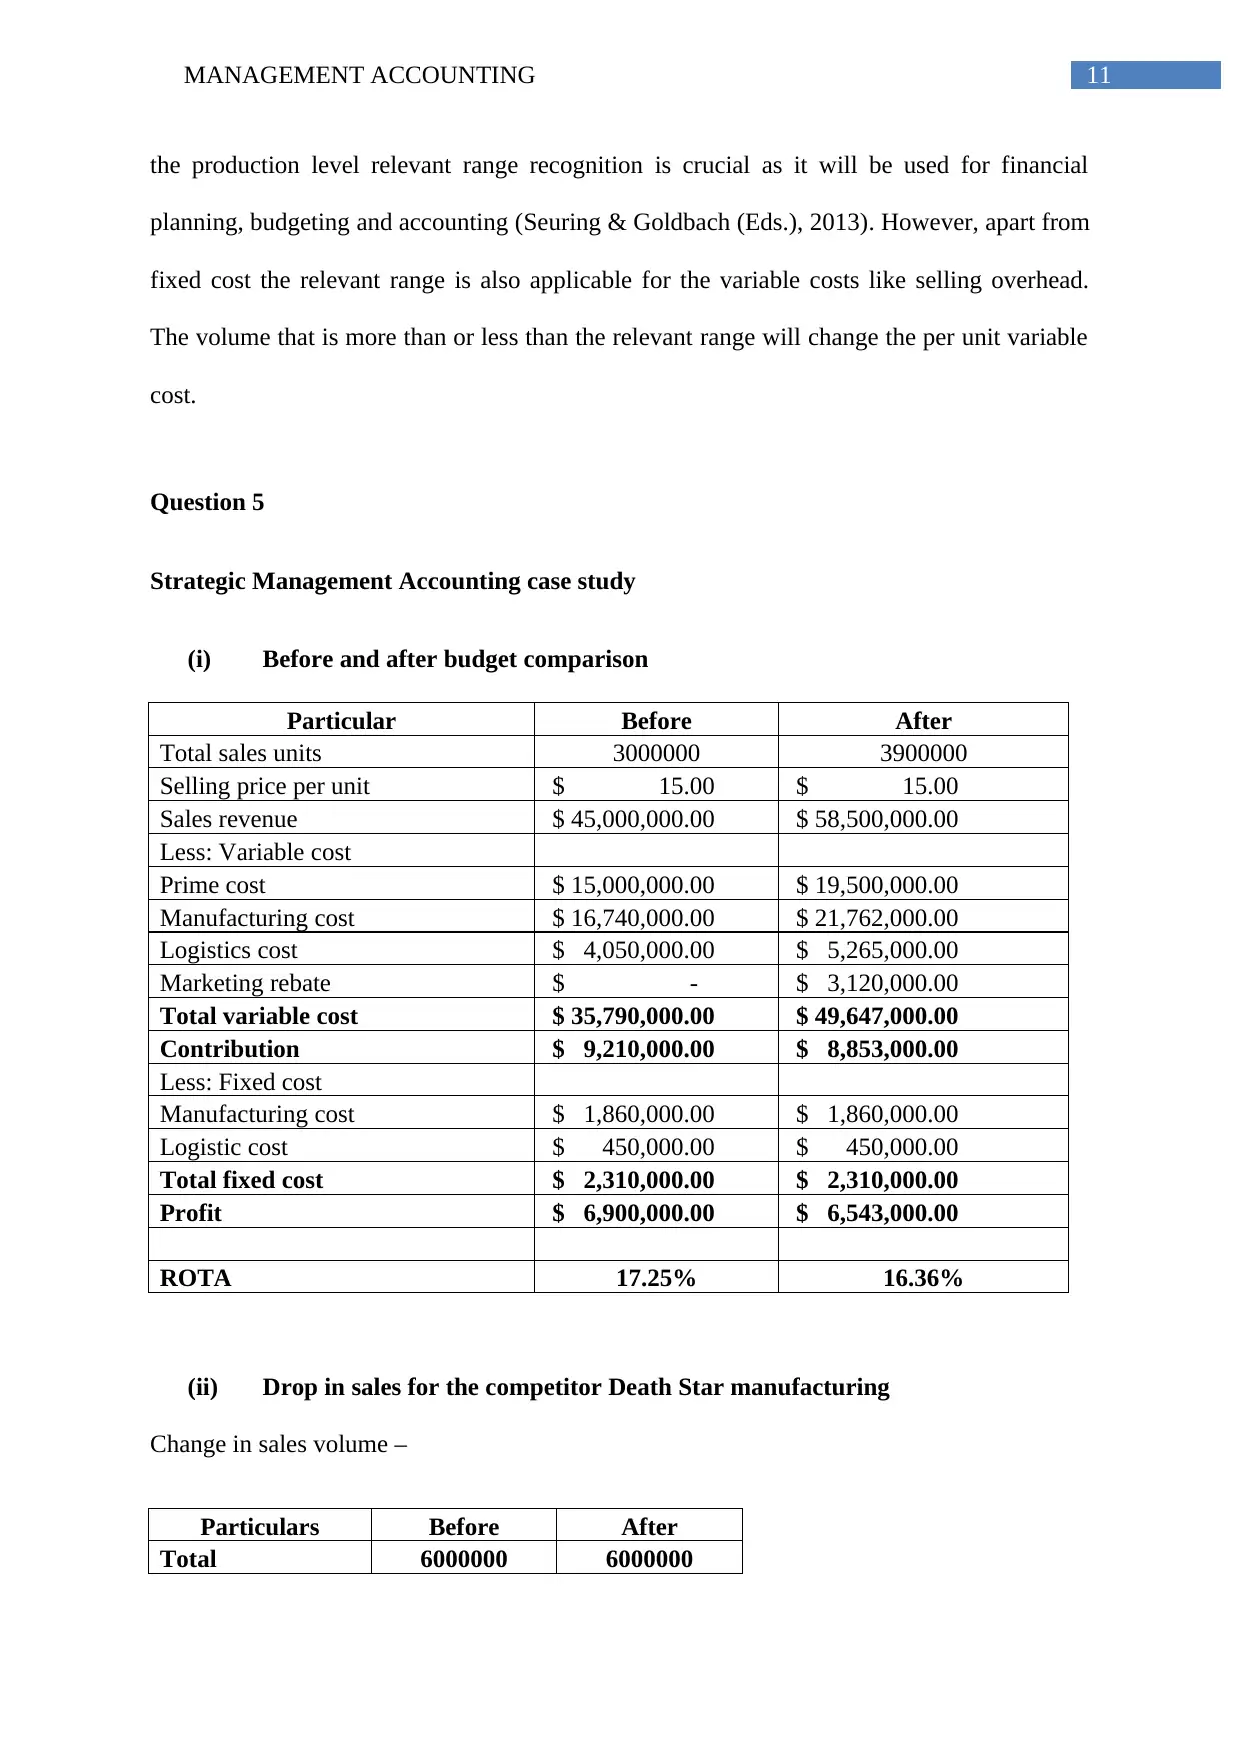
(i) Before and after budget comparison
Particular Before After
Total sales units 3000000 3900000
Selling price per unit $ 15.00 $ 15.00
Sales revenue $ 45,000,000.00 $ 58,500,000.00
Less: Variable cost
Prime cost $ 15,000,000.00 $ 19,500,000.00
Manufacturing cost $ 16,740,000.00 $ 21,762,000.00
Logistics cost $ 4,050,000.00 $ 5,265,000.00
Marketing rebate $ - $ 3,120,000.00
Total variable cost $ 35,790,000.00 $ 49,647,000.00
Contribution $ 9,210,000.00 $ 8,853,000.00
Less: Fixed cost
Manufacturing cost $ 1,860,000.00 $ 1,860,000.00
Logistic cost $ 450,000.00 $ 450,000.00
Total fixed cost $ 2,310,000.00 $ 2,310,000.00
Profit $ 6,900,000.00 $ 6,543,000.00
ROTA 17.25% 16.36%
(ii) Drop in sales for the competitor Death Star manufacturing
Change in sales volume –
Particulars Before After
Total 6000000 6000000
the production level relevant range recognition is crucial as it will be used for financial
planning, budgeting and accounting (Seuring & Goldbach (Eds.), 2013). However, apart from
fixed cost the relevant range is also applicable for the variable costs like selling overhead.
The volume that is more than or less than the relevant range will change the per unit variable
cost.
Question 5
Strategic Management Accounting case study
(i) Before and after budget comparison
Particular Before After
Total sales units 3000000 3900000
Selling price per unit $ 15.00 $ 15.00
Sales revenue $ 45,000,000.00 $ 58,500,000.00
Less: Variable cost
Prime cost $ 15,000,000.00 $ 19,500,000.00
Manufacturing cost $ 16,740,000.00 $ 21,762,000.00
Logistics cost $ 4,050,000.00 $ 5,265,000.00
Marketing rebate $ - $ 3,120,000.00
Total variable cost $ 35,790,000.00 $ 49,647,000.00
Contribution $ 9,210,000.00 $ 8,853,000.00
Less: Fixed cost
Manufacturing cost $ 1,860,000.00 $ 1,860,000.00
Logistic cost $ 450,000.00 $ 450,000.00
Total fixed cost $ 2,310,000.00 $ 2,310,000.00
Profit $ 6,900,000.00 $ 6,543,000.00
ROTA 17.25% 16.36%
(ii) Drop in sales for the competitor Death Star manufacturing
Change in sales volume –
Particulars Before After
Total 6000000 6000000
⊘ This is a preview!⊘
Do you want full access?
Subscribe today to unlock all pages.
Trusted by 1+ million students worldwide
1 out of 17
Related Documents


Your All-in-One AI-Powered Toolkit for Academic Success.
+13062052269
info@desklib.com
Available 24*7 on WhatsApp / Email
![[object Object]](/_next/static/media/star-bottom.7253800d.svg)
Unlock your academic potential
Copyright © 2020–2026 A2Z Services. All Rights Reserved. Developed and managed by ZUCOL.