ACC211 - Capital Budgeting: Evaluating Booli Electronics' New Project
VerifiedAdded on 2023/06/12
|15
|3021
|391
Report
AI Summary
This report evaluates the financial viability of a new project for Booli Electronics, an electronics manufacturer. It employs capital budgeting tools such as payback period, profitability index, internal rate of return (IRR), and net present value (NPV) to assess the project's potential. The analysis reveals a payback period of 2.02 years, a profitability index of 1.71, an IRR of 37%, and a positive NPV of $40.2 million, suggesting the project is financially viable. Sensitivity analysis is conducted to evaluate the impact of changes in sales price and quantity on the NPV, highlighting the project's volatility to sales price fluctuations. The report also addresses the importance of considering opportunity costs, such as potential loss of sales from existing products. Ultimately, the report recommends accepting the project based on its strong financial indicators.

Business Finance
1
1
Paraphrase This Document
Need a fresh take? Get an instant paraphrase of this document with our AI Paraphraser
Contents
INTRODUCTION.................................................................................................................................3
FINANCIAL VIABILITY OF THE PROJECT....................................................................................4
Non-Discounted Pay-Back Period.....................................................................................................4
Profitability Index..............................................................................................................................4
Internal Rate of Return......................................................................................................................4
Net Present Value..............................................................................................................................4
SENSITIVITY ANALYSIS..................................................................................................................5
Change in sales price.........................................................................................................................5
Change in sales quantity....................................................................................................................5
EFFECT OF LOSS OF SALE OF OTHER MODELS DU%E TO NEW PROJECT............................7
CONCLUSION AND RECOMMENDATION.....................................................................................8
Bibliography........................................................................................................................................9
Appendix.............................................................................................................................................10
2
INTRODUCTION
We have been provided with a new investment opportunity in which the company is required
to take decision, if it should proceed with such opportunity or not. Booli Electronics is a
company engaged in the business of manufacturing electronics. The company is seeking
advice on introduction of new product. They have conducted a market analysis which has
resulted in a collection of some financial data which might help us is taking the decision.
In order to evaluate the production opportunity, we have conducted capital budgeting for this
project. The results of this tool will help us to take the correct decision. (Seal, 2012) The
capita budgeting tool requires correct implementation and proper data in order to obtain the
appropriate result but we should always keep in mind the uncertainties that come with new
projects.
3
⊘ This is a preview!⊘
Do you want full access?
Subscribe today to unlock all pages.
Trusted by 1+ million students worldwide
FINANCIAL VIABILITY OF THE PROJECT
Non-Discounted Pay-Back Period
Pay- back period is a capital budgeting tool that helps us calculate the estimated time within
which the amount initially invested in the project will be recovered by the investors.
(Rivenbark, Vogt, & Marlowe, 2009) The cash by the company in time of the project
remaining after the pay- back period, will all be surplus. Therefore, lower the pay- back
period the better it is.
For the given opportunity the pay- back period is 2.02 years, whereas the project will be
carried on for 5 years. The pay- back period of the opportunity seems low.
Profitability Index
Profitability index is the ratio that calculated the cash inflow flow per unit of initial cash
outflow (Peterson & Fabozzi, 2012). Of the profitability index is more than one then it
indicates profits, if equal to one then it means that only invested amount will be recorded and
if less than one then it means that project will result in loss.
For the given project the profitability index is 1.71 time. The project will provide profits and
hence should be accepted.
Internal Rate of Return
Internal rate of return will calculate the exact return on the project (Noreen, 2015). This rate
is calculated by using the trial and error method on the expected cash inflows and outflows. If
the internal rate of return is more than required rate of return then the project should be
accepted.
The IRR for the given project results to be 37%. Therefore, the return on the investment is
sufficient and the project should be accepted.
Net Present Value
Net present value calculates the difference between the cash inflows and cash outflows which
are discounted using the required rate of return. (Menifield, 2014) If the net present value
results in positive balance the project should be accepted.
The net present value of the given project results to be $ 40.2 million approximately. Since
the project will result in positive NPV, it can be accepted.
4
Paraphrase This Document
Need a fresh take? Get an instant paraphrase of this document with our AI Paraphraser
SENSITIVITY ANALYSIS
Sensitivity analysis is the part of capital budgeting tool that helps us evaluate the effect of
uncertainties on the results of the project. (Dayananda, Irons, Harrison, Herbohn, & Rowland,
2008) In this analysis the effect of change on input on the output is calculated.
Change in sales price
Change in sales price will change the cash inflows of the project which will in turn change
the output. In order to quantify this change we have conducted the sensitivity analysis (Berry,
2009). We have changed the sales price by 1 percent in order to evaluate its affect on the net
present value. We see that with one percent change in the sales price the net present value
changes by 4.35%. We have also evaluated the change in sales price on other financial
results:
Impact on IRR- 1% increase in the price increased the IRR by 2.67%. As a result, IRR
increased from 37% to 38%.
Impact on pay-back period- 1% increase in the price decreased the pay-back period by
1.75%. As a result, pay-back period decreased from 2.02 years to 1.99 years.
Impact on profitability index- 1 % increase in the price increased the profitability
index by 1.77%. As a result, the profitability index increased from 1.71 times to 1.74
times.
We can observe from the calculations that the change in sales price has affected the Net
present value majorly. It is clear that a small change in the percent of sales price has
shown a significant change of the net present value.
Change in sales quantity
Change in sales quantity will change the cash inflows of the project which will in turn change
the output. In order to quantify this change we have conducted the sensitivity analysis.
(Atkinson, 2012) We have changed the sales quantity by 1 percent in order to evaluate its
affect on the net present value. We see that with one percent change in the sales quantity the
net present value changes by 2.23% . We have also evaluated the change in sales quantity on
other financial results:
Impact on IRR- 1% increase in the price increased the IRR by 1.30%. As a result, IRR
increased from 37% to 37.47%.
5
Impact on pay-back period- 1% increase in the price decreased the pay-back period by
0.94%. As a result, pay-back period decreased from 2.02 years to 2 years.
Impact on profitability index- 1 % increase in the price increased the profitability
index by 0.89%. As a result, the profitability index increased from 1.71 times to 1.73
times.
We can observe from the calculations that the change in sales price has affected the Net
present value majorly. (Adelaja, 2015) It is clear that a small change in the percent of
sales price has shown a significant change of the net present value.
The figures used while performing the capital budgeting is based on estimates and
assumptions. Therefore, the expected return can never be equal to the actual return
because of the changing assumptions and estimates.
6
⊘ This is a preview!⊘
Do you want full access?
Subscribe today to unlock all pages.
Trusted by 1+ million students worldwide
EFFECT OF LOSS OF SALE OF OTHER MODELS DU%E TO NEW PROJECT
There are certain costs which are not to be included while carrying out the capital budgeting
techniques. Similarly there are some costs which are to be included in the capital budgeting
techniques in order to obtain appropriate results.
In case the company loses sales of its other products if it agrees to carry on this new project,
then it would result in loss of sales. This loss will not take place if project is not accepted.
Since the company will lose a part of profit in order to earn other, this coat will be classified
as opportunity cost. (Bierman & Smidt, 2010) While taking the capital budgeting decision,
we include the opportunity costs in analysis. Therefore, if the company loses sakes of its
other product due to this ne product then, these costs will be included while evaluating the
acceptability of this new project.
7
Paraphrase This Document
Need a fresh take? Get an instant paraphrase of this document with our AI Paraphraser
CONCLUSION AND RECOMMENDATION
When a new project is being evaluated both the qualitative and quantitative factors are to be
taken into consideration. The results of capital budgeting decision will always contain
uncertainly due to assumptions made. Based on the results of the analysis above, we can see
that the project will generate high returns for the investors. The production of new project
will add high value to the firm. Based on this information we can say that the project seems
financial viable and should be accepted.
8

Bibliography
Adelaja, T. (2015). Capital Budgeting: Investment Appraisal Techniques Under Certainty. Chicago:
CreateSpace Independent Publishing Platform .
Atkinson, A. A. (2012). Management accounting. Upper Saddle River, N.J.: Paerson.
Berry, L. E. (2009). Management accounting demystified. New York: McGraw-Hill.
Bierman, H., & Smidt, S. (2010). The Capital Budgeting Decision. Boston: Routledge.
Dayananda, D., Irons, R., Harrison, S., Herbohn, J., & Rowland, P. (2008). Capital Budgeting: Financial
Appraisal of Investment Projects. Cambridge: Cambridge University Press.
Menifield, C. E. (2014). The Basics of Public Budgeting and Financial Management: A Handbook for
Academics and Practitioners. Lanham, Md.: University Press of America.
Noreen, E. (2015). The theory of constraints and its implications for management accounting. Great
Barrington, MA: North River Press.
Peterson, P. P., & Fabozzi, F. J. (2012). Capital Budgeting. New York, NY: Wiley.
Rivenbark, W. C., Vogt, J., & Marlowe, J. (2009). Capital Budgeting and Finance: A Guide for Local
Governments. Washington, D.C.: ICMA Press.
Seal, W. (2012). Management accounting. Maidenhead: McGraw-Hill Higher Education.
9
⊘ This is a preview!⊘
Do you want full access?
Subscribe today to unlock all pages.
Trusted by 1+ million students worldwide
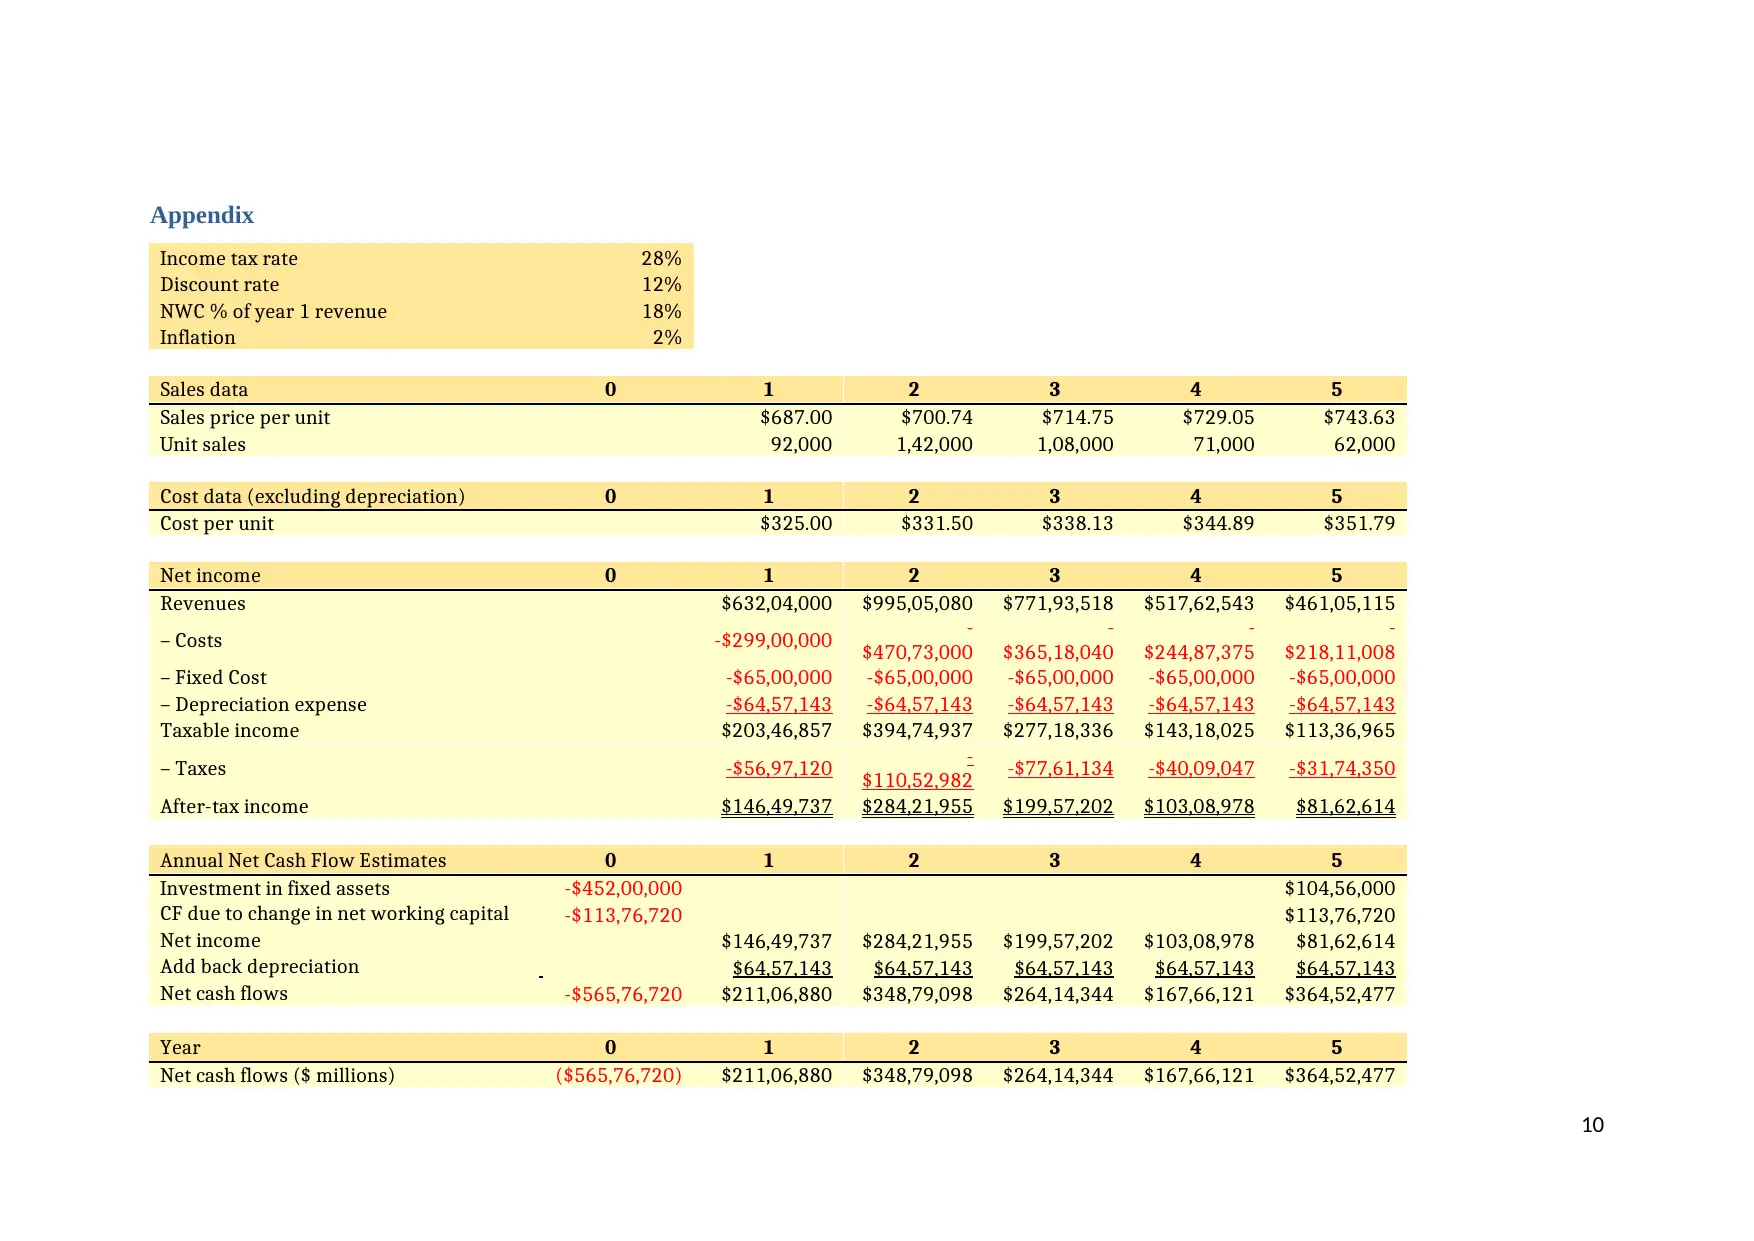
Appendix
Income tax rate 28%
Discount rate 12%
NWC % of year 1 revenue 18%
Inflation 2%
Sales data 0 1 2 3 4 5
Sales price per unit $687.00 $700.74 $714.75 $729.05 $743.63
Unit sales 92,000 1,42,000 1,08,000 71,000 62,000
Cost data (excluding depreciation) 0 1 2 3 4 5
Cost per unit $325.00 $331.50 $338.13 $344.89 $351.79
Net income 0 1 2 3 4 5
Revenues $632,04,000 $995,05,080 $771,93,518 $517,62,543 $461,05,115
– Costs -$299,00,000 -
$470,73,000
-
$365,18,040
-
$244,87,375
-
$218,11,008
– Fixed Cost -$65,00,000 -$65,00,000 -$65,00,000 -$65,00,000 -$65,00,000
– Depreciation expense -$64,57,143 -$64,57,143 -$64,57,143 -$64,57,143 -$64,57,143
Taxable income $203,46,857 $394,74,937 $277,18,336 $143,18,025 $113,36,965
– Taxes -$56,97,120 -
$110,52,982 -$77,61,134 -$40,09,047 -$31,74,350
After-tax income $146,49,737 $284,21,955 $199,57,202 $103,08,978 $81,62,614
Annual Net Cash Flow Estimates 0 1 2 3 4 5
Investment in fixed assets -$452,00,000 $104,56,000
CF due to change in net working capital -$113,76,720 $113,76,720
Net income $146,49,737 $284,21,955 $199,57,202 $103,08,978 $81,62,614
Add back depreciation $64,57,143 $64,57,143 $64,57,143 $64,57,143 $64,57,143
Net cash flows -$565,76,720 $211,06,880 $348,79,098 $264,14,344 $167,66,121 $364,52,477
Year 0 1 2 3 4 5
Net cash flows ($ millions) ($565,76,720) $211,06,880 $348,79,098 $264,14,344 $167,66,121 $364,52,477
10
Paraphrase This Document
Need a fresh take? Get an instant paraphrase of this document with our AI Paraphraser
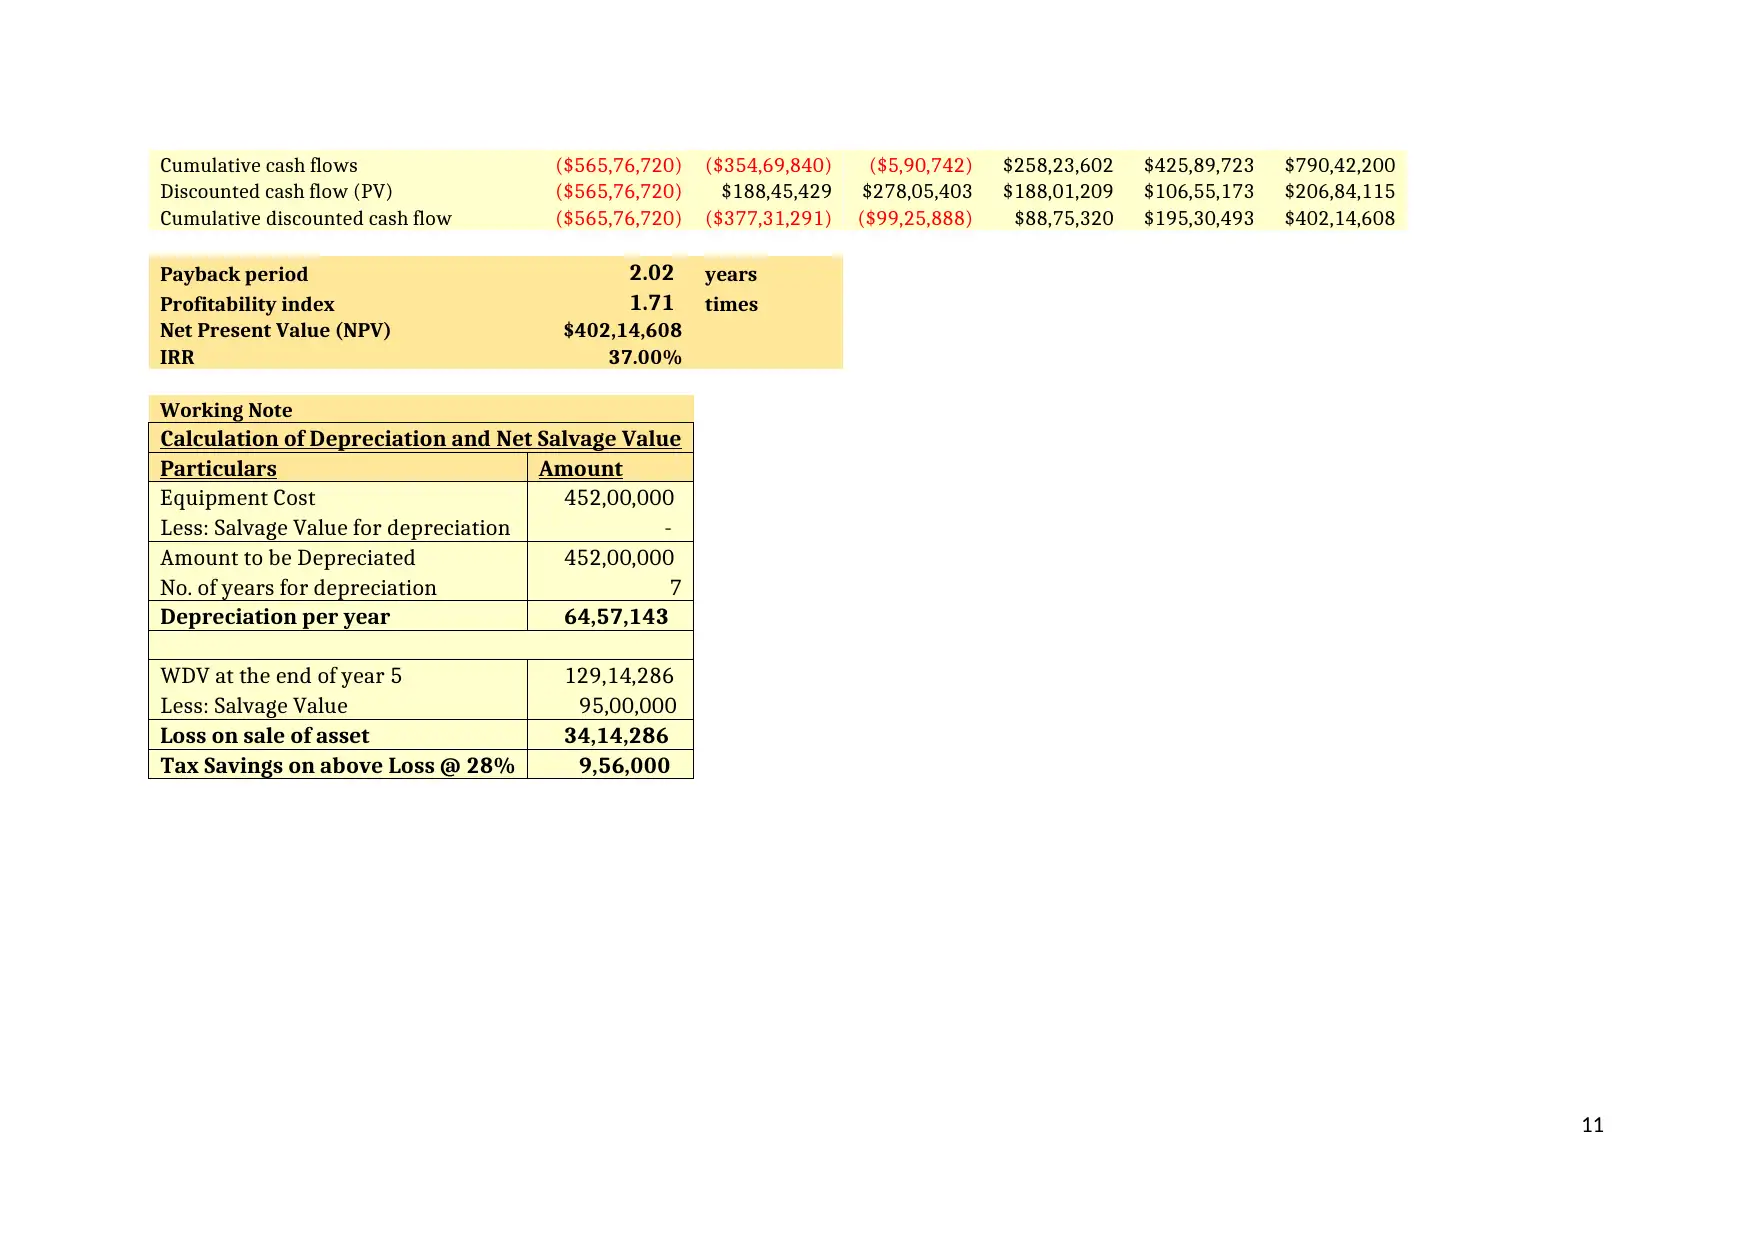
Cumulative cash flows ($565,76,720) ($354,69,840) ($5,90,742) $258,23,602 $425,89,723 $790,42,200
Discounted cash flow (PV) ($565,76,720) $188,45,429 $278,05,403 $188,01,209 $106,55,173 $206,84,115
Cumulative discounted cash flow ($565,76,720) ($377,31,291) ($99,25,888) $88,75,320 $195,30,493 $402,14,608
Payback period 2.02 years
Profitability index 1.71 times
Net Present Value (NPV) $402,14,608
IRR 37.00%
Working Note
Calculation of Depreciation and Net Salvage Value
Particulars Amount
Equipment Cost 452,00,000
Less: Salvage Value for depreciation -
Amount to be Depreciated 452,00,000
No. of years for depreciation 7
Depreciation per year 64,57,143
WDV at the end of year 5 129,14,286
Less: Salvage Value 95,00,000
Loss on sale of asset 34,14,286
Tax Savings on above Loss @ 28% 9,56,000
11
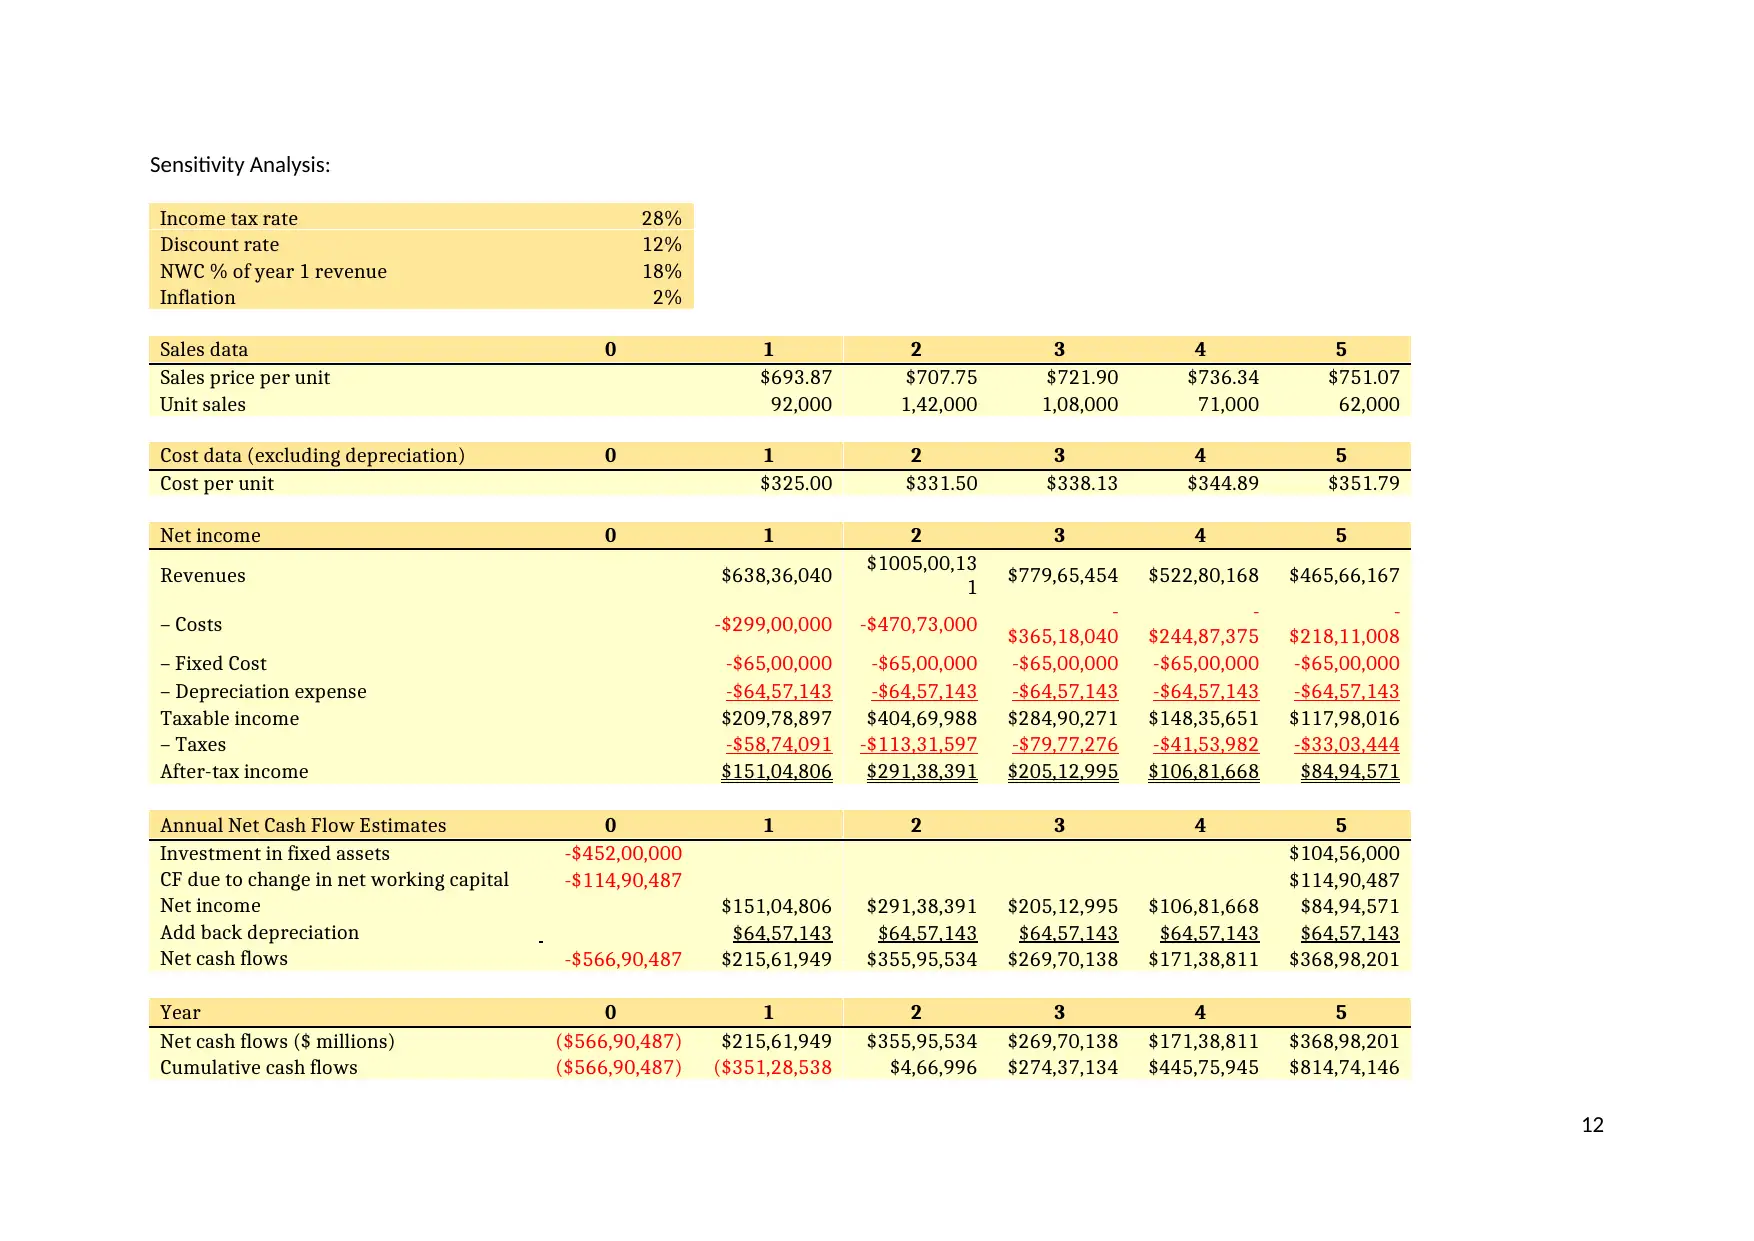
Sensitivity Analysis:
Income tax rate 28%
Discount rate 12%
NWC % of year 1 revenue 18%
Inflation 2%
Sales data 0 1 2 3 4 5
Sales price per unit $693.87 $707.75 $721.90 $736.34 $751.07
Unit sales 92,000 1,42,000 1,08,000 71,000 62,000
Cost data (excluding depreciation) 0 1 2 3 4 5
Cost per unit $325.00 $331.50 $338.13 $344.89 $351.79
Net income 0 1 2 3 4 5
Revenues $638,36,040 $1005,00,13
1 $779,65,454 $522,80,168 $465,66,167
– Costs -$299,00,000 -$470,73,000 -
$365,18,040
-
$244,87,375
-
$218,11,008
– Fixed Cost -$65,00,000 -$65,00,000 -$65,00,000 -$65,00,000 -$65,00,000
– Depreciation expense -$64,57,143 -$64,57,143 -$64,57,143 -$64,57,143 -$64,57,143
Taxable income $209,78,897 $404,69,988 $284,90,271 $148,35,651 $117,98,016
– Taxes -$58,74,091 -$113,31,597 -$79,77,276 -$41,53,982 -$33,03,444
After-tax income $151,04,806 $291,38,391 $205,12,995 $106,81,668 $84,94,571
Annual Net Cash Flow Estimates 0 1 2 3 4 5
Investment in fixed assets -$452,00,000 $104,56,000
CF due to change in net working capital -$114,90,487 $114,90,487
Net income $151,04,806 $291,38,391 $205,12,995 $106,81,668 $84,94,571
Add back depreciation $64,57,143 $64,57,143 $64,57,143 $64,57,143 $64,57,143
Net cash flows -$566,90,487 $215,61,949 $355,95,534 $269,70,138 $171,38,811 $368,98,201
Year 0 1 2 3 4 5
Net cash flows ($ millions) ($566,90,487) $215,61,949 $355,95,534 $269,70,138 $171,38,811 $368,98,201
Cumulative cash flows ($566,90,487) ($351,28,538 $4,66,996 $274,37,134 $445,75,945 $814,74,146
12
⊘ This is a preview!⊘
Do you want full access?
Subscribe today to unlock all pages.
Trusted by 1+ million students worldwide
1 out of 15
Related Documents


Your All-in-One AI-Powered Toolkit for Academic Success.
+13062052269
info@desklib.com
Available 24*7 on WhatsApp / Email
![[object Object]](/_next/static/media/star-bottom.7253800d.svg)
Unlock your academic potential
Copyright © 2020–2026 A2Z Services. All Rights Reserved. Developed and managed by ZUCOL.