Accounting and Finance for Managers: Aviation Case Study
VerifiedAdded on  2023/01/10
|27
|4544
|82
Case Study
AI Summary
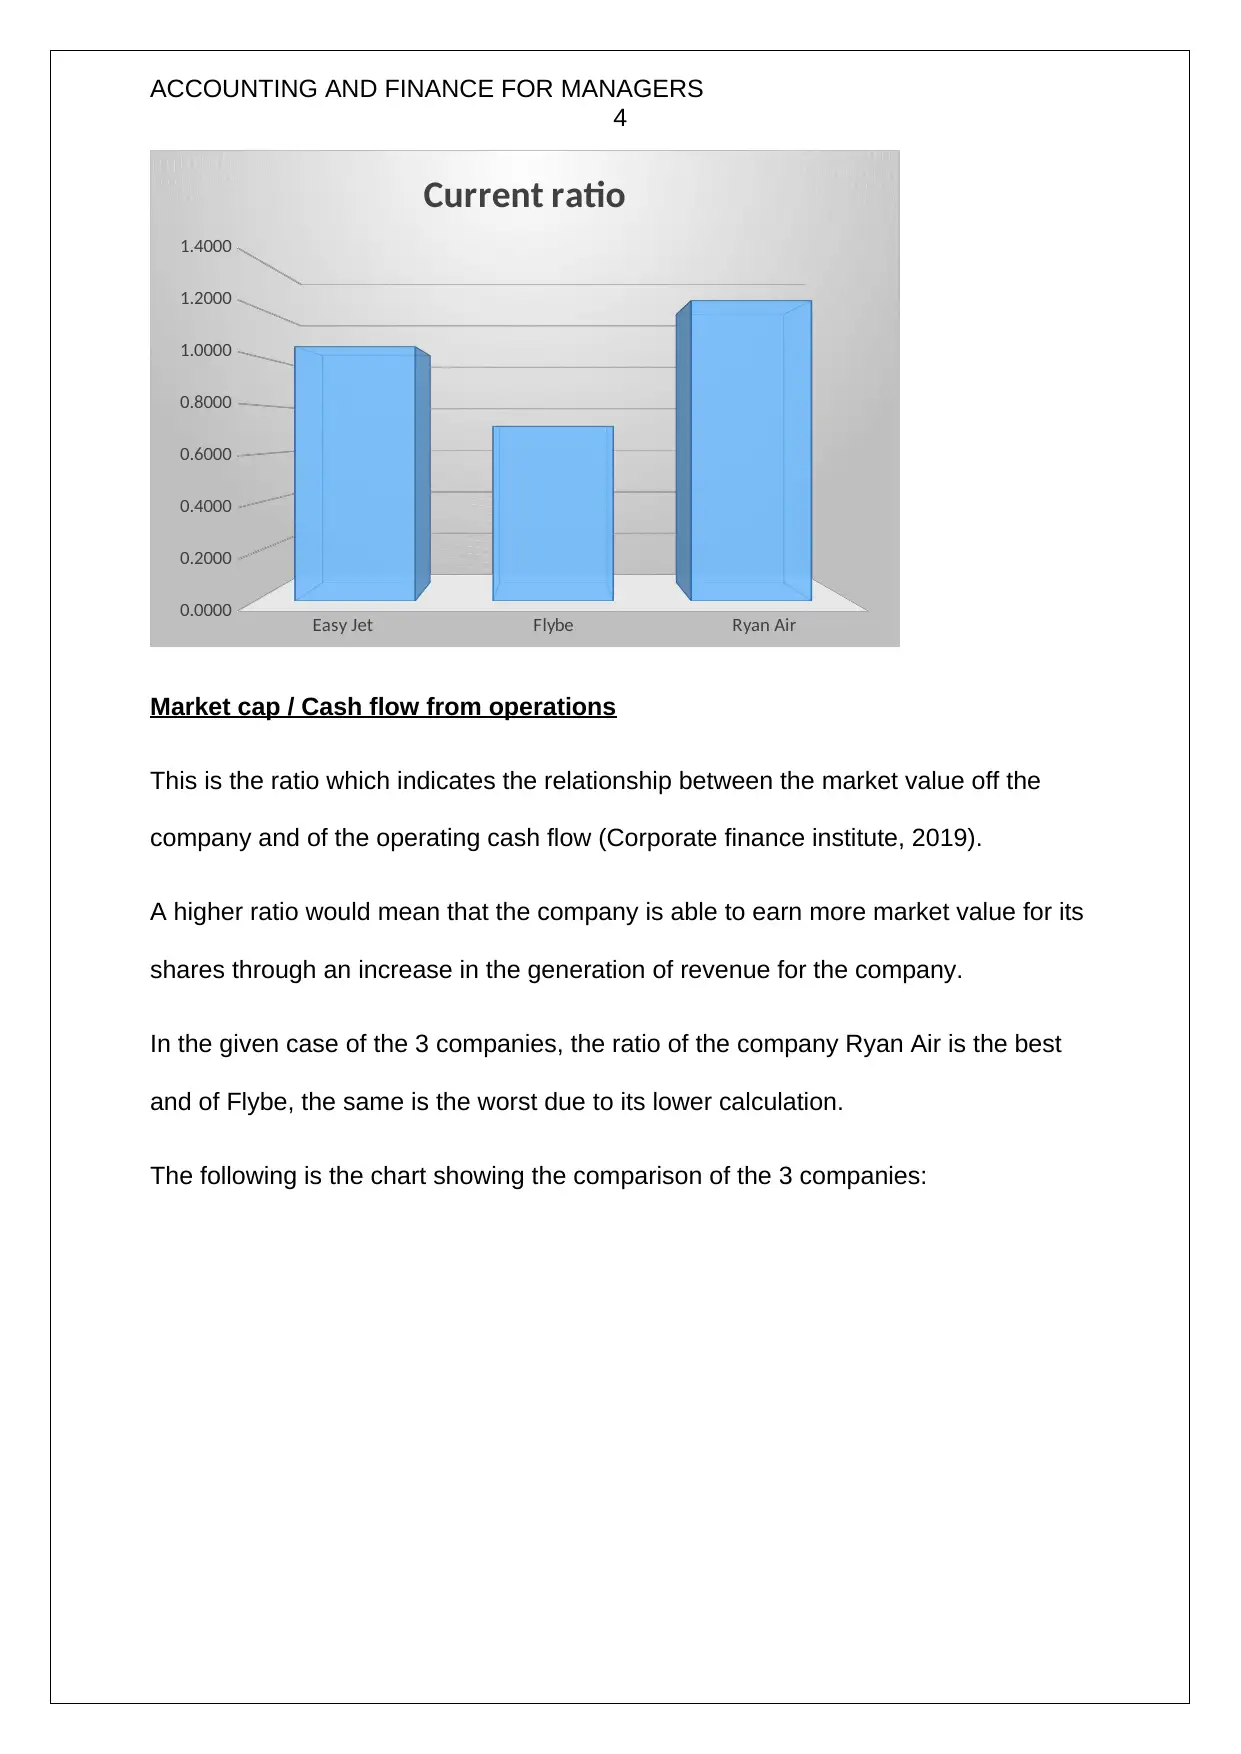
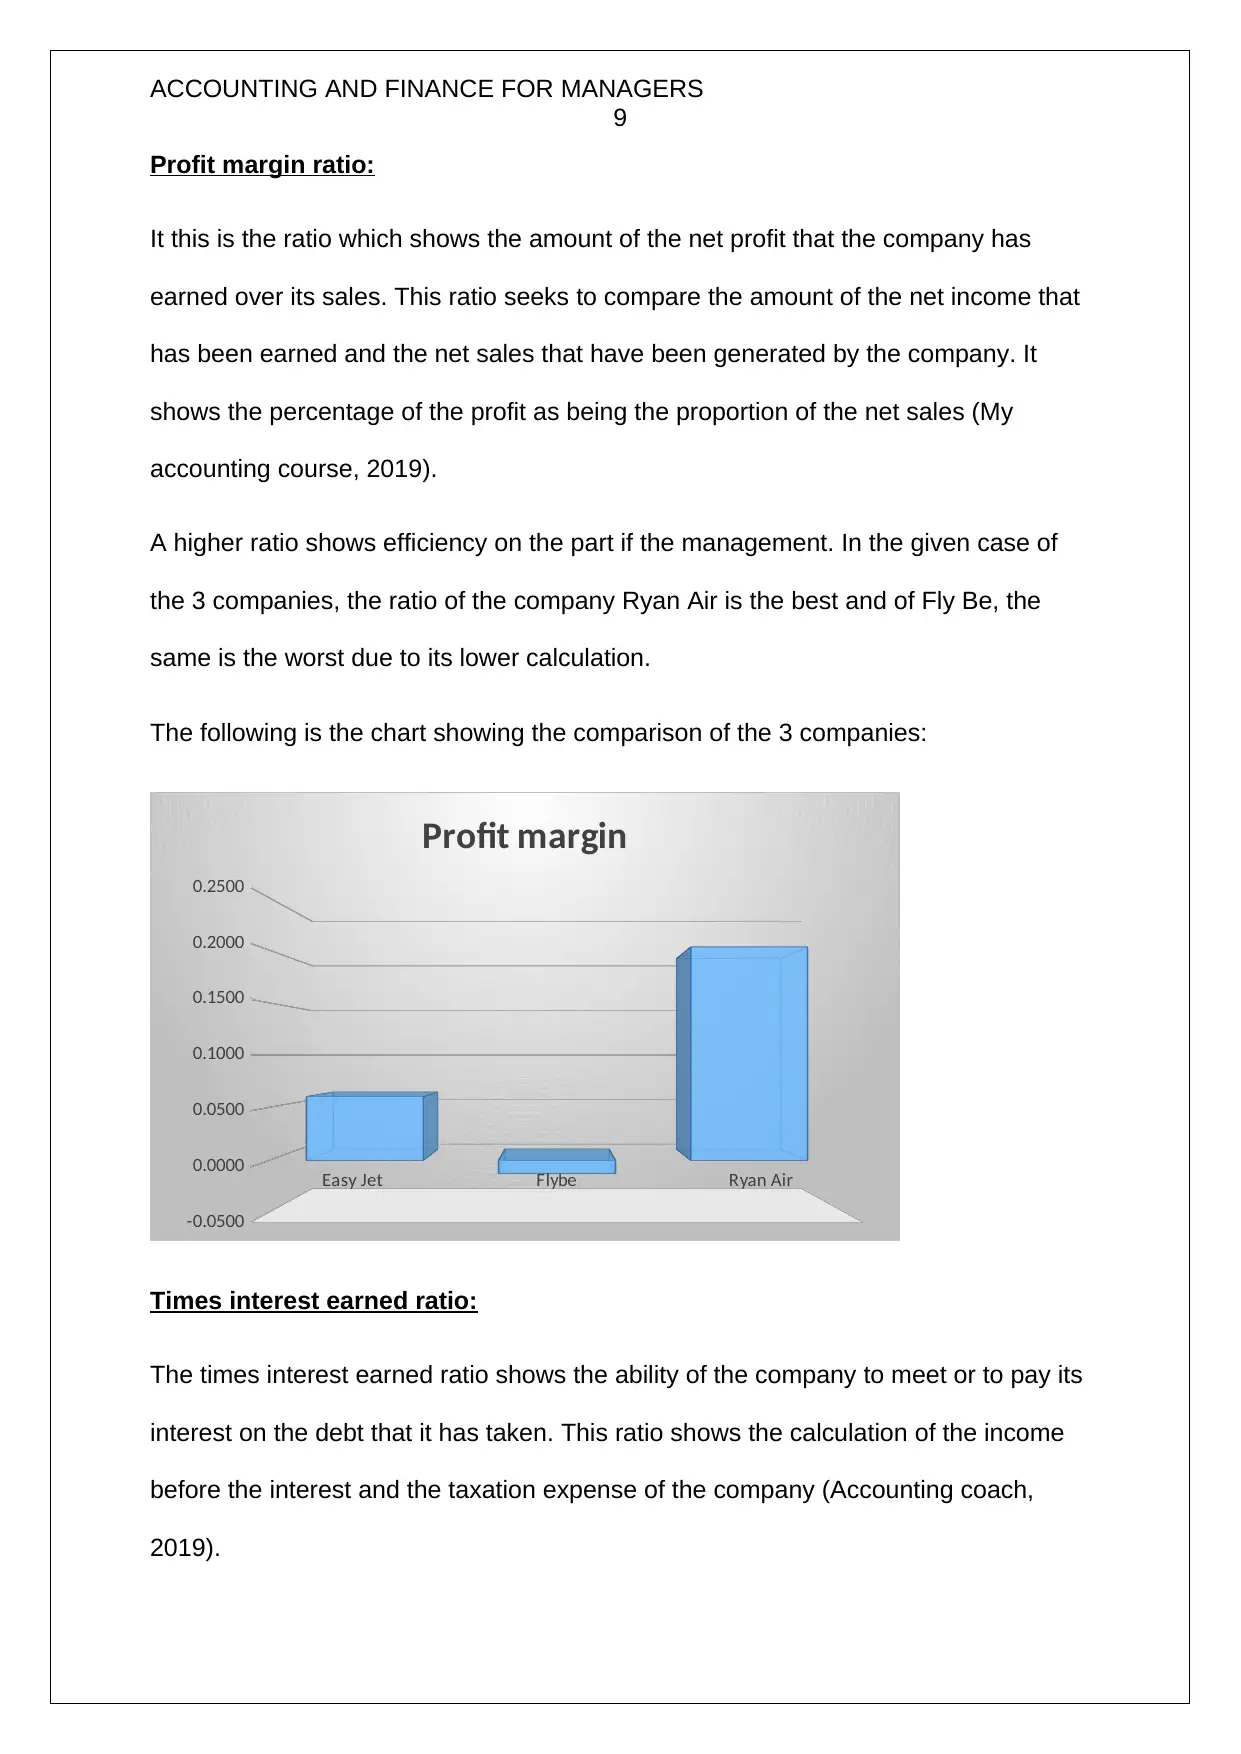
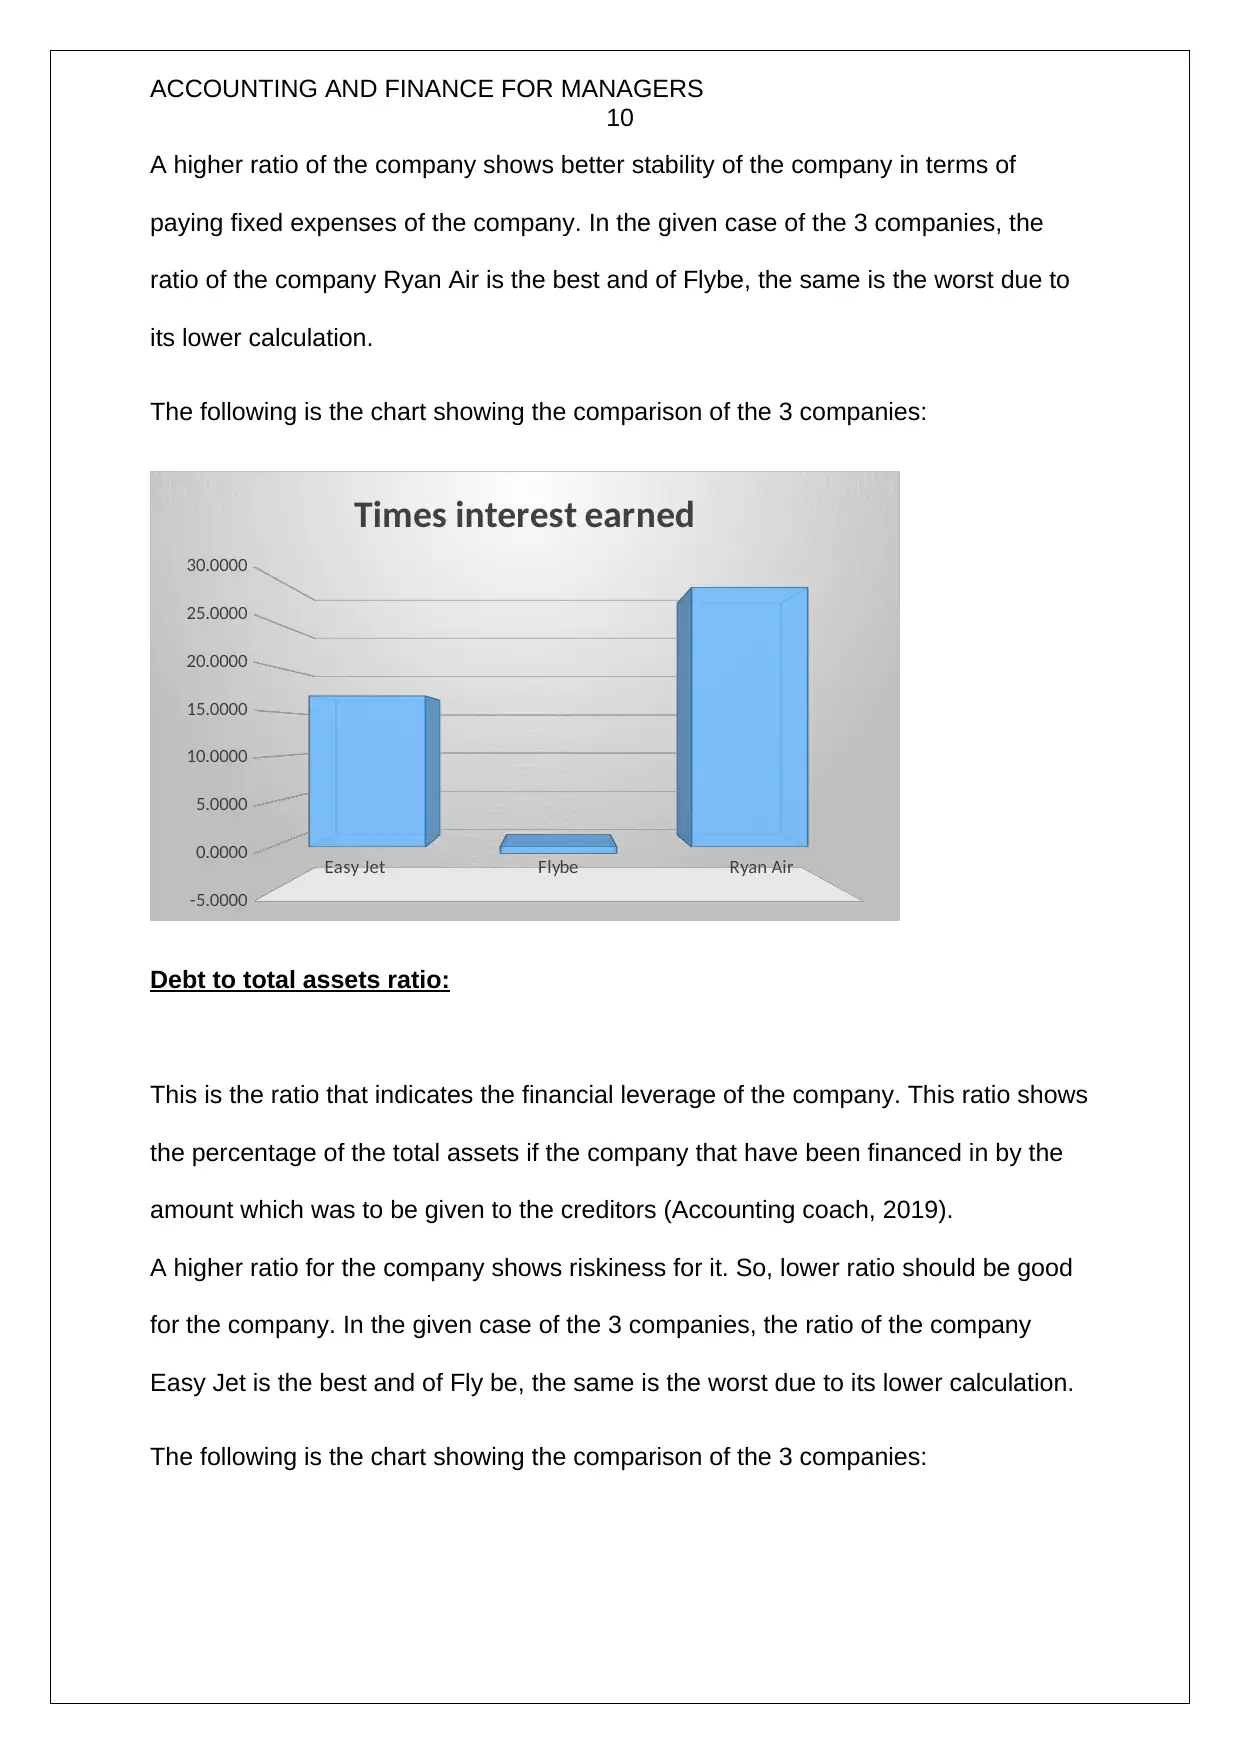
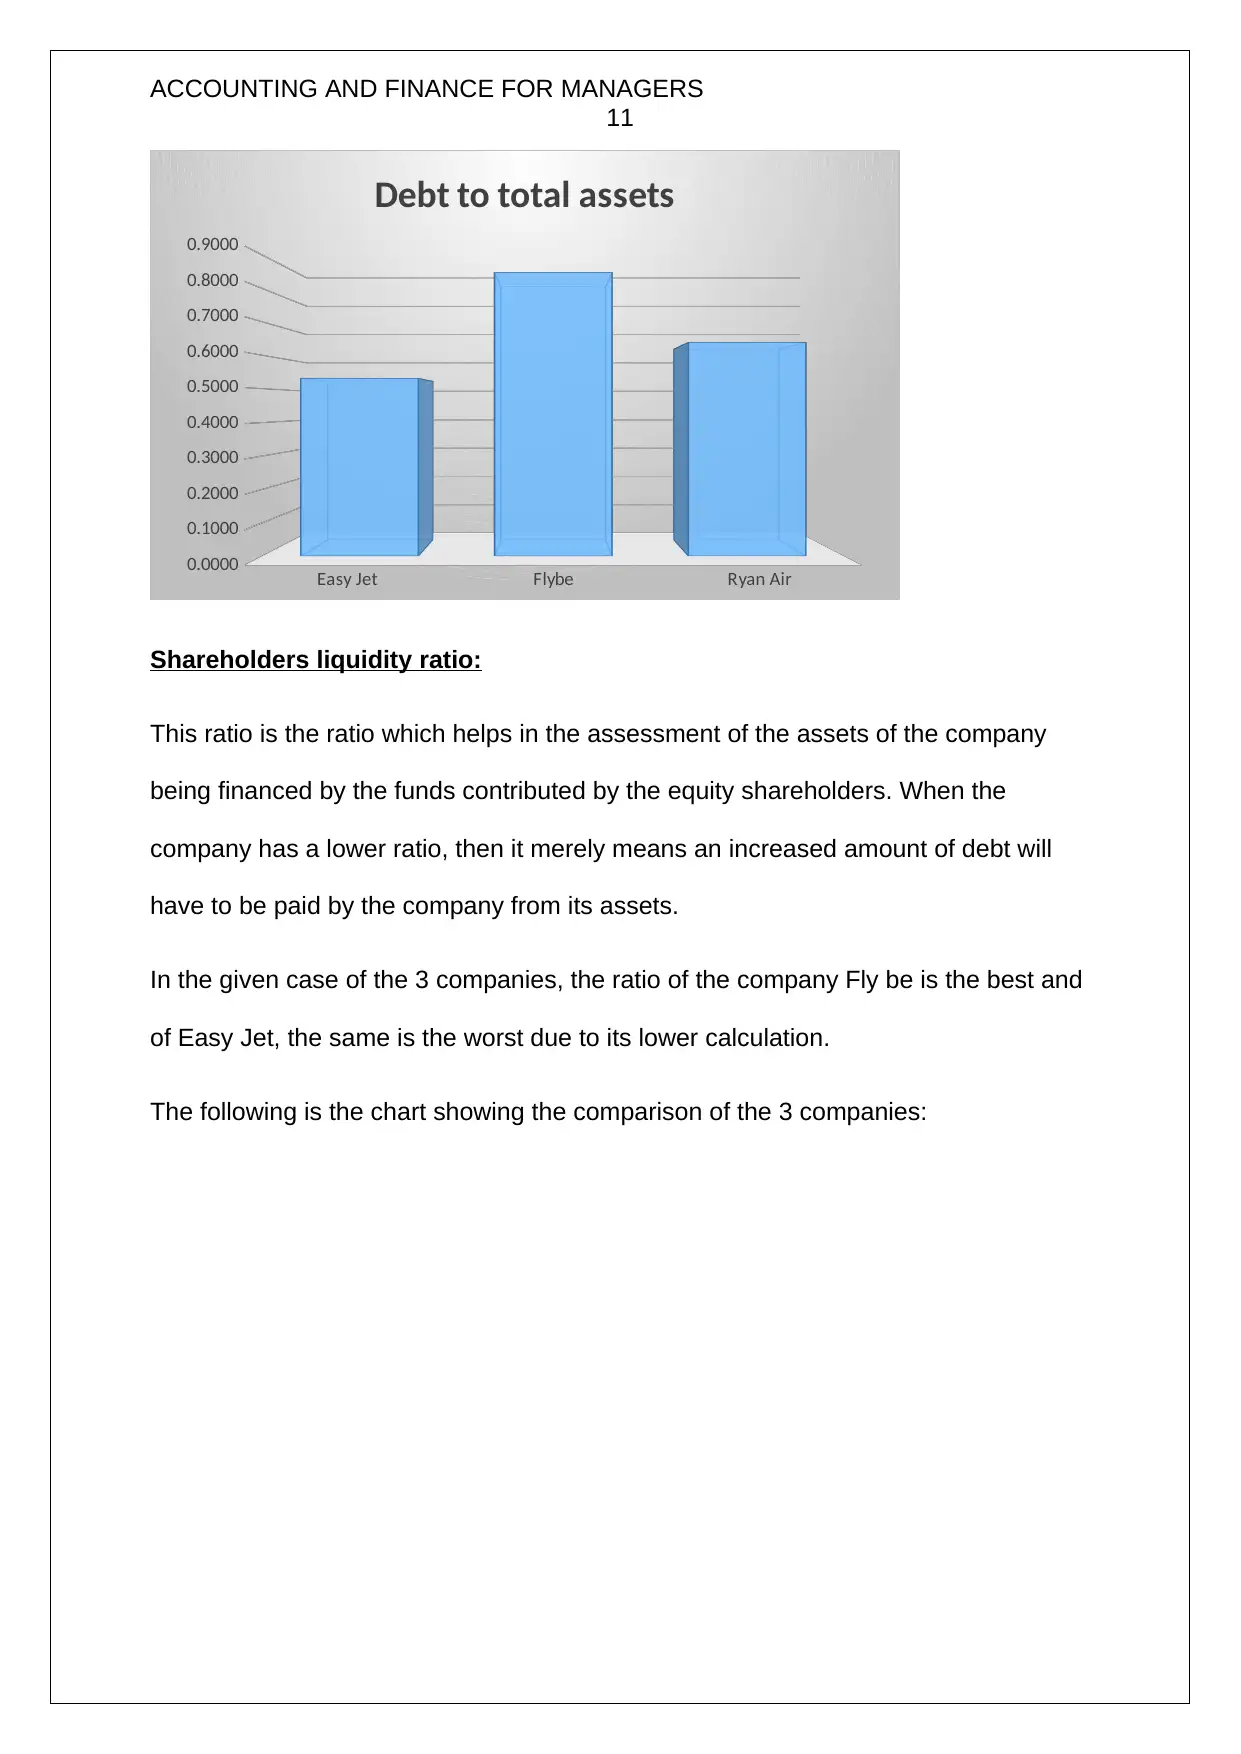
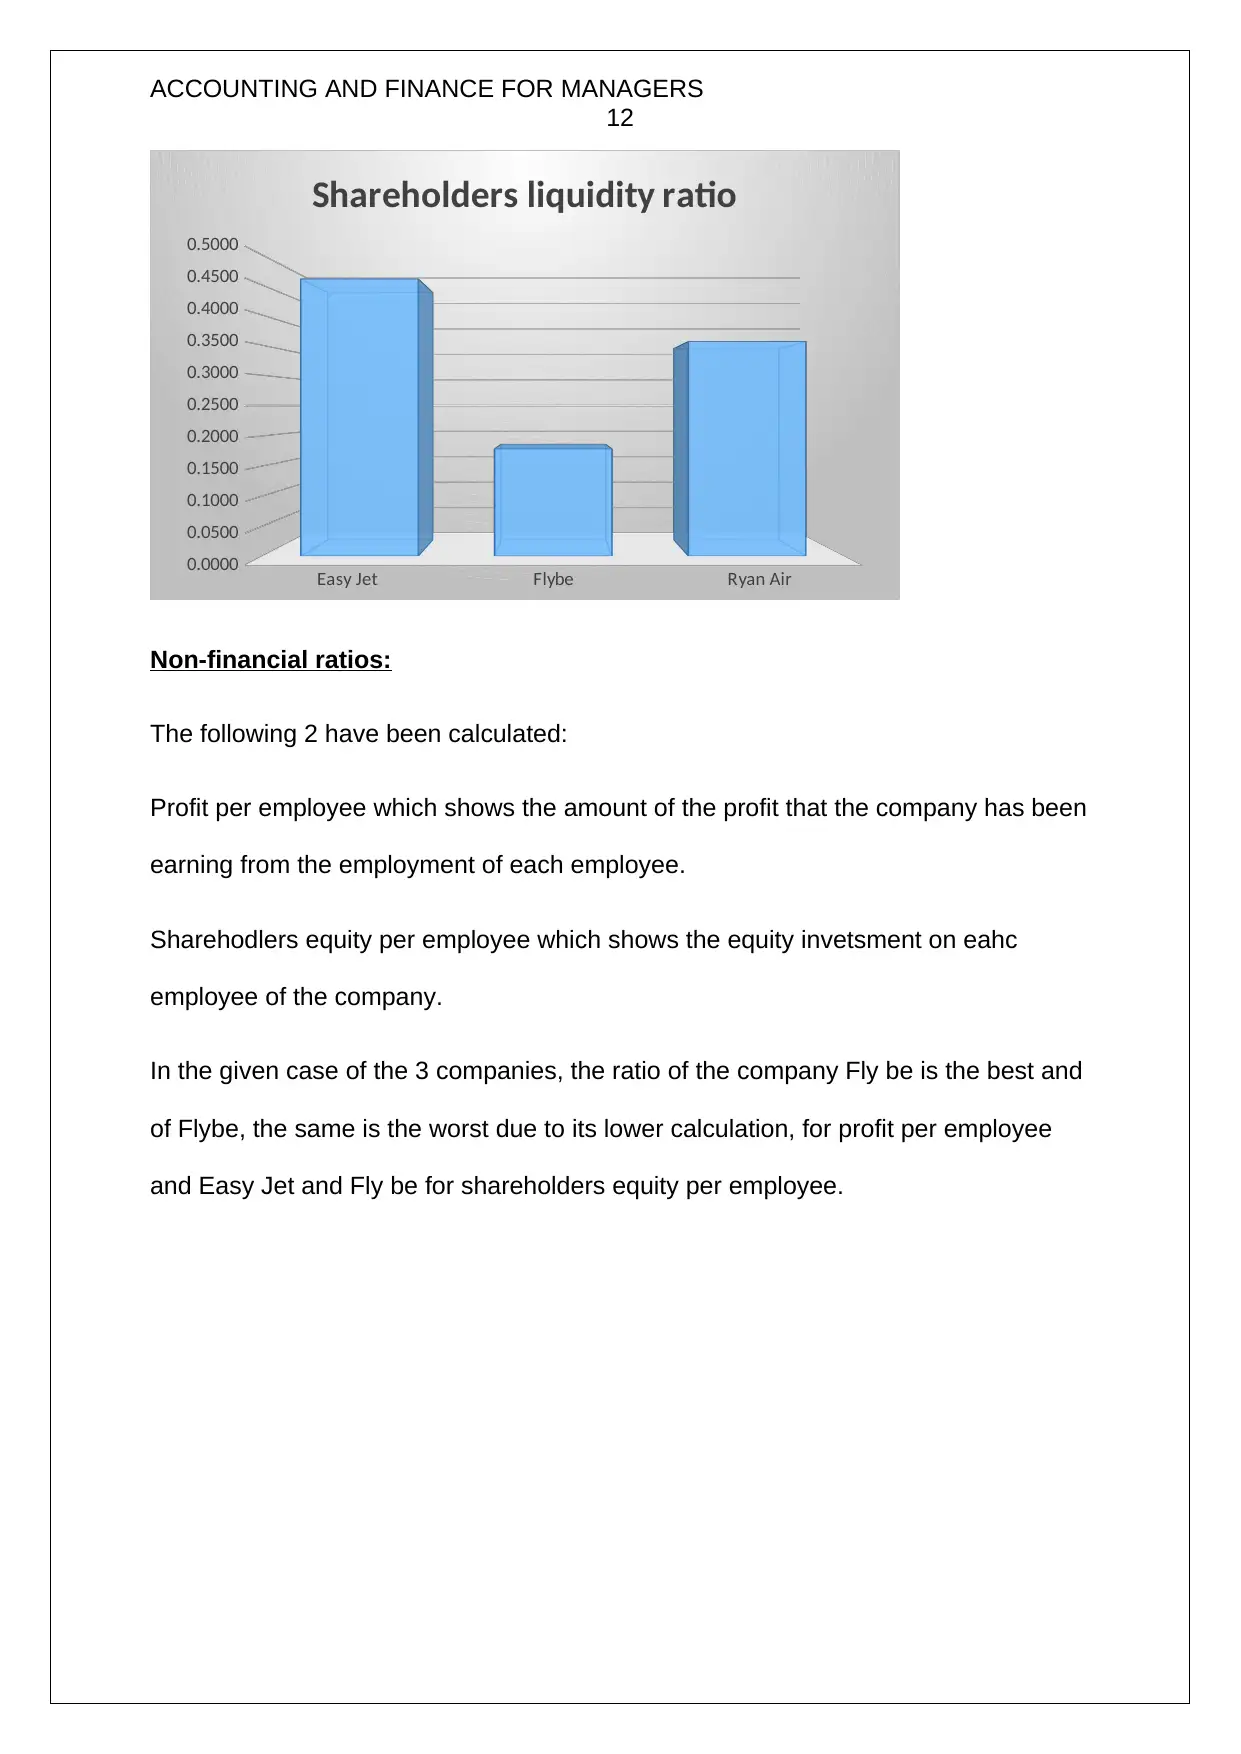
This case study analyzes the financial performance of three aviation companies: EasyJet, Flybe, and Ryan Air. The assignment begins with a detailed analysis of various financial ratios, including current ratio, market cap/cash flow from operations, receivables turnover ratio, return on shareholders’ equity, return on assets, operating expense ratio, profit margin ratio, times interest earned ratio, debt to total assets ratio, shareholders liquidity ratio, and non-financial ratios such as profit per employee and shareholders' equity per employee. The analysis is used to assess the investment viability of each company, with a focus on Ryan Air. Furthermore, the case study provides recommendations for improving the business operations of Flybe. The second part of the assignment covers capital investment techniques, including methods of evaluating investments and the steps involved in the process. The case study is based on the ACC3015 module at the University of Northampton.

ACCOUNTING AND FINANCE FOR MANAGERS
1
ACCOUNTING AND FINANCE FOR MANAGERS
1
ACCOUNTING AND FINANCE FOR MANAGERS
Secure Best Marks with AI Grader
Need help grading? Try our AI Grader for instant feedback on your assignments.

ACCOUNTING AND FINANCE FOR MANAGERS
2
Contents
Section A:.............................................................................................................................................3
Part a:...............................................................................................................................................3
Debt to total assets ratio:.............................................................................................................10
Part b:.............................................................................................................................................13
Part c:.............................................................................................................................................14
Section B:...........................................................................................................................................15
References........................................................................................................................................20
Appendix:...........................................................................................................................................22

ACCOUNTING AND FINANCE FOR MANAGERS
3
Section A:
Part a:
Financial ratios:
Current ratio:
This is the ratio which throws light on the working capital of the company and it also
helps in the measurement off the capability if the company to meet its obligations
that are of short term in nature. This the ratio which helps in the consideration of the
weight of the current assets with the weight of the current liabilities (Corporate
finance institute, 2019).
The higher this ratio, the better it is an indication of the liquidity position of the
company.
In the given case of the 3 companies, the ratio of the company Ryan Air is the best
and of Flybe, the same is the worst due to its lower calculation.
The following is the chart showing the comparison of the 3 companies:

ACCOUNTING AND FINANCE FOR MANAGERS
4
Easy Jet Flybe Ryan Air
0.0000
0.2000
0.4000
0.6000
0.8000
1.0000
1.2000
1.4000
Current ratio
Market cap / Cash flow from operations
This is the ratio which indicates the relationship between the market value off the
company and of the operating cash flow (Corporate finance institute, 2019).
A higher ratio would mean that the company is able to earn more market value for its
shares through an increase in the generation of revenue for the company.
In the given case of the 3 companies, the ratio of the company Ryan Air is the best
and of Flybe, the same is the worst due to its lower calculation.
The following is the chart showing the comparison of the 3 companies:
Secure Best Marks with AI Grader
Need help grading? Try our AI Grader for instant feedback on your assignments.

ACCOUNTING AND FINANCE FOR MANAGERS
5
Easy Jet Flybe Ryan Air
0.0000
2.0000
4.0000
6.0000
8.0000
10.0000
12.0000
Market cap/cash flow from
operations
Receivables turnover ratio:
This is an efficiency ratio which helps in the measurement of the number of times the
business is able to convert the accounts receivables into cash. Each company
requires cash so as to meet its day to day business operations. This merely means
that more cash the company has, the better is its liquidity position (My accounting
course, 2019).
Hence a higher ratio would mean better liquidity or cash position for the company.
In the given case of the 3 companies, the ratio of the company Ryan Air is the best
and of Easy Jet, the same is the worst due to its lower calculation.
The following is the chart showing the comparison of the 3 companies:

ACCOUNTING AND FINANCE FOR MANAGERS
6
Easy Jet Flybe Ryan Air
0.0000
20.0000
40.0000
60.0000
80.0000
100.0000
120.0000
140.0000
Receivables turnover
Return on shareholders’ equity:
This is the ratio that indicates the money or the return which is being earned by the
company on the money that has been invested into the company by the
shareholders of the company. They would expect some return on their investment
into the company, so this ratio helps in the measurement of that (BDC, 2019).
A higher ratio would indicate that the management of the company has been working
tirelessly towards earnings the desired amount of return.
In the given case of the 3 companies, the ratio of the company Ryan Air is the best
and of Easy Jet, the same is the worst due to its lower calculation.
The following is the chart showing the comparison of the 3 companies:

ACCOUNTING AND FINANCE FOR MANAGERS
7
Easy Jet Flybe Ryan Air
-0.1000
-0.0500
0.0000
0.0500
0.1000
0.1500
0.2000
0.2500
0.3000
0.3500
Return on ordinary shareholders'
equity
Return on assets:
This is the ratio which helps in the measurement of the net profit that has been
earned by the way of employing the net assets of the company. This ratio shows the
efficiency on the part of the management as it seeks to produce the profits that have
been earned by the company (My accounting course, 2019).
A higher ratio shows the efficiency on the part of the management when it comes to
the generation of profits. In the given case of the 3 companies, the ratio of the
company Easy Jet is the best and of Fly Be, the same is the worst due to its lower
calculation.
The following is the chart showing the comparison of the 3 companies:
Paraphrase This Document
Need a fresh take? Get an instant paraphrase of this document with our AI Paraphraser

ACCOUNTING AND FINANCE FOR MANAGERS
8
Easy Jet Flybe Ryan Air
-70.0000
-60.0000
-50.0000
-40.0000
-30.0000
-20.0000
-10.0000
0.0000
10.0000
20.0000
Return on assets
Operating expense ratio:
This is the ratio which expresses the amount of the expense incurred as the % of
operating revenue for the company and hence, the lower this ratio, the more would
be the profit for the company (Accounting for management, 2019).
In the given case of the 3 companies, the ratio of the company Flybe is the best and
of Easy Jet, the same is the worst due to its lower calculation.
The following is the chart showing the comparison of the 3 companies:
Easy Jet Flybe Ryan Air
0.0000
0.2000
0.4000
0.6000
0.8000
1.0000
1.2000
Operating expense ratio

ACCOUNTING AND FINANCE FOR MANAGERS
9
Profit margin ratio:
It this is the ratio which shows the amount of the net profit that the company has
earned over its sales. This ratio seeks to compare the amount of the net income that
has been earned and the net sales that have been generated by the company. It
shows the percentage of the profit as being the proportion of the net sales (My
accounting course, 2019).
A higher ratio shows efficiency on the part if the management. In the given case of
the 3 companies, the ratio of the company Ryan Air is the best and of Fly Be, the
same is the worst due to its lower calculation.
The following is the chart showing the comparison of the 3 companies:
Easy Jet Flybe Ryan Air
-0.0500
0.0000
0.0500
0.1000
0.1500
0.2000
0.2500
Profit margin
Times interest earned ratio:
The times interest earned ratio shows the ability of the company to meet or to pay its
interest on the debt that it has taken. This ratio shows the calculation of the income
before the interest and the taxation expense of the company (Accounting coach,
2019).

ACCOUNTING AND FINANCE FOR MANAGERS
10
A higher ratio of the company shows better stability of the company in terms of
paying fixed expenses of the company. In the given case of the 3 companies, the
ratio of the company Ryan Air is the best and of Flybe, the same is the worst due to
its lower calculation.
The following is the chart showing the comparison of the 3 companies:
Easy Jet Flybe Ryan Air
-5.0000
0.0000
5.0000
10.0000
15.0000
20.0000
25.0000
30.0000
Times interest earned
Debt to total assets ratio:
This is the ratio that indicates the financial leverage of the company. This ratio shows
the percentage of the total assets if the company that have been financed in by the
amount which was to be given to the creditors (Accounting coach, 2019).
A higher ratio for the company shows riskiness for it. So, lower ratio should be good
for the company. In the given case of the 3 companies, the ratio of the company
Easy Jet is the best and of Fly be, the same is the worst due to its lower calculation.
The following is the chart showing the comparison of the 3 companies:
Secure Best Marks with AI Grader
Need help grading? Try our AI Grader for instant feedback on your assignments.

ACCOUNTING AND FINANCE FOR MANAGERS
11
Easy Jet Flybe Ryan Air
0.0000
0.1000
0.2000
0.3000
0.4000
0.5000
0.6000
0.7000
0.8000
0.9000
Debt to total assets
Shareholders liquidity ratio:
This ratio is the ratio which helps in the assessment of the assets of the company
being financed by the funds contributed by the equity shareholders. When the
company has a lower ratio, then it merely means an increased amount of debt will
have to be paid by the company from its assets.
In the given case of the 3 companies, the ratio of the company Fly be is the best and
of Easy Jet, the same is the worst due to its lower calculation.
The following is the chart showing the comparison of the 3 companies:

ACCOUNTING AND FINANCE FOR MANAGERS
12
Easy Jet Flybe Ryan Air
0.0000
0.0500
0.1000
0.1500
0.2000
0.2500
0.3000
0.3500
0.4000
0.4500
0.5000
Shareholders liquidity ratio
Non-financial ratios:
The following 2 have been calculated:
Profit per employee which shows the amount of the profit that the company has been
earning from the employment of each employee.
Sharehodlers equity per employee which shows the equity invetsment on eahc
employee of the company.
In the given case of the 3 companies, the ratio of the company Fly be is the best and
of Flybe, the same is the worst due to its lower calculation, for profit per employee
and Easy Jet and Fly be for shareholders equity per employee.

ACCOUNTING AND FINANCE FOR MANAGERS
13
Easy Jet Flybe Ryan Air
-20
0
20
40
60
80
100
Profit per employee
Easy Jet Flybe Ryan Air
0
50
100
150
200
250
300
Shareholders equity per employee
Part b:
From the above calculations, it could be seems that investment would be viable in
Ryan Air due to the reason that it has more profit margin when compared amongst
the other 3 companies. An investment in the company could be made by the
company if it has potentiality in the future and it has the ability of generating profits in
the future as well. This is good for the company and also, Ryan Air would be viable
due to the following reasons:
Paraphrase This Document
Need a fresh take? Get an instant paraphrase of this document with our AI Paraphraser

ACCOUNTING AND FINANCE FOR MANAGERS
14
ď‚· More profit per employee which shows efficiency of the management
ď‚· Current ratio which shows increased liquidity position of the company which
means cash availability in its hand
ď‚· Increased market capitalisation to cash flow ratio which shows increased
liquidity position of the company which means cash availability in its hand
ď‚· Increased accounts receivables turnover ratio which means increased ability
of the company to generate cash from the accounts receivables
 Increased return on shareholders’ equity turnover ratio which means
increased ability of the company to generate return on investment made by
the shareholders
ď‚· Increased profit margin earned which means efficiency on the part of the
management
Part c:
From the above, it could be stated that Flybe needs a major improvement in its
business operations. The following are few of the ways through which the business
operations could be improved:
ď‚· Increase in sales revenue through advertising, offering better quality products
and services, like offering discounts in early bookings etc
ď‚· Lower the cost of generating the sales revenue, like offering lesser services to
the passengers on board
ď‚· Look for options to get cheaper fuels or get discounts
ď‚· Look for ways through which the wastages could be eliminated in full.

ACCOUNTING AND FINANCE FOR MANAGERS
15
Section B:
To: B
From: A
Re: Capital investment techniques and steps
Date: July 12, 2019
Question presented: methods of evaluating the investments and the steps followed
The decisions of capital investments are also known as the capital budgeting. These
are the decisions that aims at allotting the funds of the capital investment in the
manner in which the project is able to give return to the company. The assessment
of the project along with the allocation of the capital depends upon the requirements
of the projects which form s a critical part of the investment decision for the
company.
There could be some different ways of assessing the different capital investments
being made by the company. In order to illustrate, one company could go for the
projects that ensures returns for the company but then there could be others that
look for a lower payback period. There could be some other companies that may go
for the projects that may give losses but are good from the long term perspective.
The main focus of the companies is to increase the value of the company by the way
of taking on a good project at the perfect time. The power of this study is the fact that
it permits the taking up if the capital investment must be undertaken by the company
or not. The company needs to make sure that it allocates its scarce resources to the
project that would be beneficial for the company. The company has to accomplish its
strategic goals so as to make their strategic capital investments. These are the kinds

ACCOUNTING AND FINANCE FOR MANAGERS
16
of the decisions that are connected with the capital investment decisions like the
construction of the new factory etc. (Capital investment, 2019). The main aim of the
company when it comes to making an investment into the project is the maximisation
of the wealth of the shareholders and to be able to do this, the company requires the
acquisition of the assets and profits and for this, the company needs to know the
projects time high it should make an investment. There are many ways of assessing
the projects listed down in the next part. These decisions are regulated through a
procedure which helps in rating and identifying the capital investments being made
by the company.
Each company follows a very procedure of assessing its capital investment making
decision:
ď‚· Identification of the project involves the assessment of each project of the
company
ď‚· Definition of the project and screening.
ď‚· Analysis and accepting of the decision based upon the analysis of each
investment.
ď‚· Implementation of the project
ď‚· Monitoring of the activities involved in the project
Post audit to ascertain the audit of the activities that have been undertaken for the
purposes of the project (Student share, 2019).
Majority of the capital investments that are made by the company have to be
reached within a limited amount if time and with a limited amount of information and
this requires the need of these capital investment assessment techniques. The
Secure Best Marks with AI Grader
Need help grading? Try our AI Grader for instant feedback on your assignments.

ACCOUNTING AND FINANCE FOR MANAGERS
17
activities that are undertaken by the company inside affect the capital investment
decisions being made by it.
The decision pertaining to the acceptance or the rejection of the project is
regularised by more than 2 components. This is mainly due to the fact that the main
reasons behind making an investment is the fact that it does not involve merely the
substitution of the old equipment with new equipment, it means replacement of the
existing procedure with the new one. There are some of the factors that effect these
decisions being made by the company. These include the outlook of the
management, the opportunities that are created for the company due to the changes
taking place in the technology, the started adopted by the competitors, the forecast
of the market, cash flows of the company, fiscal incentives etc. (Bayt, 2019).
The following are the appraisal techniques for the purposes of assessing the capital
investment for the company:
1. Net present value which is the technique of investment appraisal that seeks to
measure the cash inflows, whether the same is in excess or shortfall of the
investment which has bene made into the company. The main aim of each
company is the maximisation of the net present value amount. The calculation
of net present value seeks the consideration if the net cash flows at the
present time with t and the same is to be discounted by using the cost of
capital. A higher rate of the interest rate shows an increase in the discount
rate over the period of time and the maximum number of the investment
appraisals shall be accordingly increased (E finance management, 2019).
2. Accounting rate of return seeks to compare the amount of the profit that has
been earned by the way of investing money into the project. The company

ACCOUNTING AND FINANCE FOR MANAGERS
18
shall consider and go for the project that would give a higher rate of return to
the company when compared with the lower rate of return for the company in
term of the other projects. This is a non disjointed capital investment appraisal
method that does not consider the time value of money which is involved in
the project (Michael Raunch, 2019).
3. Internal rate of return is the rate of return that the company would earn if it
invests the money in its business. This is the discount rate that gives the
value of investment along with the cash inflow to 0. This is considered to be
the measure which helps in the measurement of the efficiency of the
investment. Hence the project shall be accepted only when the cost of capital
of the investment is more than the internal rate of return. If the company has a
low cost of capital, then there shall be more chances of being accepted. Both
the internal rate of return and the net present values are very much different
from one and return.
4. Modified internal rate of return: this is the return on the investment that
measures the actual annual profitability of the investment. This is different
from the internal rate of return since this technique does not consider the
intermediate cash flows that would be invested into the business at the
internal rate of return. An advantage of this is the fact that it is a better
technique due to the fact that the internal rate of return is low. Further, the
above flaw could be overcome by the use of this technique of appraisal.
5. Adjusted present value: this is the technique which helps in overcoming the
disadvantages of the technique of net present value and it further helps in the
evaluation of the risks that are associated with the company which is thinking
of making that investment.

ACCOUNTING AND FINANCE FOR MANAGERS
19
6. Profitability index: this technique helps in the evaluation of each project on the
basis if the value per unit of the investment. This technique is also termed as
value investment ratio and the profit investment ration (Capital investment,
2019).
7. Equivalent annuity: this is the technique that compares the projects with the
unequal lives. When there are 2 projects that have the different lives, then
these projects cannot be compared due to the reasons that they have unequal
lives but with the use of this technique, these projects could be compared.
8. Payback period: this is the technique which helps in the evaluation of the
project on the basis if the initial investment that has been made into the
project. This is one of the easiest method of evaluating the investment.
Further, the projects that have a shorter payback period are considered over
the ones with the longer period.
9. Discounted payback period: this technique is very much similar to the
payback period but with an exception that this technique considers the time
value of money and the discounted flow of cash.
10. Real option analysis: this is the technique which uses the real option analysis
which takes into account the various different options that the managers
would have while management of the project in the terms of the increase in
the amount of the cash.
The above stated technique are used for the purposes of evaluating the various
projects and for the purposes of ranking the projects. A project is accepted only
when its financial viability is deemed positive by the company.
Paraphrase This Document
Need a fresh take? Get an instant paraphrase of this document with our AI Paraphraser

ACCOUNTING AND FINANCE FOR MANAGERS
20
References
Accounting for Management. (2019). Gross profit (GP) ratio - explanation, formula,
example and interpretation | Accounting for Management. [online] Available at:
https://www.accountingformanagement.org/gross-profit-ratio/ [Accessed 23 May
2019].
AccountingCoach.com. (2019). What is the debt to total assets ratio? |
AccountingCoach. [online] Available at: https://www.accountingcoach.com/blog/debt-
to-total-assets-ratio [Accessed 23 May 2019].
AccountingCoach.com. (2019). What is the times interest earned ratio? |
AccountingCoach. [online] Available at:
https://www.accountingcoach.com/blog/times-interest-earned [Accessed 23 May
2019].
Bayt.com. (2019). Can you explain the key stages in the capital investment decision-
making process? - Bayt.com Specialties. [online] Available at:
https://specialties.bayt.com/en/specialties/q/296846/can-you-explain-the-key-stages-
in-the-capital-investment-decision-making-process/ [Accessed 23 May 2019].
BDC. (2019). What is the return on shareholders’ equity ratio. [online] Available at:
https://www.bdc.ca/en/articles-tools/entrepreneur-toolkit/templates-business-
guides/glossary/pages/return-on-shareholders-equity-ratio.aspx [Accessed 23 May
2019].
Capital Investment. (2019). Capital Investment Appraisal - Capital Investment.
[online] Available at: https://www.capital-investment.co.uk/capital-investment-
appraisal/ [Accessed 23 May 2019].

ACCOUNTING AND FINANCE FOR MANAGERS
21
Capital Investment. (2019). Capital Investment Decisions - Capital Investment.
[online] Available at: https://www.capital-investment.co.uk/capital-investment-
decisions/ [Accessed 23 May 2019].
Corporate Finance Institute. (2019). Current Ratio Formula - Examples, How to
Calculate Current Ratio. [online] Available at:
https://corporatefinanceinstitute.com/resources/knowledge/finance/current-ratio-
formula/ [Accessed 23 May 2019].
Corporate Finance Institute. (2019). Price-to-Cash Flow Ratio - Overview, Formula,
and Applications. [online] Available at:
https://corporatefinanceinstitute.com/resources/knowledge/finance/price-to-cash-
flow-ratio/ [Accessed 23 May 2019].
eFinanceManagement.com. (2019). Investment Appraisal Techniques | Payback,
ARR, NPV, IRR, PI. [online] Available at:
https://efinancemanagement.com/investment-decisions/investment-appraisal-
techniques [Accessed 23 May 2019].
My Accounting Course. (2019). Accounts Receivable Turnover Ratio | Formula |
Analysis | Example. [online] Available at:
https://www.myaccountingcourse.com/financial-ratios/accounts-receivable-turnover-
ratio [Accessed 23 May 2019].
My Accounting Course. (2019). Profit Margin Ratio | Analysis | Formula | Example.
[online] Available at: https://www.myaccountingcourse.com/financial-ratios/profit-
margin-ratio [Accessed 23 May 2019].

ACCOUNTING AND FINANCE FOR MANAGERS
22
My Accounting Course. (2019). Return on Assets Ratio - ROA | Analysis | Formula |
Example. [online] Available at: https://www.myaccountingcourse.com/financial-
ratios/return-on-assets [Accessed 23 May 2019].
Studentshare. (2019). The Keys Stages in the Capital Investment Decision-Making
Process Essay. [online] Available at:
https://studentshare.org/finance-accounting/1463521-the-keys-stages-in-the-capital-
investment-decision-making-process [Accessed 23 May 2019].
www.michaelrauch.net. (2019). Methods for investment appraisal. [online] Available
at: https://www.michaelrauch.net/2012/01/methods-for-investment-appraisal/
[Accessed 23 May 2019].
Appendix:
e Name of the
ratio
Formula
Easy
Jet
Flyb
e
Ryan
Air Ranking
Categor
y
in
GBP
in
GBP
in
GBP Best
Wors
t
Liquidity Current ratio Current
assets
17,34
,000
1,95,
500
36,70,
499
Current
liabilities
16,70
,000
2,74,
500
29,90,
462
Ratio Ratio Ratio
1.038
3
0.712
2
1.2274 Ryan
Air
Flyb
e
Secure Best Marks with AI Grader
Need help grading? Try our AI Grader for instant feedback on your assignments.

ACCOUNTING AND FINANCE FOR MANAGERS
23
Market cap /
Cash flow from
operations
Market
capitalisatio
n
44,86
,023
1,39,
979
185,49
,179
Cash flows
from
operations
5,00,
000
43,70
0
17,62,
260
Ratio Ratio Ratio
8.972
0
4.530
0
10.525
8
Ryan
Air
Flyb
e
Net Credit
Sales
50,47
,000
7,52,
600
62,65,
872
Average net
receivables
74,00
0 6,950 48,545
Receivables
turnover
Ratio Ratio Ratio
68.20
27
108.2
878
129.07
48
Ryan
Air
Easy
Jet
Profitabil
ity
Return on
ordinary
shareholders'
equity
Profit after
tax
3,05,
000
-
9,400
12,70,
699
Average
ordinary
shareholder
s' equity
27,48
,000
1,09,
000
38,56,
545

ACCOUNTING AND FINANCE FOR MANAGERS
24
Ratio Ratio Ratio
0.111
0
-
0.086
2 0.3295
Ryan
Air
Flyb
e
Return on
assets
Profit after
tax
3,05,
000
-
9,400
12,70,
699
Average
total assets
57,27
,500
6,33,
800
105,62
,685
Ratio Ratio Ratio
18.77
87
-
67.42
55 8.3125
Easy
Jet
Flyb
e
Operating
expense ratio
Opertaing
expenses
9,76,
000
7,82,
300
48,04,
945
Sales
revenue
50,47
,000
7,52,
600
62,65,
872
Ratio Ratio Ratio
0.193
4
1.039
5 0.7668
Flyb
e
Easy
Jet
Profit margin Profit after
tax
3,05,
000
-
9,400
12,70,
699
Net Sales 50,47 7,52, 62,65,

ACCOUNTING AND FINANCE FOR MANAGERS
25
,000 600 872
Ratio Ratio Ratio
0.060
4
-
0.012
5 0.2028
Ryan
Air
Flyb
e
Solvenc
y
Times interest
earned
Profit before
interest &
tax
3,85,
000
-
9,400
14,11,
858
Interest
expense
23,00
0
12,80
0 49,068
Ratio Ratio Ratio
16.73
91
-
0.734
4
28.773
5
Ryan
Air
Flyb
e
Debt to total
assets
Total
liabilities
31,69
,000
5,18,
600
69,15,
941
Total assets
59,71
,000
6,11,
700
108,31
,695
Ratio Ratio Ratio
0.530
7
0.847
8 0.6385
Easy
Jet
Flyb
e
Miscella Shareholders Shareholder 27,48 1,09, 38,56,
Paraphrase This Document
Need a fresh take? Get an instant paraphrase of this document with our AI Paraphraser

ACCOUNTING AND FINANCE FOR MANAGERS
26
neous liquidity ratio
s equity ,000 000 545
Total assets
59,71
,000
6,11,
700
108,31
,695
Ratio Ratio Ratio
0.460
2
0.178
2 0.3560
Flyb
e
Easy
Jet
Profit per
employee
Profit after
taxes 3,05,000 -9,400
12,70,69
9
Number of
employees 9,242 2,350 13,100
Ratio Ratio Ratio
Shareholders
equity per
employee
33 -4 97
Ryan
Air
Flyb
e
Shareholders
equity
27,48,00
0
1,09,00
0
38,56,54
5
Number of
employees 9,242 2,350 13,100
Ratio Ratio Ratio
297 46 294 Easy Fly

ACCOUNTING AND FINANCE FOR MANAGERS
27
Jet be
27
Jet be
1 out of 27
Related Documents

Your All-in-One AI-Powered Toolkit for Academic Success.
 +13062052269
info@desklib.com
Available 24*7 on WhatsApp / Email
Unlock your academic potential
© 2024  |  Zucol Services PVT LTD  |  All rights reserved.