ACC306 - Financial Statement Analysis: Stockland Corporation Limited
VerifiedAdded on 2023/06/10
|14
|3991
|313
Report
AI Summary
This report provides a detailed financial analysis of Stockland Corporation Limited, evaluating its performance over the past three years. It uses ratio analysis to assess profitability, efficiency, liquidity, and capital structure. The analysis reveals that while the company has improved its profitability and efficiency, its capital structure carries a high debt portion, posing potential financial leverage risks. The report further assesses the company's long-term solvency and liquidity position, indicating a generally positive outlook due to increased profitability. The report concludes by touching upon the quality of financial statements and recommending that Stockland establish an equilibrium between its cost of capital, debt portion, and profitability to optimize its financial health. Access this and similar solved assignments and past papers on Desklib.
Stockland Corporation Limited
Financial Management
Financial analysis
Name of the Author
[Pick the date]
Financial Management
Financial analysis
Name of the Author
[Pick the date]
Paraphrase This Document
Need a fresh take? Get an instant paraphrase of this document with our AI Paraphraser
Executive Summary
Each and every organization needs to use the proper financial tools to make the
effective financial decisions. In this report, Stockland Corporation Company has been
selected. This company has faced high loss due to the sluggish market condition. In addition
to this, company has also faced high downward slope in its share prices which reflects that
shareholders who invested their capital in this company had high amount of loss since last
three years. In addition to this, capital structure of company is also not effective which
reflects that company needs to lower down debt portion in its capital to mitigate the financial
risk. Company might fail to cover its interest coverage from its earnings before interest and
tax due to its less profitability from its business. In context with the efficiency of the
company, it has also failed to deploy its funds effectively which has increased the overall cost
of capital throughout the time
Table of Contents
Executive Summary...............................................................................................................................1
INTRODUCTION.................................................................................................................................2
Description of company.....................................................................................................................2
Task-1....................................................................................................................................................2
Assess the company’s performance over the last three years..............................................................2
Assessment of the financial position of company..............................................................................4
PROFITABILITY RATIOS..............................................................................................................4
EFFECIENCY RATIO OR ACTIVITY RATIO...............................................................................4
LIQUIDITY RATIOS.......................................................................................................................4
CAPITAL STRUCTURE RATIOS...................................................................................................5
Task-2....................................................................................................................................................5
Long-term solvency of the company over the last three years..............................................................5
Task-3....................................................................................................................................................7
Assess the liquidity position of the company as at the latest financial year......................................7
Liquidity position of Stockland.........................................................................................................7
Task-4....................................................................................................................................................8
Discuss the quality of financial statement.............................................................................................8
Conclusion.............................................................................................................................................9
References...........................................................................................................................................11
⊘ This is a preview!⊘
Do you want full access?
Subscribe today to unlock all pages.
Trusted by 1+ million students worldwide
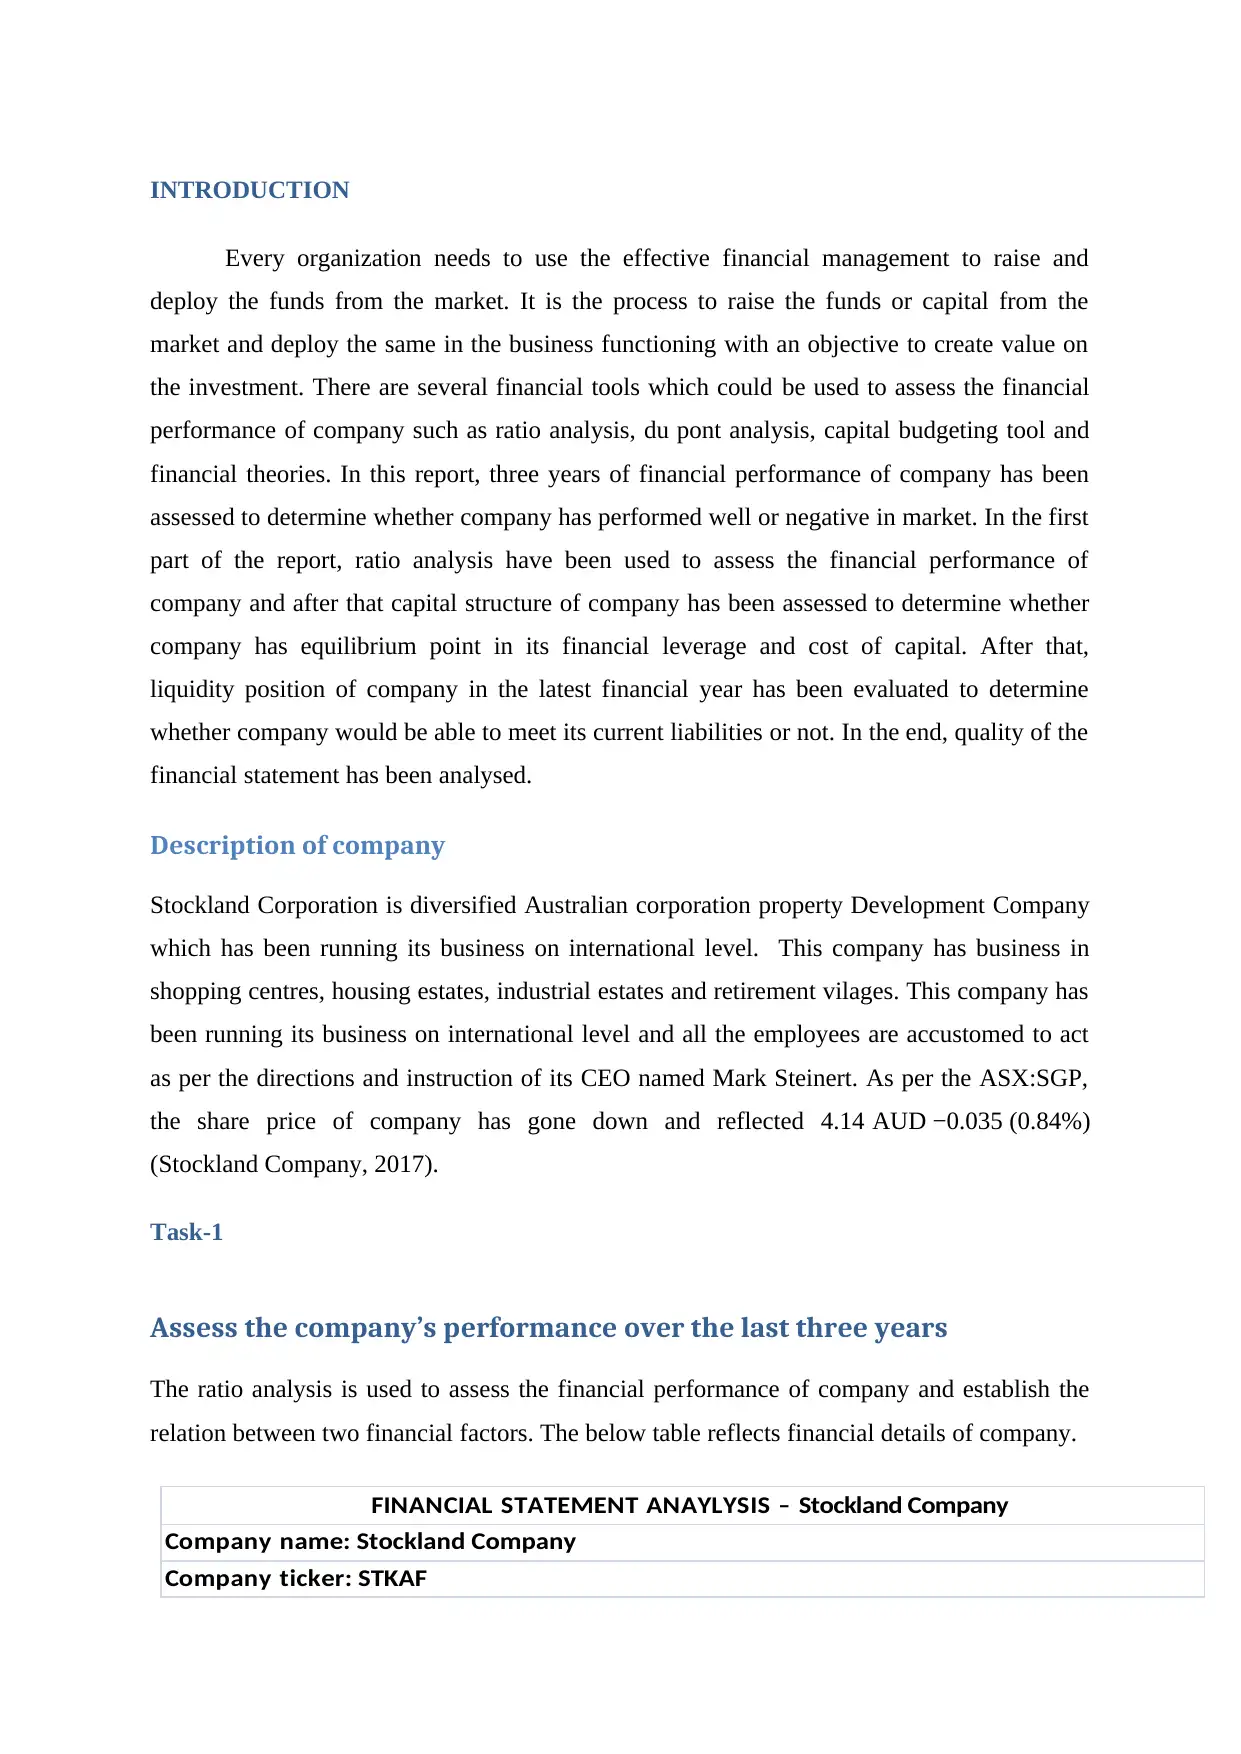
INTRODUCTION
Every organization needs to use the effective financial management to raise and
deploy the funds from the market. It is the process to raise the funds or capital from the
market and deploy the same in the business functioning with an objective to create value on
the investment. There are several financial tools which could be used to assess the financial
performance of company such as ratio analysis, du pont analysis, capital budgeting tool and
financial theories. In this report, three years of financial performance of company has been
assessed to determine whether company has performed well or negative in market. In the first
part of the report, ratio analysis have been used to assess the financial performance of
company and after that capital structure of company has been assessed to determine whether
company has equilibrium point in its financial leverage and cost of capital. After that,
liquidity position of company in the latest financial year has been evaluated to determine
whether company would be able to meet its current liabilities or not. In the end, quality of the
financial statement has been analysed.
Description of company
Stockland Corporation is diversified Australian corporation property Development Company
which has been running its business on international level. This company has business in
shopping centres, housing estates, industrial estates and retirement vilages. This company has
been running its business on international level and all the employees are accustomed to act
as per the directions and instruction of its CEO named Mark Steinert. As per the ASX:SGP,
the share price of company has gone down and reflected 4.14 AUD −0.035 (0.84%)
(Stockland Company, 2017).
Task-1
Assess the company’s performance over the last three years
The ratio analysis is used to assess the financial performance of company and establish the
relation between two financial factors. The below table reflects financial details of company.
FINANCIAL STATEMENT ANAYLYSIS – Stockland Company
Company name: Stockland Company
Company ticker: STKAF
Paraphrase This Document
Need a fresh take? Get an instant paraphrase of this document with our AI Paraphraser
Student name :
Ratios and Other Analysis Measures Year End (3 y ea r s)
2015 2016 2017
ROE and DuPont Ratios
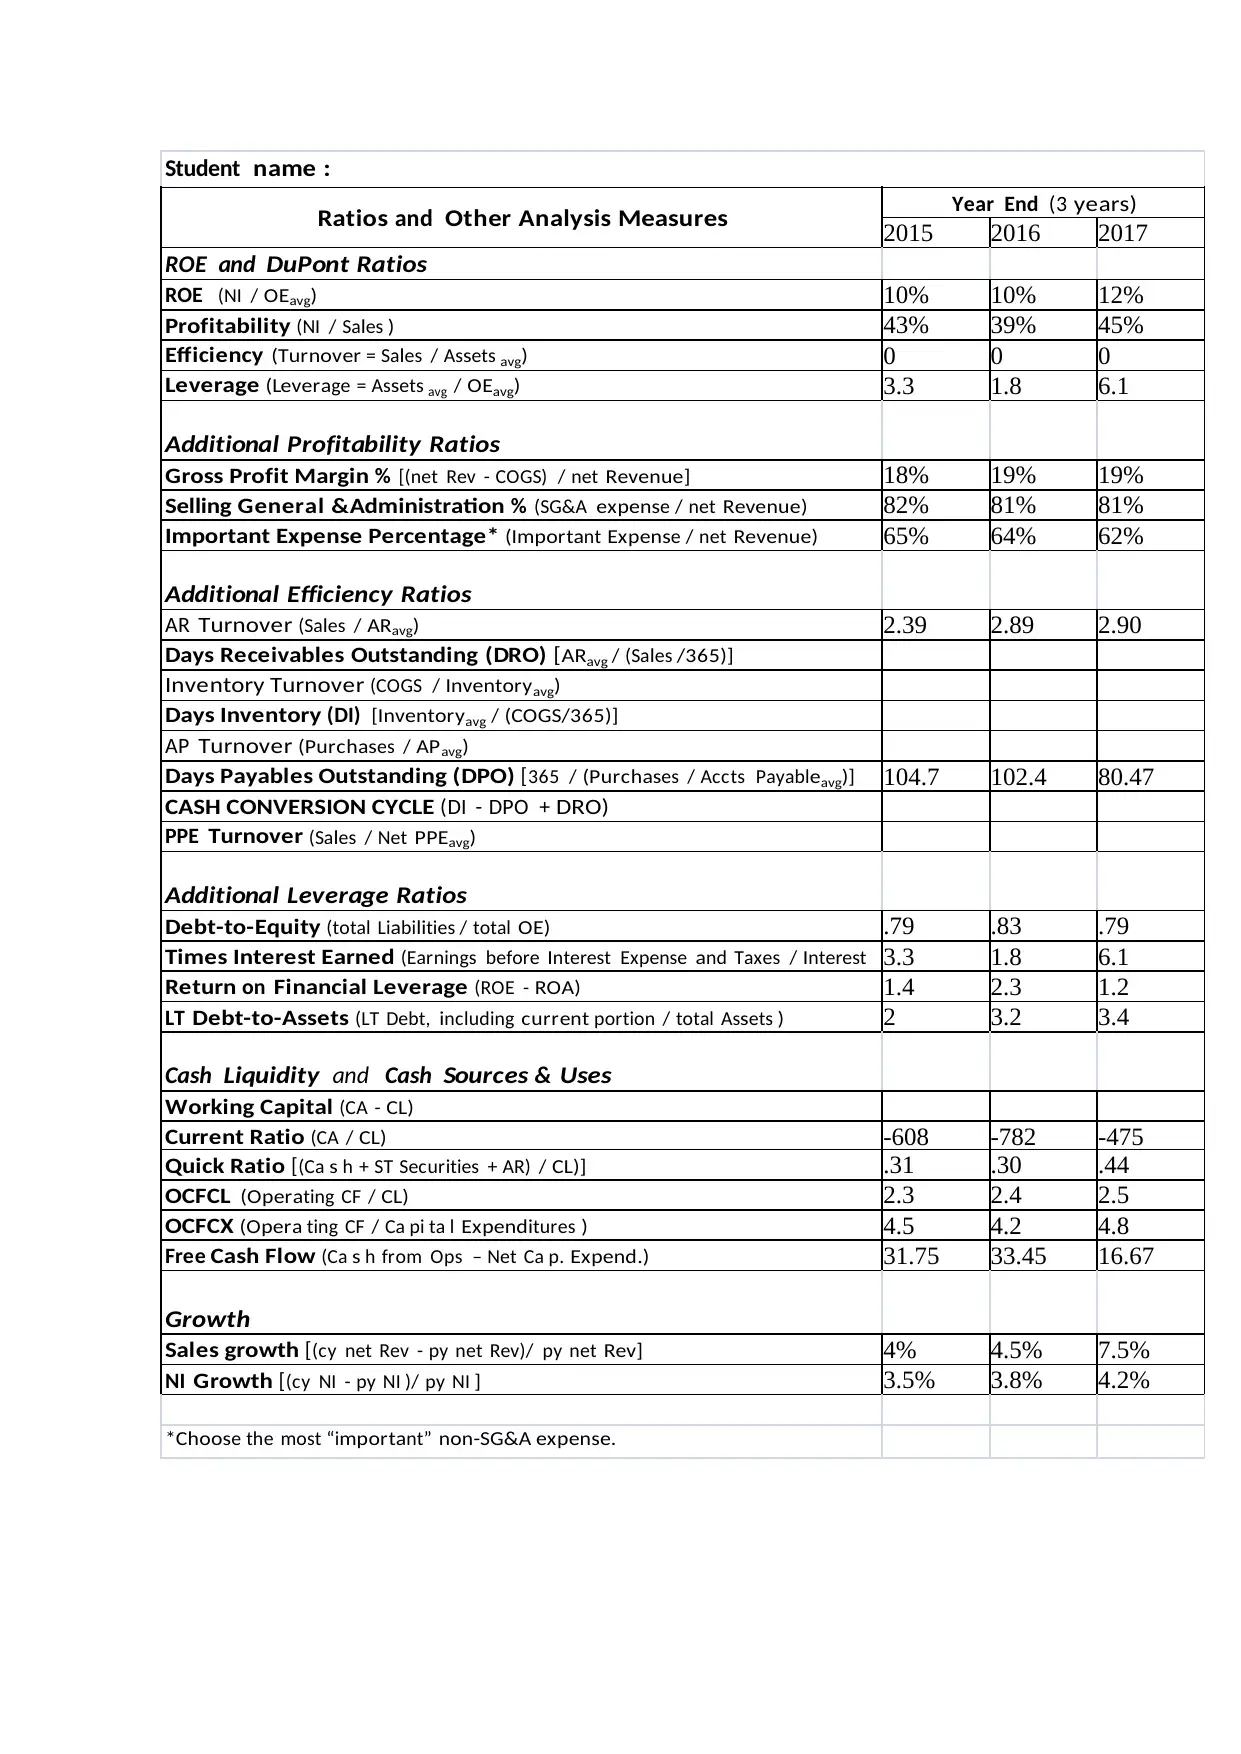
ROE (NI / OE avg ) 10% 10% 12%
Profitability (NI / Sa les ) 43% 39% 45%
Efficiency (Turnover = Sa les / Assets avg ) 0 0 0
Leverage (Leverage = Assets avg / OE avg ) 3.3 1.8 6.1
Additional Profitability Ratios
Gross Profit Margin % [(net Rev - COGS) / net Revenue] 18% 19% 19%
Selling General &Administration % (SG&A expense / net Revenue) 82% 81% 81%
Important Expense Percentage* (Important Expense / net Revenue) 65% 64% 62%
Additional Efficiency Ratios
AR Turnover (Sa les / AR avg ) 2.39 2.89 2.90
Days Receivables Outstanding (DRO) [ AR avg / (Sa les /365)]
Inventory Turnover (COGS / Inventory avg )
Days Inventory (DI) [Inventoryavg / (COGS/365)]
AP Turnover (Purchases / AP avg )
Days Payables Outstanding (DPO) [365 / (Purchases / Accts Payabl e avg )] 104.7 102.4 80.47
CASH CONVERSION CYCLE (DI - DPO + D RO)
PPE Turnover (Sa les / Net PPE avg )
Additional Leverage Ratios
Debt-to-Equity (total Li abi lities / total OE) .79 .83 .79
Times Interest Earned (Earnings before Interest Expense and Taxes / Interest
Exp)
3.3 1.8 6.1
Return on Financial Leverage (ROE - ROA) 1.4 2.3 1.2
LT Debt-to-Assets (LT Debt, including current portion / total Assets ) 2 3.2 3.4
Cash Liquidity and Cash Sources & Uses
Working Capital (CA - CL)
Current Ratio (CA / CL) -608 -782 -475
Quick Ratio [(Ca s h + ST Securities + AR) / CL)] .31 .30 .44
OCFCL (Operating CF / CL) 2.3 2.4 2.5
OCFCX (Opera ting CF / Ca pi ta l Expenditures ) 4.5 4.2 4.8
Free Cash Flow (Ca s h from Ops – Net Ca p. Expend.) 31.75 33.45 16.67
Growth
Sales growth [(cy net Rev - py net Rev)/ py net Rev] 4% 4.5% 7.5%
NI Growth [(cy NI - py NI )/ py NI ] 3.5% 3.8% 4.2%
*Choose the most “i mportant” non-SG&A expense.
Ratios and Other Analysis Measures Year End (3 y ea r s)
2015 2016 2017
ROE and DuPont Ratios
ROE (NI / OE avg ) 10% 10% 12%
Profitability (NI / Sa les ) 43% 39% 45%
Efficiency (Turnover = Sa les / Assets avg ) 0 0 0
Leverage (Leverage = Assets avg / OE avg ) 3.3 1.8 6.1
Additional Profitability Ratios
Gross Profit Margin % [(net Rev - COGS) / net Revenue] 18% 19% 19%
Selling General &Administration % (SG&A expense / net Revenue) 82% 81% 81%
Important Expense Percentage* (Important Expense / net Revenue) 65% 64% 62%
Additional Efficiency Ratios
AR Turnover (Sa les / AR avg ) 2.39 2.89 2.90
Days Receivables Outstanding (DRO) [ AR avg / (Sa les /365)]
Inventory Turnover (COGS / Inventory avg )
Days Inventory (DI) [Inventoryavg / (COGS/365)]
AP Turnover (Purchases / AP avg )
Days Payables Outstanding (DPO) [365 / (Purchases / Accts Payabl e avg )] 104.7 102.4 80.47
CASH CONVERSION CYCLE (DI - DPO + D RO)
PPE Turnover (Sa les / Net PPE avg )
Additional Leverage Ratios
Debt-to-Equity (total Li abi lities / total OE) .79 .83 .79
Times Interest Earned (Earnings before Interest Expense and Taxes / Interest
Exp)
3.3 1.8 6.1
Return on Financial Leverage (ROE - ROA) 1.4 2.3 1.2
LT Debt-to-Assets (LT Debt, including current portion / total Assets ) 2 3.2 3.4
Cash Liquidity and Cash Sources & Uses
Working Capital (CA - CL)
Current Ratio (CA / CL) -608 -782 -475
Quick Ratio [(Ca s h + ST Securities + AR) / CL)] .31 .30 .44
OCFCL (Operating CF / CL) 2.3 2.4 2.5
OCFCX (Opera ting CF / Ca pi ta l Expenditures ) 4.5 4.2 4.8
Free Cash Flow (Ca s h from Ops – Net Ca p. Expend.) 31.75 33.45 16.67
Growth
Sales growth [(cy net Rev - py net Rev)/ py net Rev] 4% 4.5% 7.5%
NI Growth [(cy NI - py NI )/ py NI ] 3.5% 3.8% 4.2%
*Choose the most “i mportant” non-SG&A expense.
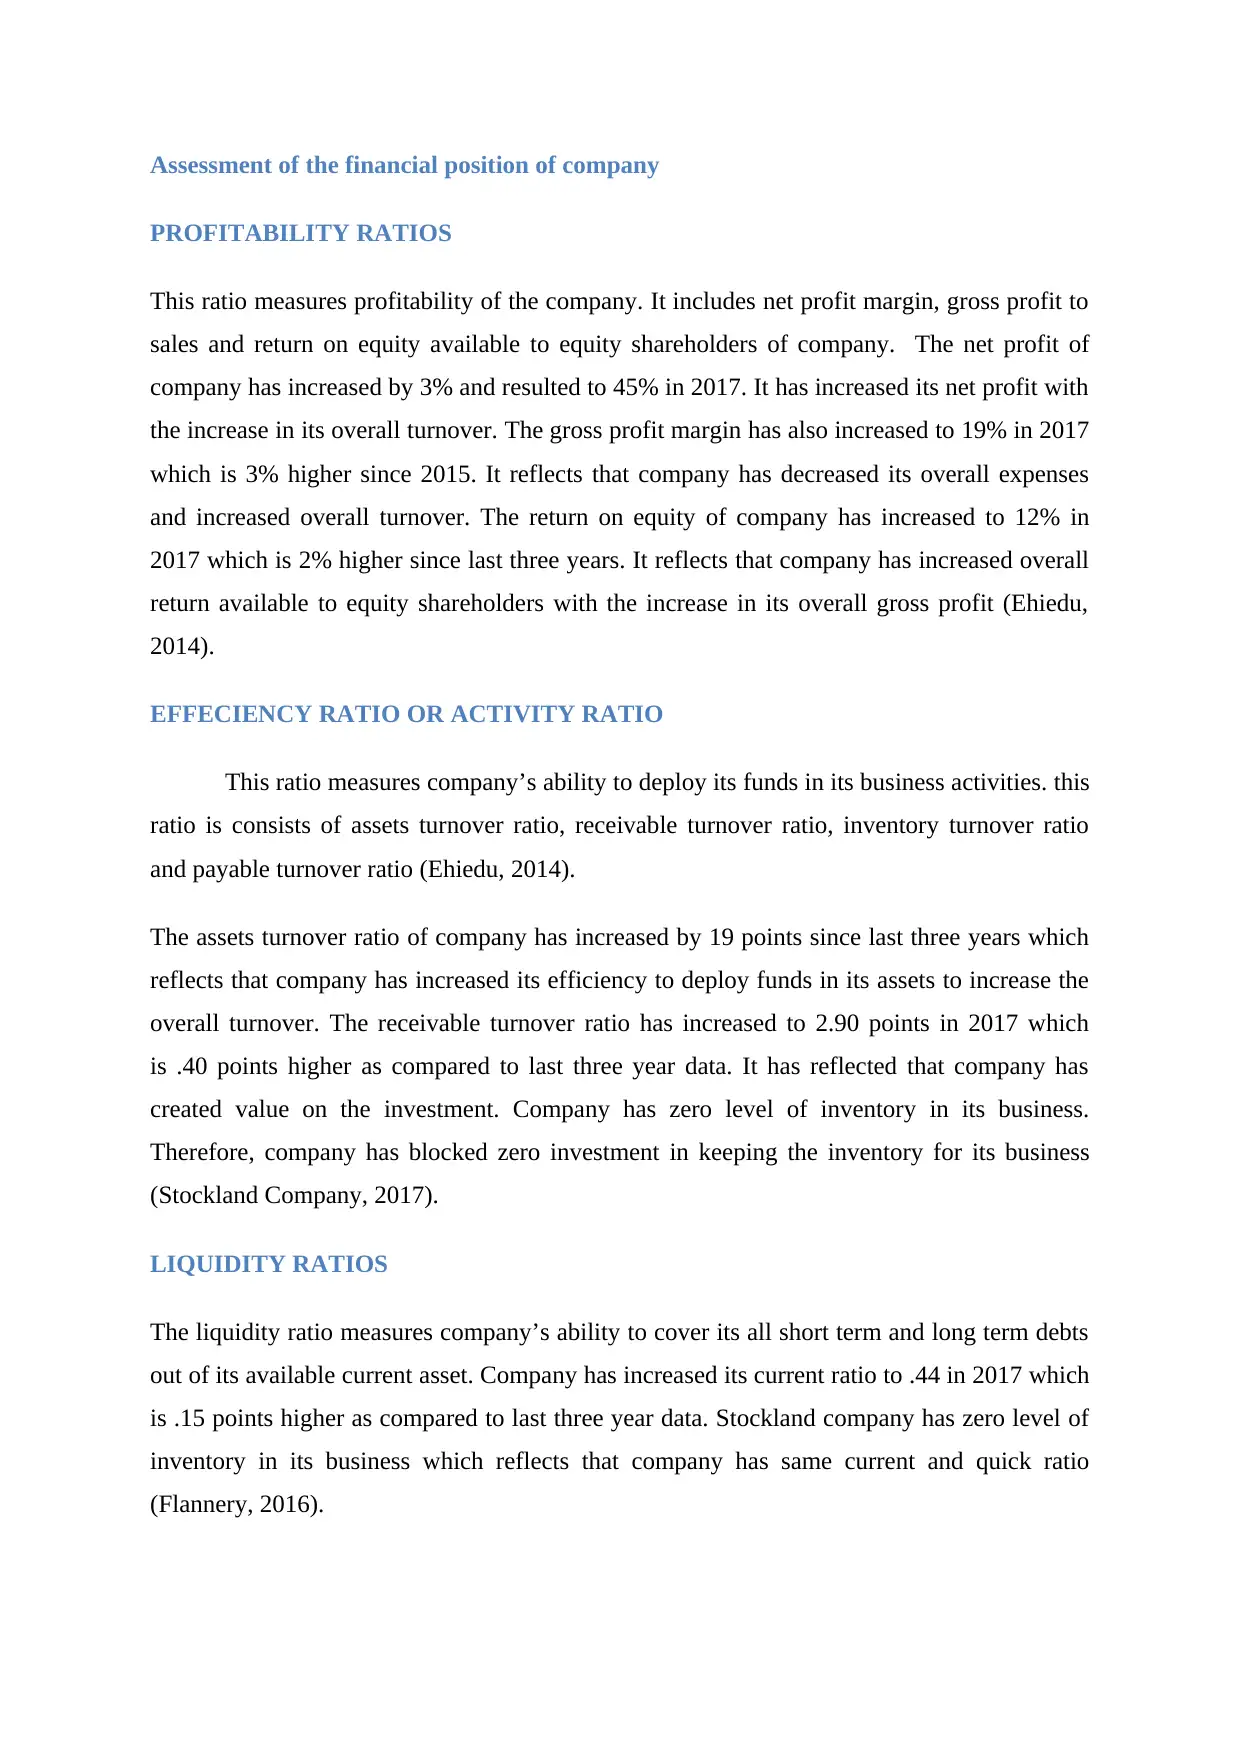
Assessment of the financial position of company
PROFITABILITY RATIOS
This ratio measures profitability of the company. It includes net profit margin, gross profit to
sales and return on equity available to equity shareholders of company. The net profit of
company has increased by 3% and resulted to 45% in 2017. It has increased its net profit with
the increase in its overall turnover. The gross profit margin has also increased to 19% in 2017
which is 3% higher since 2015. It reflects that company has decreased its overall expenses
and increased overall turnover. The return on equity of company has increased to 12% in
2017 which is 2% higher since last three years. It reflects that company has increased overall
return available to equity shareholders with the increase in its overall gross profit (Ehiedu,
2014).
EFFECIENCY RATIO OR ACTIVITY RATIO
This ratio measures company’s ability to deploy its funds in its business activities. this
ratio is consists of assets turnover ratio, receivable turnover ratio, inventory turnover ratio
and payable turnover ratio (Ehiedu, 2014).
The assets turnover ratio of company has increased by 19 points since last three years which
reflects that company has increased its efficiency to deploy funds in its assets to increase the
overall turnover. The receivable turnover ratio has increased to 2.90 points in 2017 which
is .40 points higher as compared to last three year data. It has reflected that company has
created value on the investment. Company has zero level of inventory in its business.
Therefore, company has blocked zero investment in keeping the inventory for its business
(Stockland Company, 2017).
LIQUIDITY RATIOS
The liquidity ratio measures company’s ability to cover its all short term and long term debts
out of its available current asset. Company has increased its current ratio to .44 in 2017 which
is .15 points higher as compared to last three year data. Stockland company has zero level of
inventory in its business which reflects that company has same current and quick ratio
(Flannery, 2016).
⊘ This is a preview!⊘
Do you want full access?
Subscribe today to unlock all pages.
Trusted by 1+ million students worldwide
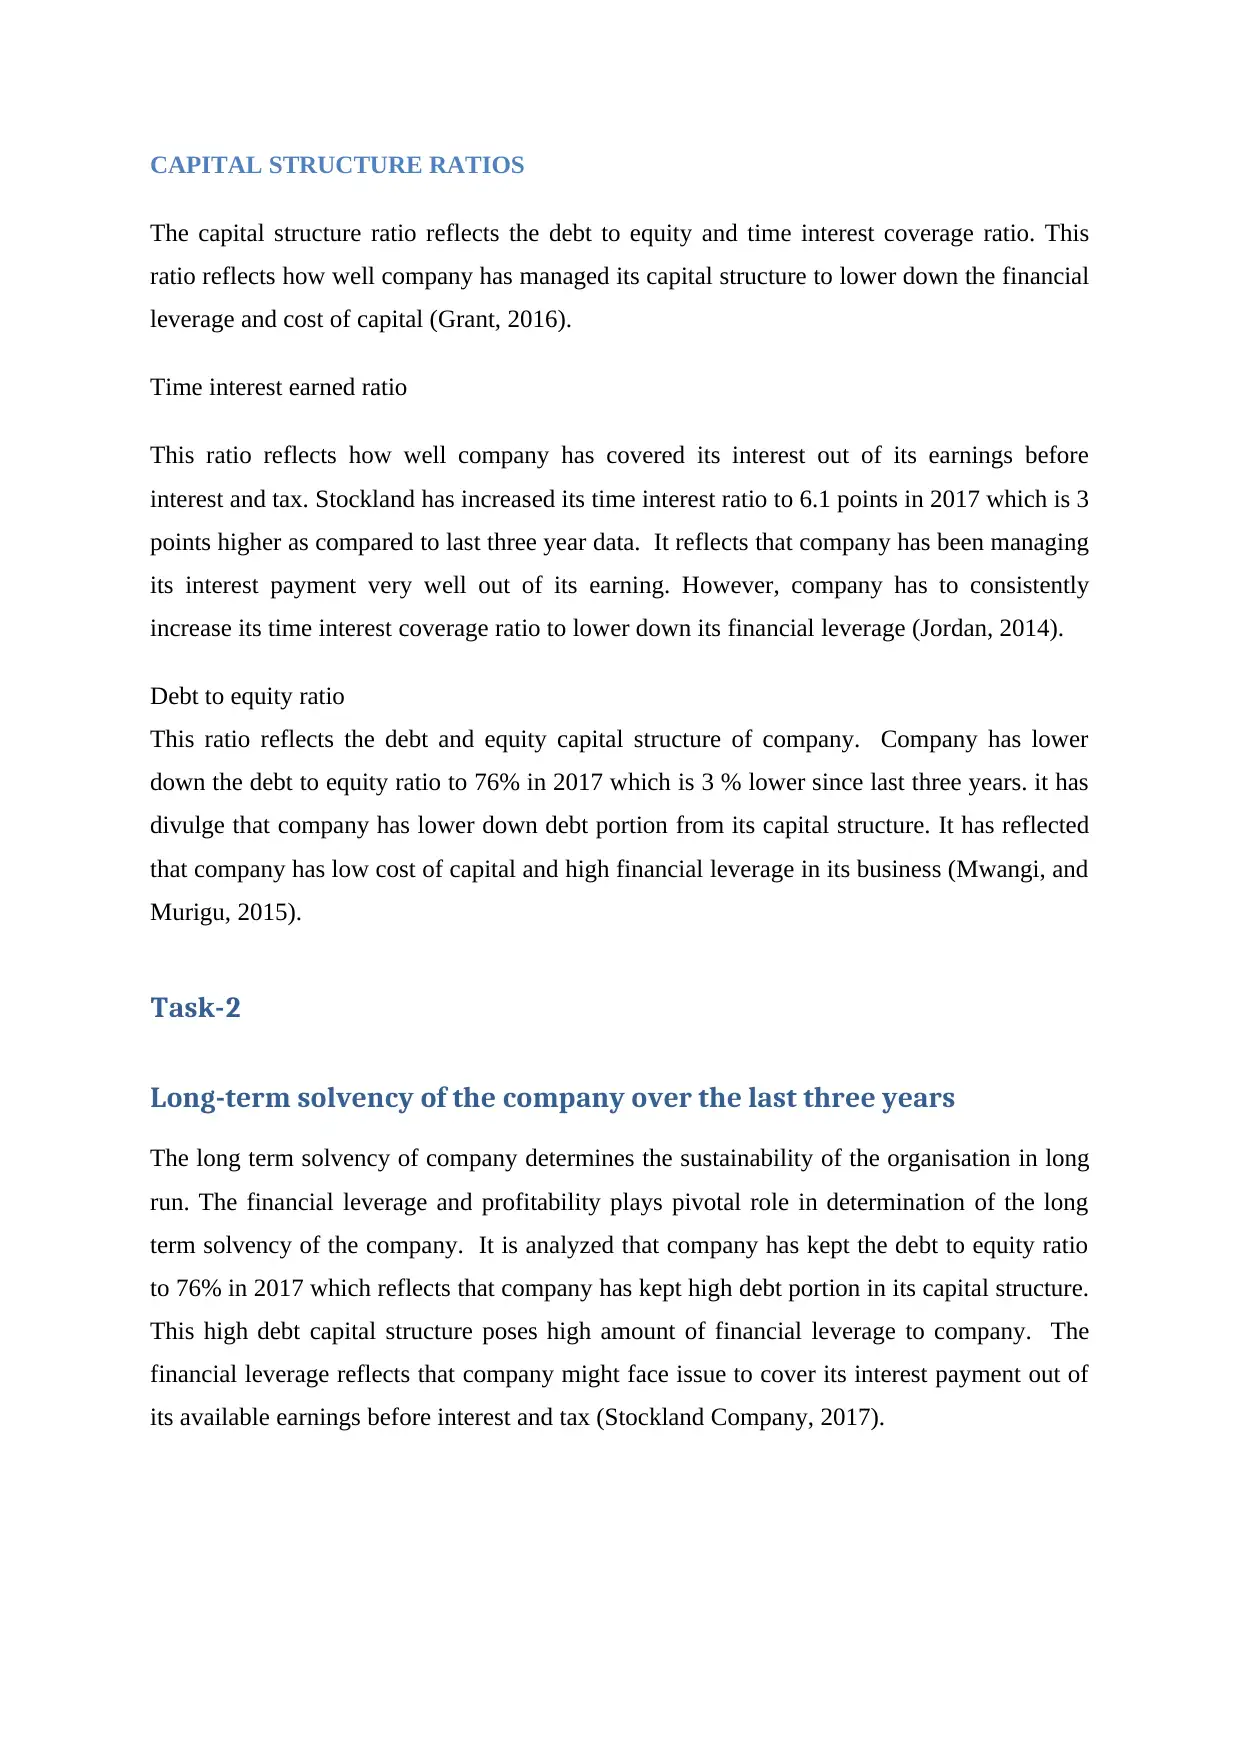
CAPITAL STRUCTURE RATIOS
The capital structure ratio reflects the debt to equity and time interest coverage ratio. This
ratio reflects how well company has managed its capital structure to lower down the financial
leverage and cost of capital (Grant, 2016).
Time interest earned ratio
This ratio reflects how well company has covered its interest out of its earnings before
interest and tax. Stockland has increased its time interest ratio to 6.1 points in 2017 which is 3
points higher as compared to last three year data. It reflects that company has been managing
its interest payment very well out of its earning. However, company has to consistently
increase its time interest coverage ratio to lower down its financial leverage (Jordan, 2014).
Debt to equity ratio
This ratio reflects the debt and equity capital structure of company. Company has lower
down the debt to equity ratio to 76% in 2017 which is 3 % lower since last three years. it has
divulge that company has lower down debt portion from its capital structure. It has reflected
that company has low cost of capital and high financial leverage in its business (Mwangi, and
Murigu, 2015).
Task-2
Long-term solvency of the company over the last three years
The long term solvency of company determines the sustainability of the organisation in long
run. The financial leverage and profitability plays pivotal role in determination of the long
term solvency of the company. It is analyzed that company has kept the debt to equity ratio
to 76% in 2017 which reflects that company has kept high debt portion in its capital structure.
This high debt capital structure poses high amount of financial leverage to company. The
financial leverage reflects that company might face issue to cover its interest payment out of
its available earnings before interest and tax (Stockland Company, 2017).
Paraphrase This Document
Need a fresh take? Get an instant paraphrase of this document with our AI Paraphraser
Descriptio
n Formula STOCKLAND CORP LTD (STKAF)
2013
-08 2014-08
2015
-08
2016
-08
2017
-08
Average
industry
ratio
Times
interest
earned
EBIT / Interest
expenses 2.2 18.0 3.3 1.8 6.1 7.6
Cash
coverage
ratio
EBIT + non-cash
expenses / interest
expenses
213.
00 289.00
379.
00
449.
00
509.
00 858
Debt to
Equity
Ratio Debt/ Equity 0.72 0.80 0.79 0.83 0.76 3.7
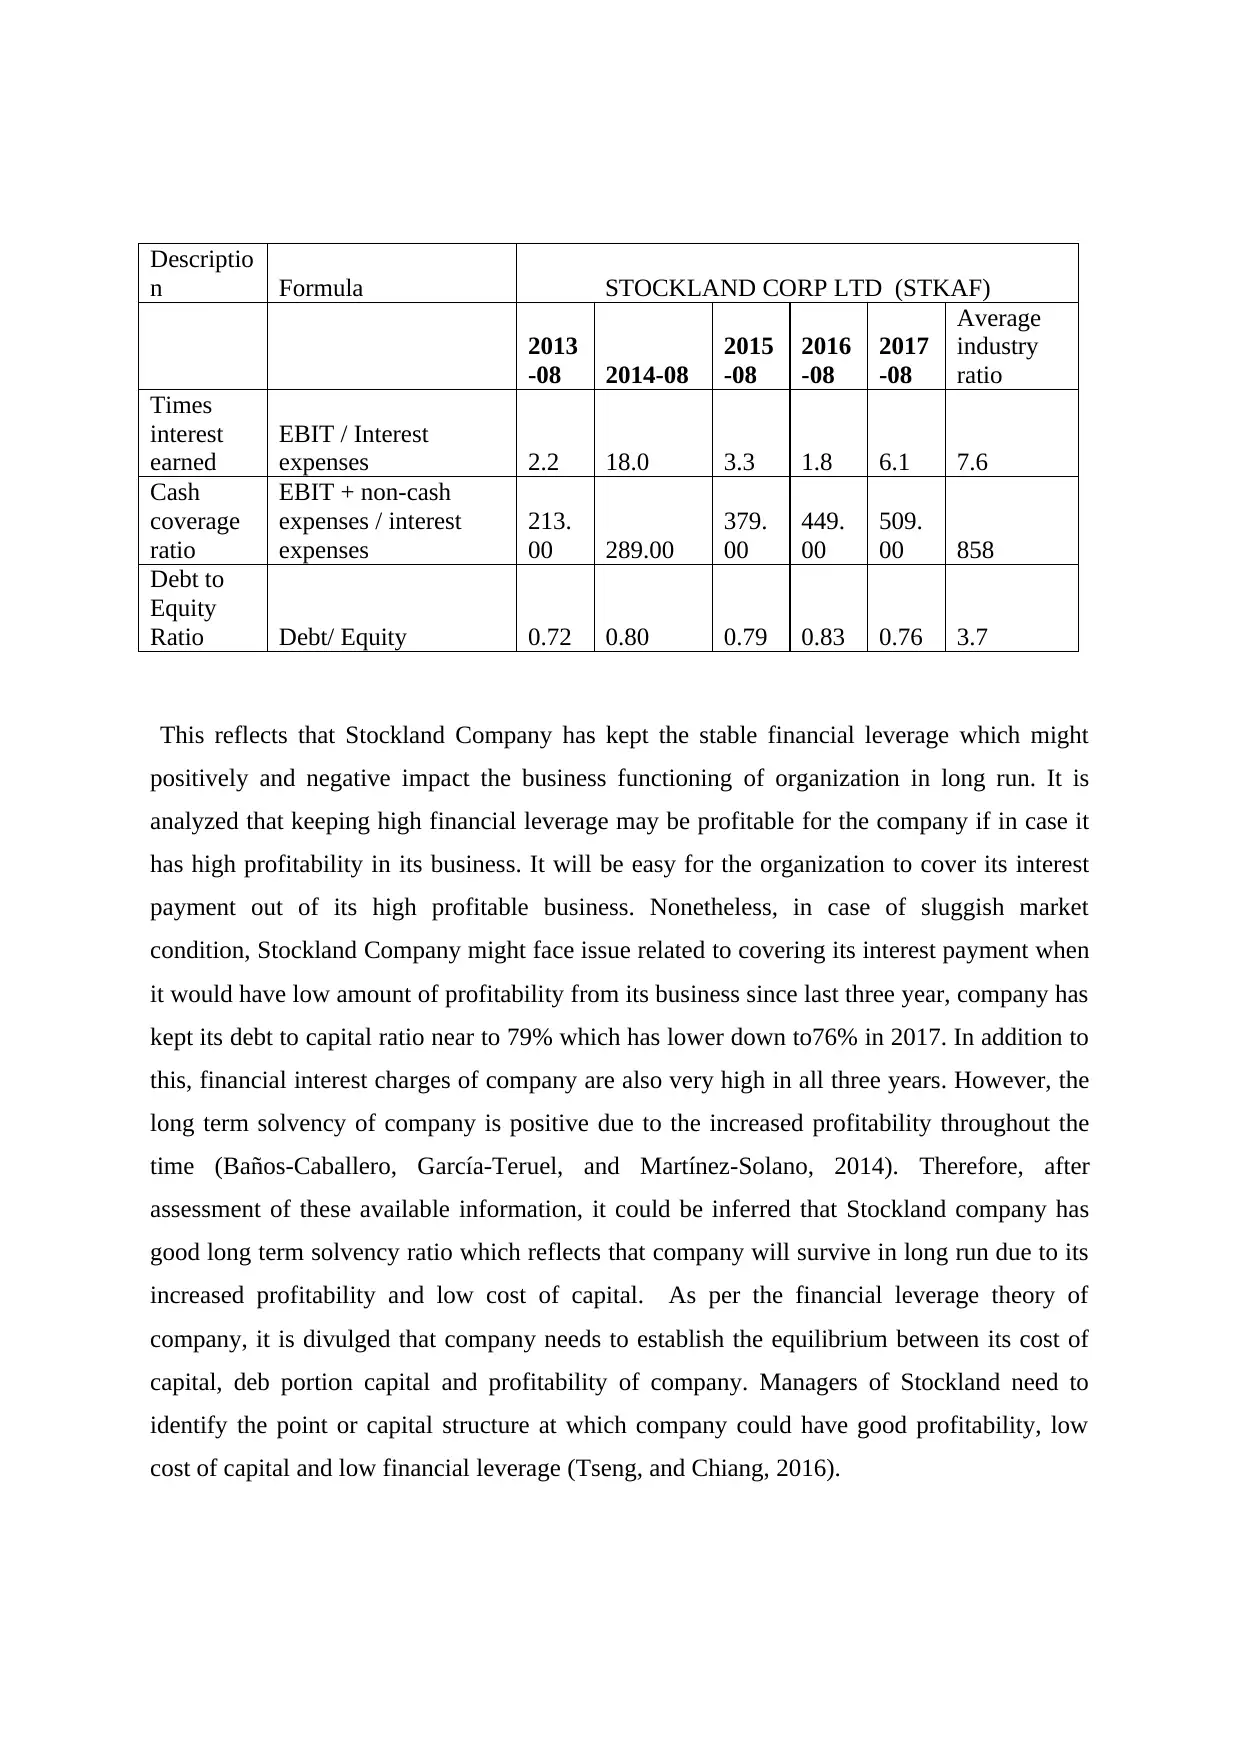
This reflects that Stockland Company has kept the stable financial leverage which might
positively and negative impact the business functioning of organization in long run. It is
analyzed that keeping high financial leverage may be profitable for the company if in case it
has high profitability in its business. It will be easy for the organization to cover its interest
payment out of its high profitable business. Nonetheless, in case of sluggish market
condition, Stockland Company might face issue related to covering its interest payment when
it would have low amount of profitability from its business since last three year, company has
kept its debt to capital ratio near to 79% which has lower down to76% in 2017. In addition to
this, financial interest charges of company are also very high in all three years. However, the
long term solvency of company is positive due to the increased profitability throughout the
time (Baños-Caballero, García-Teruel, and Martínez-Solano, 2014). Therefore, after
assessment of these available information, it could be inferred that Stockland company has
good long term solvency ratio which reflects that company will survive in long run due to its
increased profitability and low cost of capital. As per the financial leverage theory of
company, it is divulged that company needs to establish the equilibrium between its cost of
capital, deb portion capital and profitability of company. Managers of Stockland need to
identify the point or capital structure at which company could have good profitability, low
cost of capital and low financial leverage (Tseng, and Chiang, 2016).
n Formula STOCKLAND CORP LTD (STKAF)
2013
-08 2014-08
2015
-08
2016
-08
2017
-08
Average
industry
ratio
Times
interest
earned
EBIT / Interest
expenses 2.2 18.0 3.3 1.8 6.1 7.6
Cash
coverage
ratio
EBIT + non-cash
expenses / interest
expenses
213.
00 289.00
379.
00
449.
00
509.
00 858
Debt to
Equity
Ratio Debt/ Equity 0.72 0.80 0.79 0.83 0.76 3.7
This reflects that Stockland Company has kept the stable financial leverage which might
positively and negative impact the business functioning of organization in long run. It is
analyzed that keeping high financial leverage may be profitable for the company if in case it
has high profitability in its business. It will be easy for the organization to cover its interest
payment out of its high profitable business. Nonetheless, in case of sluggish market
condition, Stockland Company might face issue related to covering its interest payment when
it would have low amount of profitability from its business since last three year, company has
kept its debt to capital ratio near to 79% which has lower down to76% in 2017. In addition to
this, financial interest charges of company are also very high in all three years. However, the
long term solvency of company is positive due to the increased profitability throughout the
time (Baños-Caballero, García-Teruel, and Martínez-Solano, 2014). Therefore, after
assessment of these available information, it could be inferred that Stockland company has
good long term solvency ratio which reflects that company will survive in long run due to its
increased profitability and low cost of capital. As per the financial leverage theory of
company, it is divulged that company needs to establish the equilibrium between its cost of
capital, deb portion capital and profitability of company. Managers of Stockland need to
identify the point or capital structure at which company could have good profitability, low
cost of capital and low financial leverage (Tseng, and Chiang, 2016).
Task-3
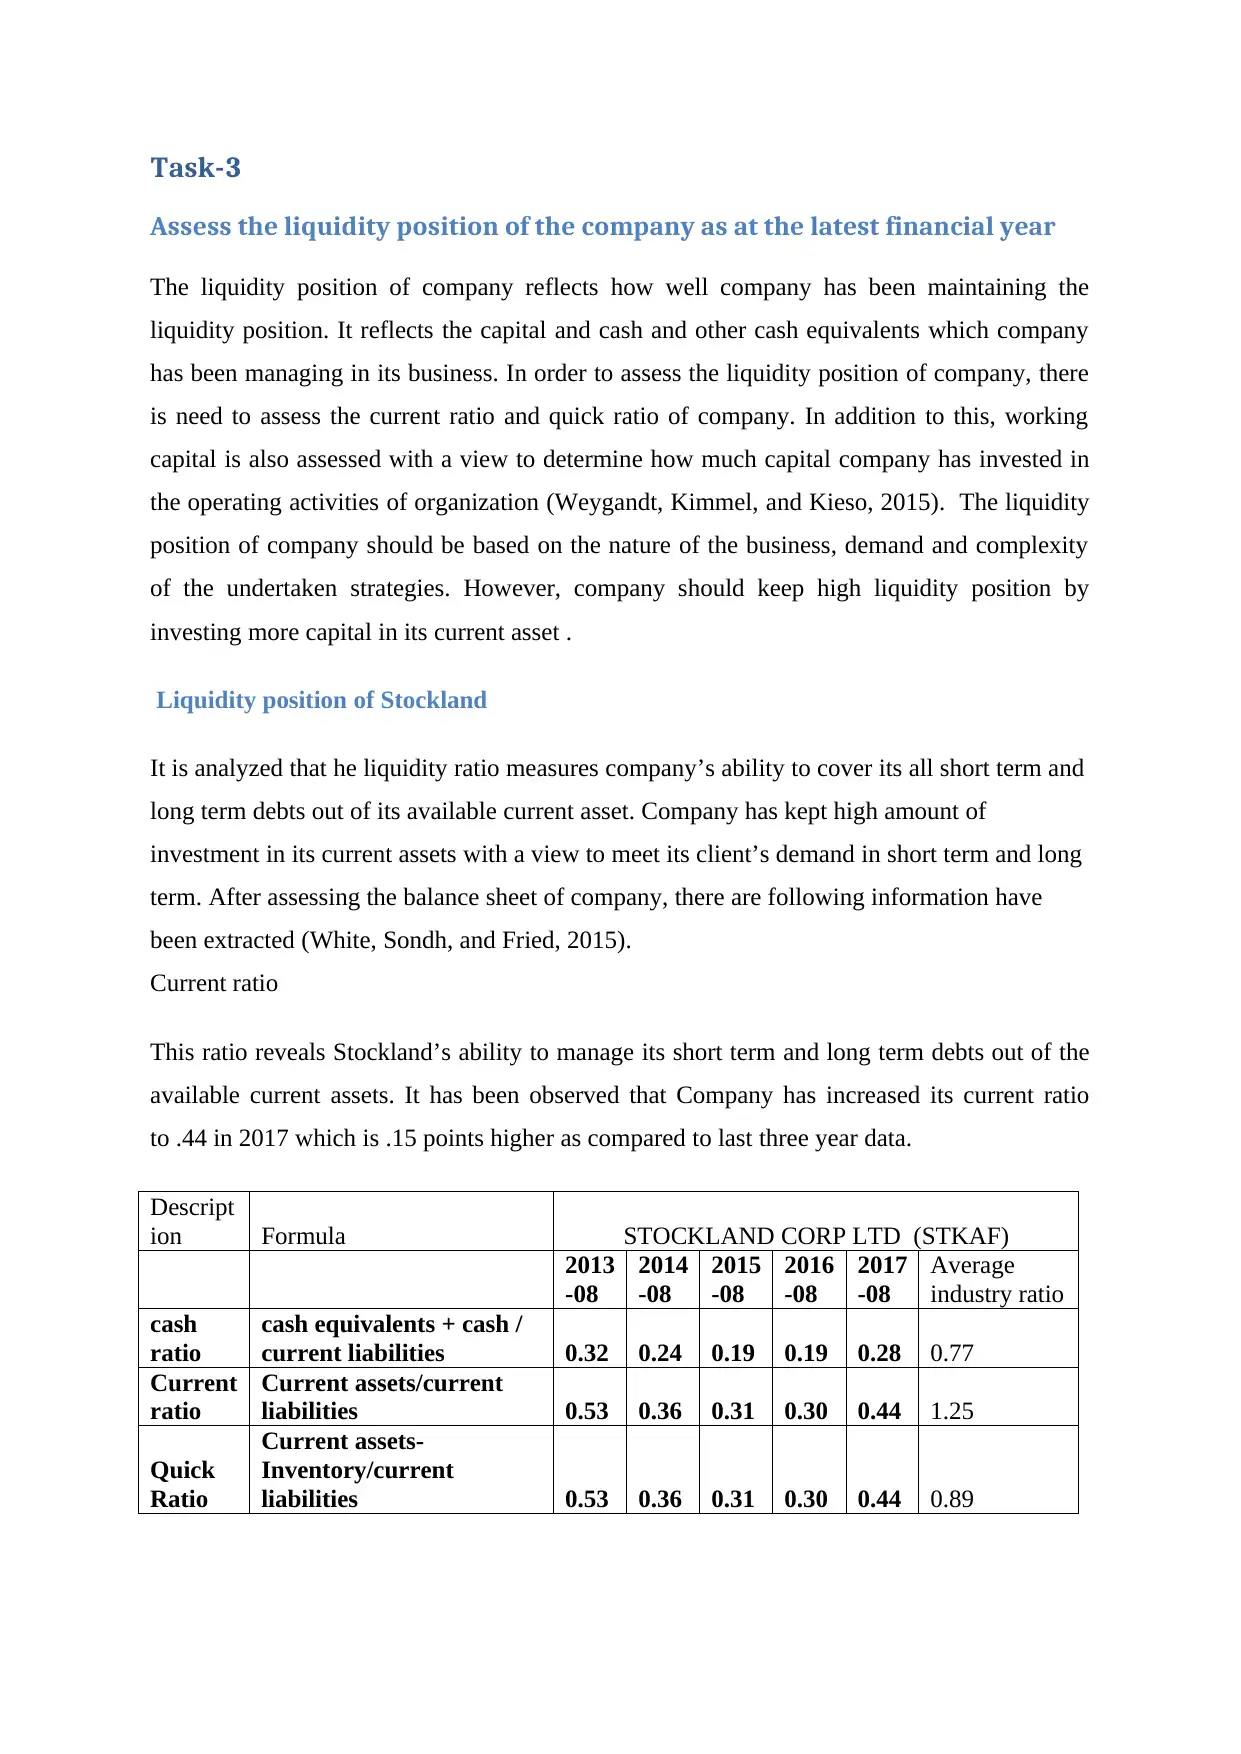
Assess the liquidity position of the company as at the latest financial year
The liquidity position of company reflects how well company has been maintaining the
liquidity position. It reflects the capital and cash and other cash equivalents which company
has been managing in its business. In order to assess the liquidity position of company, there
is need to assess the current ratio and quick ratio of company. In addition to this, working
capital is also assessed with a view to determine how much capital company has invested in
the operating activities of organization (Weygandt, Kimmel, and Kieso, 2015). The liquidity
position of company should be based on the nature of the business, demand and complexity
of the undertaken strategies. However, company should keep high liquidity position by
investing more capital in its current asset .
Liquidity position of Stockland
It is analyzed that he liquidity ratio measures company’s ability to cover its all short term and
long term debts out of its available current asset. Company has kept high amount of
investment in its current assets with a view to meet its client’s demand in short term and long
term. After assessing the balance sheet of company, there are following information have
been extracted (White, Sondh, and Fried, 2015).
Current ratio
This ratio reveals Stockland’s ability to manage its short term and long term debts out of the
available current assets. It has been observed that Company has increased its current ratio
to .44 in 2017 which is .15 points higher as compared to last three year data.
Descript
ion Formula STOCKLAND CORP LTD (STKAF)
2013
-08
2014
-08
2015
-08
2016
-08
2017
-08
Average
industry ratio
cash
ratio
cash equivalents + cash /
current liabilities 0.32 0.24 0.19 0.19 0.28 0.77
Current
ratio
Current assets/current
liabilities 0.53 0.36 0.31 0.30 0.44 1.25
Quick
Ratio
Current assets-
Inventory/current
liabilities 0.53 0.36 0.31 0.30 0.44 0.89
⊘ This is a preview!⊘
Do you want full access?
Subscribe today to unlock all pages.
Trusted by 1+ million students worldwide
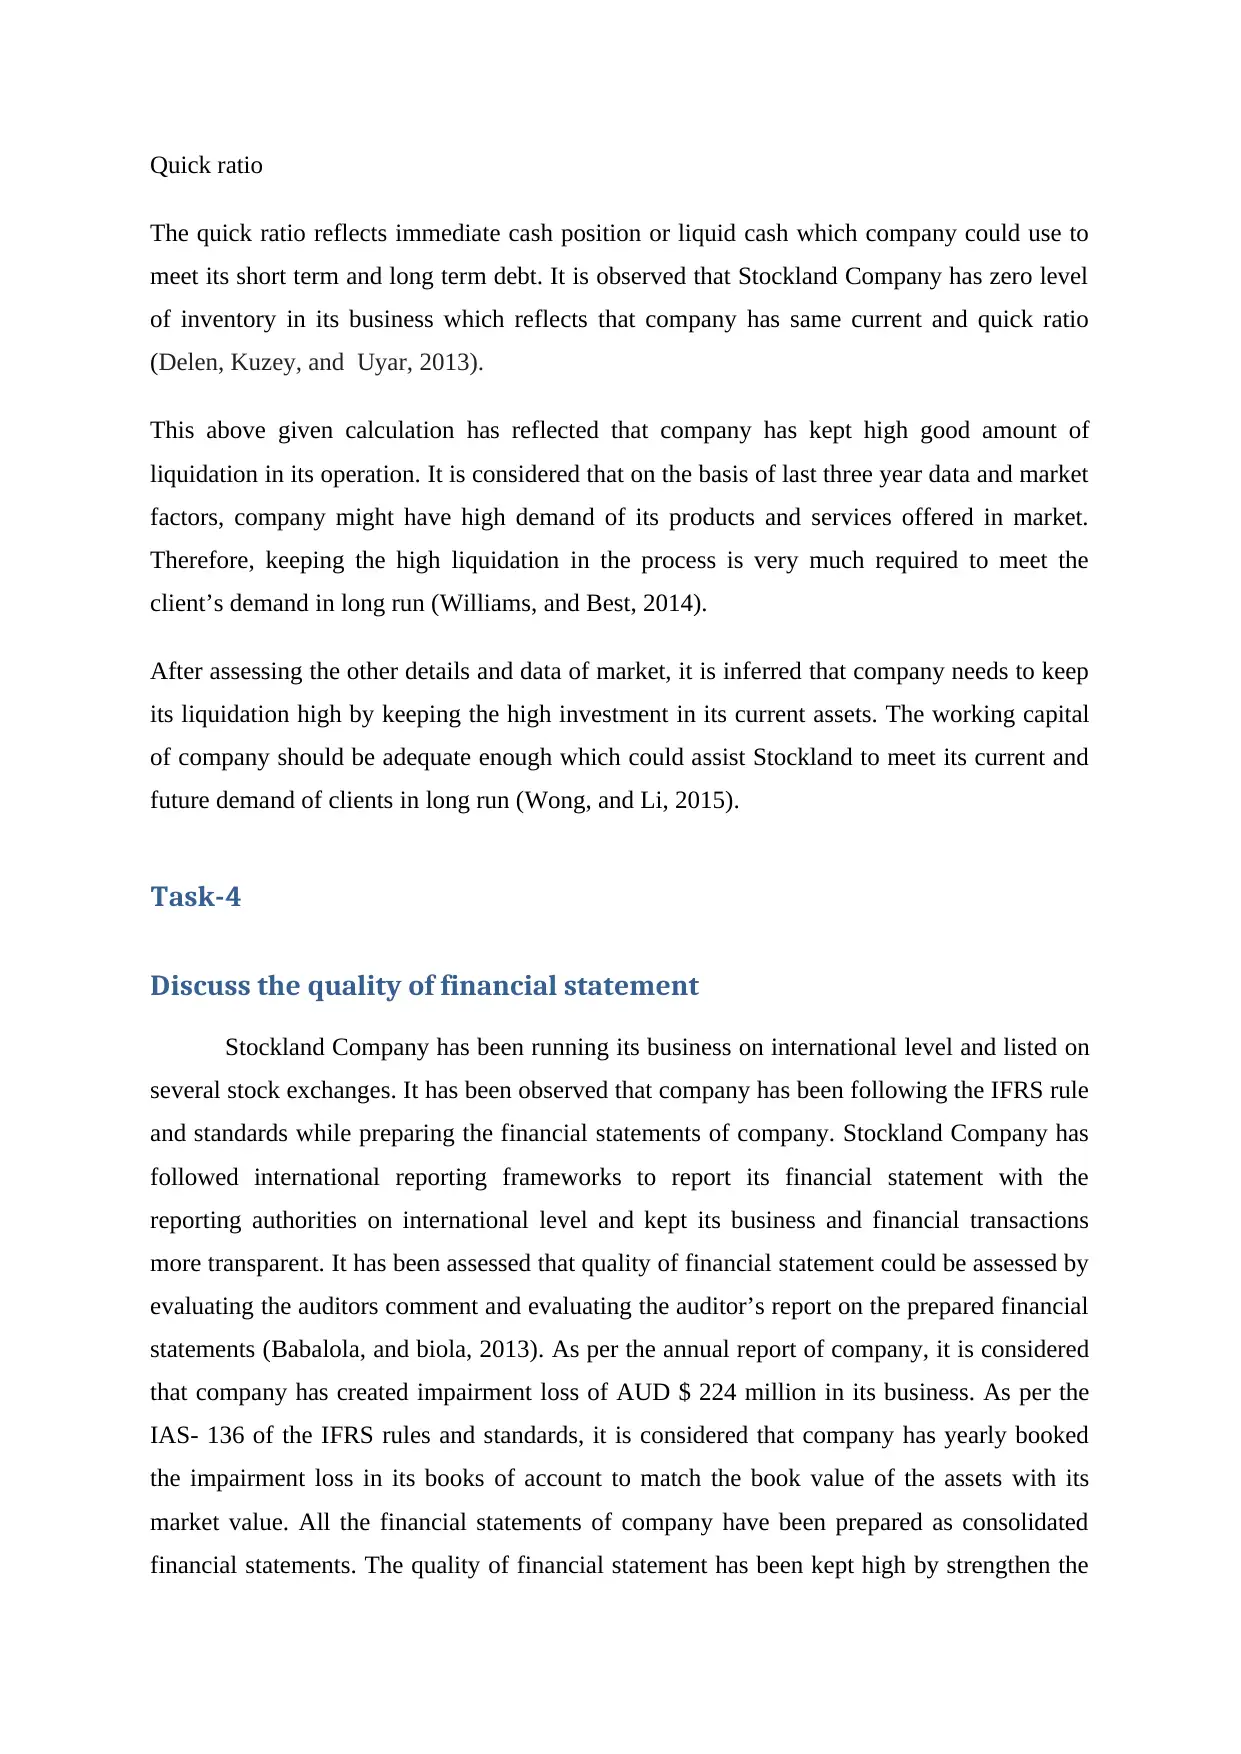
Quick ratio
The quick ratio reflects immediate cash position or liquid cash which company could use to
meet its short term and long term debt. It is observed that Stockland Company has zero level
of inventory in its business which reflects that company has same current and quick ratio
(Delen, Kuzey, and Uyar, 2013).
This above given calculation has reflected that company has kept high good amount of
liquidation in its operation. It is considered that on the basis of last three year data and market
factors, company might have high demand of its products and services offered in market.
Therefore, keeping the high liquidation in the process is very much required to meet the
client’s demand in long run (Williams, and Best, 2014).
After assessing the other details and data of market, it is inferred that company needs to keep
its liquidation high by keeping the high investment in its current assets. The working capital
of company should be adequate enough which could assist Stockland to meet its current and
future demand of clients in long run (Wong, and Li, 2015).
Task-4
Discuss the quality of financial statement
Stockland Company has been running its business on international level and listed on
several stock exchanges. It has been observed that company has been following the IFRS rule
and standards while preparing the financial statements of company. Stockland Company has
followed international reporting frameworks to report its financial statement with the
reporting authorities on international level and kept its business and financial transactions
more transparent. It has been assessed that quality of financial statement could be assessed by
evaluating the auditors comment and evaluating the auditor’s report on the prepared financial
statements (Babalola, and biola, 2013). As per the annual report of company, it is considered
that company has created impairment loss of AUD $ 224 million in its business. As per the
IAS- 136 of the IFRS rules and standards, it is considered that company has yearly booked
the impairment loss in its books of account to match the book value of the assets with its
market value. All the financial statements of company have been prepared as consolidated
financial statements. The quality of financial statement has been kept high by strengthen the
Paraphrase This Document
Need a fresh take? Get an instant paraphrase of this document with our AI Paraphraser
transparency of the all the details and financial statements (Zhang, and Zhang, 2014). The
directors and managers are accountable for preparation and authorisation of financial
statements and responsible for ensuring the integrity and quality of the financial reporting. In
order to strengthen the quality of the financial statement, directors and managers have issued
management representation latter with tis financial statements (Brigham, Ehrhardt, Nason,
and Gessaroli, 2016).
Furthermore, the quality of the financial statements is also based on the shared imperative
information in the financial statements. Stockland Company has shared all the required
details and imperative information which may be price sensitive to its investors. This type of
practice not only curbs the insider trading practice in organization but also lower down the
financial fluctuation in its stock price. Stockland Company has presented all its financial
information in accordance with the generally accepted accounting principles. In addition to
this, auditor’s plays play important role in improving the quality of the financial reporting. In
the latest shared financial statement of company, auditors have given qualified report on the
disclosed information in the annual report. It divulges that company has complied with the all
the applicable rules and regulations while preparing the financial statement. Nonetheless, in
the contrary to its domestic and international regulatory compliance program, company has
complied with the IFRS rules and standards while preparing the financial statements. It has
not only strengthened the transparency of its business transactions but also increase its overall
brand image on international level. The financial management authority has also cut down
the immaterial details from the financial statement of company to increase the quality of its
shared financial statement. It is analyzed that the clear, concise, and effective financial
information helps investors to make the better-informed investment decisions (Stockland
Company, 2017). Therefore, now in the end, it could be inferred that the quality of the
financial statement prepared by company is very good and it is already backed by the auditors
comment an qualified report.
Conclusion
After assessing the annual report and financial statement of company, it could be
inferred that company will have sustainable business practice. It has been observed that
Stockland Company has kept the stable financial leverage which might positively and
negative impact the business functioning of organization in long run. It is analyzed that
keeping high financial leverage may be profitable for the company if in case it has high
profitability in its business and if the profitability of company is not adequate enough to
cover the interest payment then company may go in winding up. Now in the end, it could be
inferred that company should maintain the effective debt to equity ratio and liquidity position
should also be adequate enough to cover the market demand of the organization. The quality
of financial statement of company could also be increased if company follow the proper IFRS
rules and regulations in its reporting frameworks.
⊘ This is a preview!⊘
Do you want full access?
Subscribe today to unlock all pages.
Trusted by 1+ million students worldwide
1 out of 14
Related Documents


Your All-in-One AI-Powered Toolkit for Academic Success.
+13062052269
info@desklib.com
Available 24*7 on WhatsApp / Email
![[object Object]](/_next/static/media/star-bottom.7253800d.svg)
Unlock your academic potential
Copyright © 2020–2026 A2Z Services. All Rights Reserved. Developed and managed by ZUCOL.