Managerial Finance: Dell Inc. Manufacturing Plant Project Evaluation
VerifiedAdded on 2023/03/17
|11
|2466
|38
Report
AI Summary
This report evaluates the feasibility of a new laptop manufacturing plant for Dell Inc. The analysis includes calculating depreciation, cash flows, and key financial metrics such as Net Present Value (NPV), Internal Rate of Return (IRR), and payback periods to determine the project's profitability and financial viability. The report also assesses the impact of borrowing on the project's financial discipline and provides recommendations regarding the project's acceptance and the company's discount rate practices. The conclusion suggests that the project is acceptable based on its positive NPV, high IRR, and reasonable payback period, while also recommending adjustments to the discount rate to account for project-specific risks.

Running head: MANAGERIAL FINANCE
Managerial finance
Name of the student
Name of the university
Student ID
Author note
Managerial finance
Name of the student
Name of the university
Student ID
Author note
Paraphrase This Document
Need a fresh take? Get an instant paraphrase of this document with our AI Paraphraser
1MANAGERIAL FINANCE
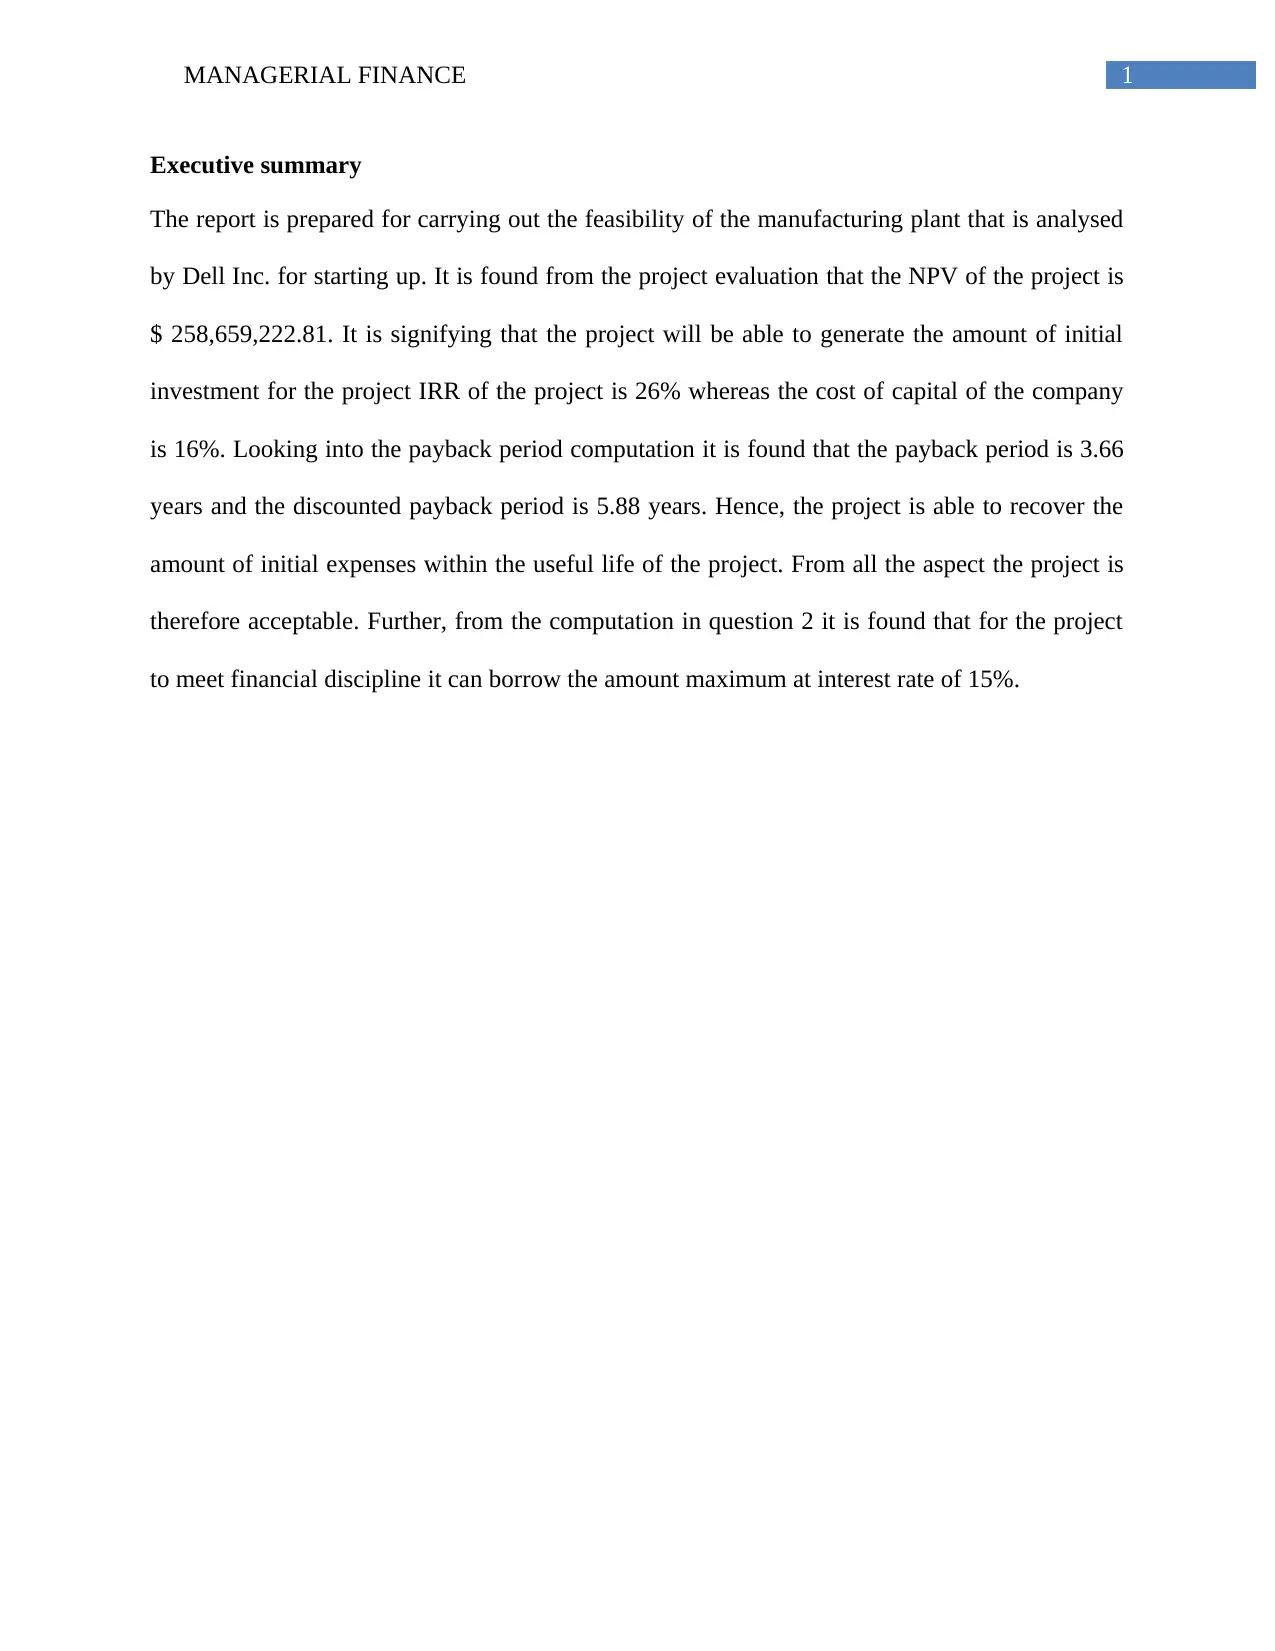
Executive summary
The report is prepared for carrying out the feasibility of the manufacturing plant that is analysed
by Dell Inc. for starting up. It is found from the project evaluation that the NPV of the project is
$ 258,659,222.81. It is signifying that the project will be able to generate the amount of initial
investment for the project IRR of the project is 26% whereas the cost of capital of the company
is 16%. Looking into the payback period computation it is found that the payback period is 3.66
years and the discounted payback period is 5.88 years. Hence, the project is able to recover the
amount of initial expenses within the useful life of the project. From all the aspect the project is
therefore acceptable. Further, from the computation in question 2 it is found that for the project
to meet financial discipline it can borrow the amount maximum at interest rate of 15%.
2MANAGERIAL FINANCE
Introduction
The main objective of this professional report is to answer some question related to
evaluation of the project that is projected to be started by Dell Inc. It is planning for setting up of
new plant for manufacturing laptop. The report will analyse the profitability of the project
through considering different approaches like Net present value, internal rate of return and
discounted payback period. Based on the results from these approaches recommendation will be
provided regarding acceptability of the projects (Žižlavský 2014)
Question 1
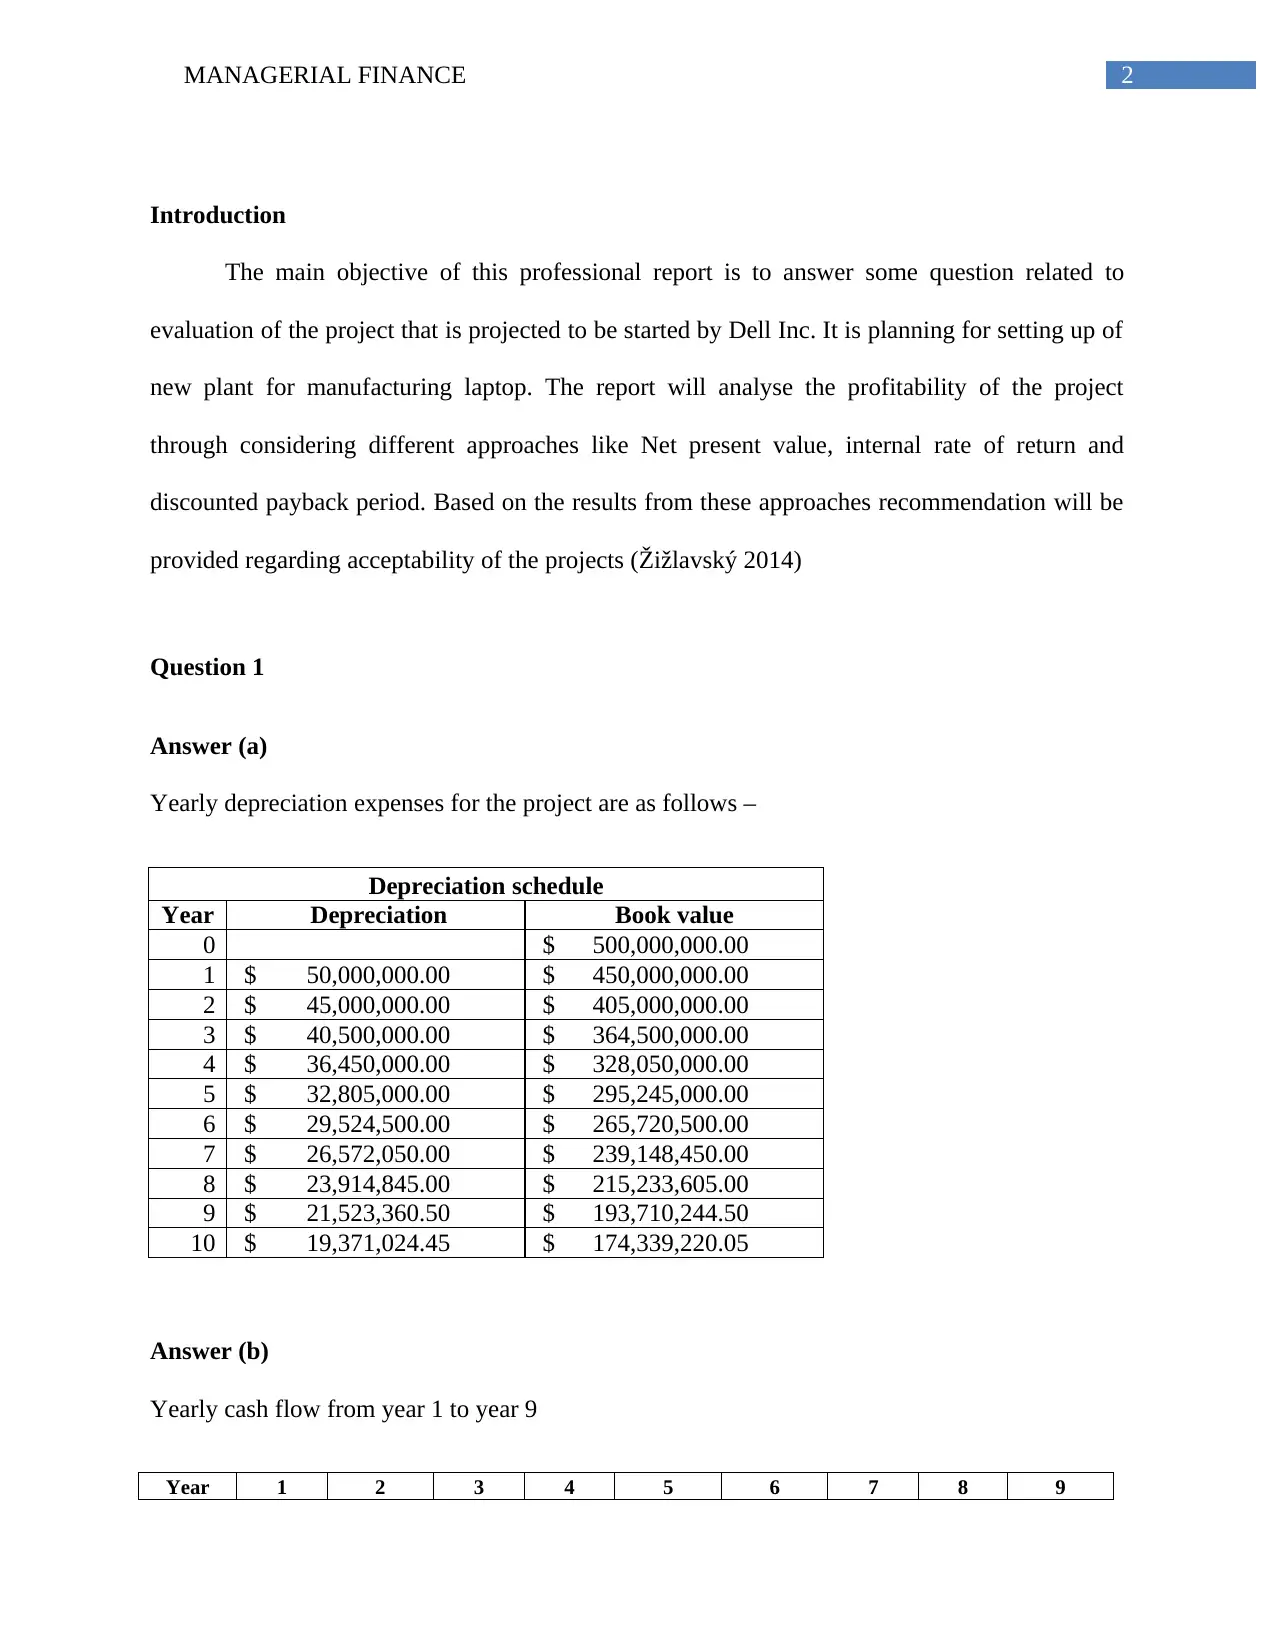
Answer (a)
Yearly depreciation expenses for the project are as follows –
Depreciation schedule
Year Depreciation Book value
0 $ 500,000,000.00
1 $ 50,000,000.00 $ 450,000,000.00
2 $ 45,000,000.00 $ 405,000,000.00
3 $ 40,500,000.00 $ 364,500,000.00
4 $ 36,450,000.00 $ 328,050,000.00
5 $ 32,805,000.00 $ 295,245,000.00
6 $ 29,524,500.00 $ 265,720,500.00
7 $ 26,572,050.00 $ 239,148,450.00
8 $ 23,914,845.00 $ 215,233,605.00
9 $ 21,523,360.50 $ 193,710,244.50
10 $ 19,371,024.45 $ 174,339,220.05
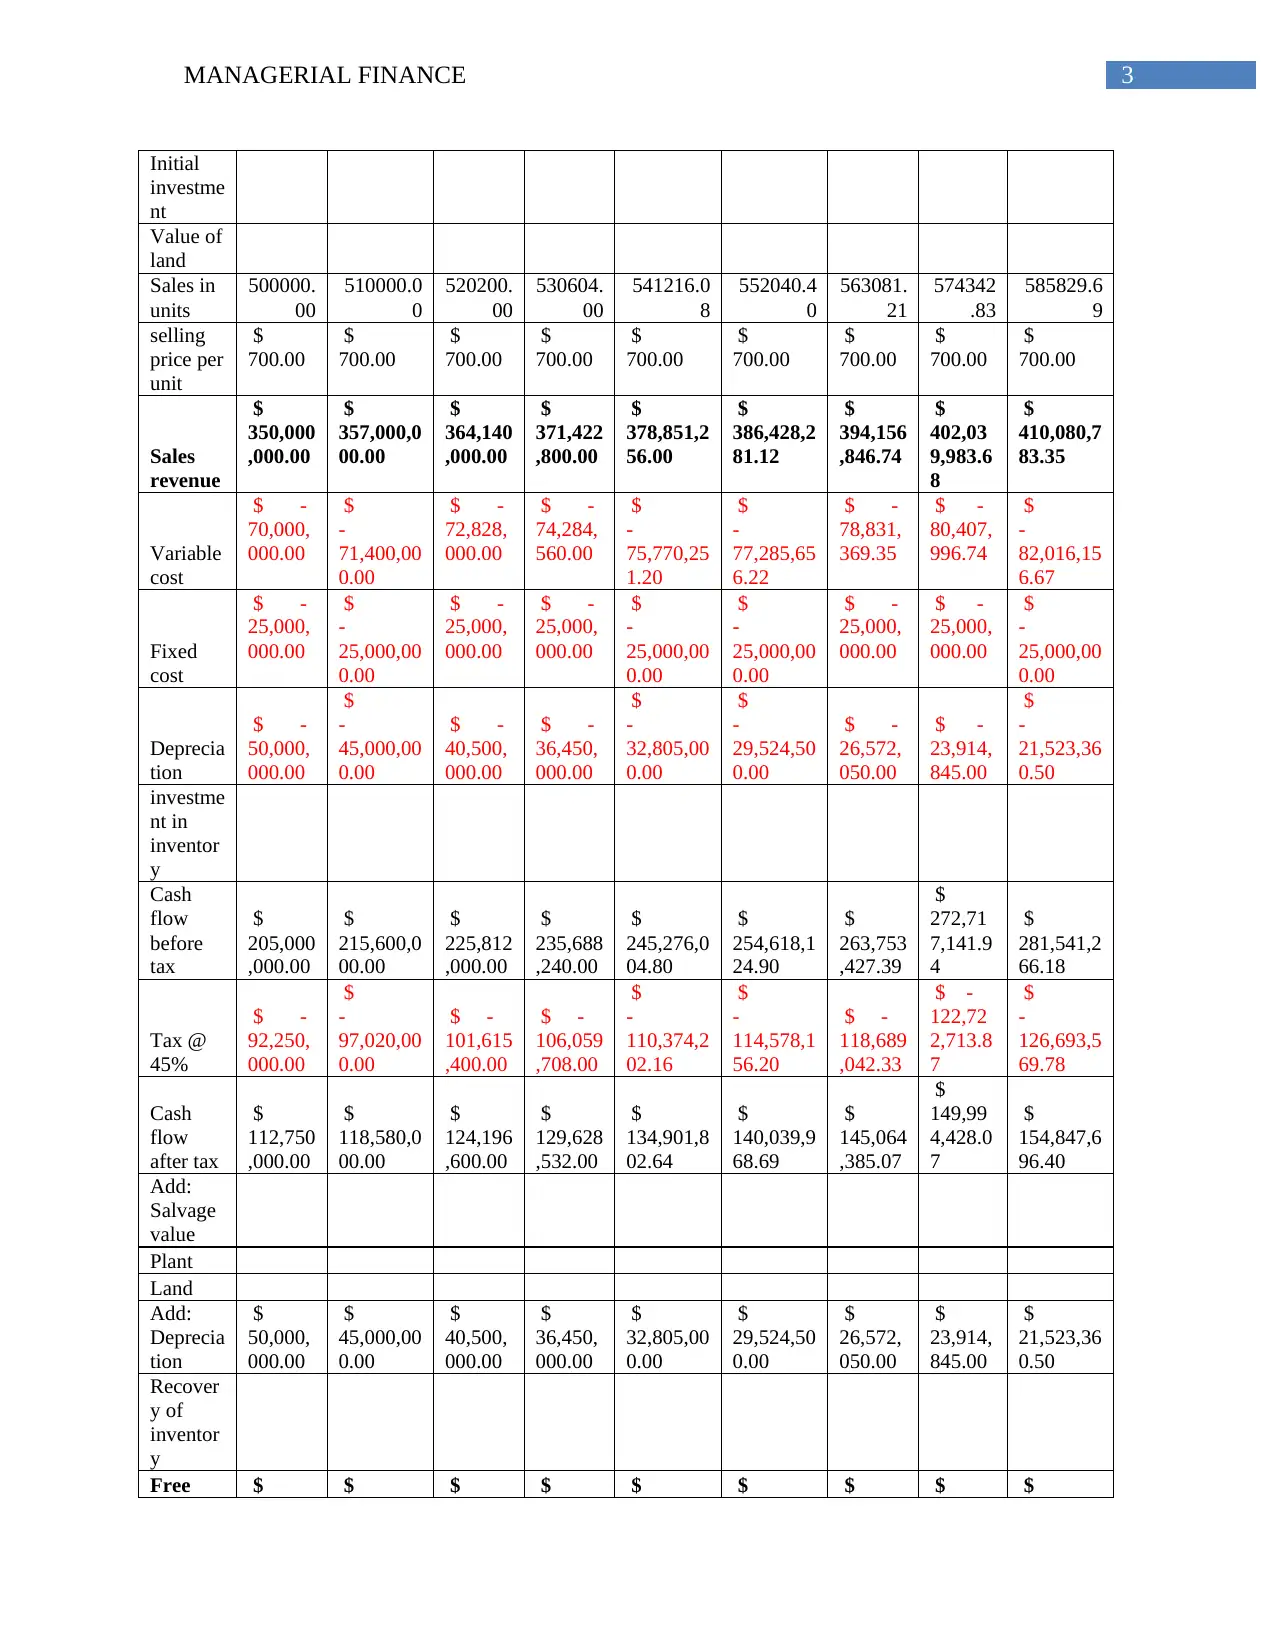
Answer (b)
Yearly cash flow from year 1 to year 9
Year 1 2 3 4 5 6 7 8 9
Introduction
The main objective of this professional report is to answer some question related to
evaluation of the project that is projected to be started by Dell Inc. It is planning for setting up of
new plant for manufacturing laptop. The report will analyse the profitability of the project
through considering different approaches like Net present value, internal rate of return and
discounted payback period. Based on the results from these approaches recommendation will be
provided regarding acceptability of the projects (Žižlavský 2014)
Question 1
Answer (a)
Yearly depreciation expenses for the project are as follows –
Depreciation schedule
Year Depreciation Book value
0 $ 500,000,000.00
1 $ 50,000,000.00 $ 450,000,000.00
2 $ 45,000,000.00 $ 405,000,000.00
3 $ 40,500,000.00 $ 364,500,000.00
4 $ 36,450,000.00 $ 328,050,000.00
5 $ 32,805,000.00 $ 295,245,000.00
6 $ 29,524,500.00 $ 265,720,500.00
7 $ 26,572,050.00 $ 239,148,450.00
8 $ 23,914,845.00 $ 215,233,605.00
9 $ 21,523,360.50 $ 193,710,244.50
10 $ 19,371,024.45 $ 174,339,220.05
Answer (b)
Yearly cash flow from year 1 to year 9
Year 1 2 3 4 5 6 7 8 9
⊘ This is a preview!⊘
Do you want full access?
Subscribe today to unlock all pages.
Trusted by 1+ million students worldwide
3MANAGERIAL FINANCE
Initial
investme
nt
Value of
land
Sales in
units
500000.
00
510000.0
0
520200.
00
530604.
00
541216.0
8
552040.4
0
563081.
21
574342
.83
585829.6
9
selling
price per
unit
$
700.00
$
700.00
$
700.00
$
700.00
$
700.00
$
700.00
$
700.00
$
700.00
$
700.00
Sales
revenue
$
350,000
,000.00
$
357,000,0
00.00
$
364,140
,000.00
$
371,422
,800.00
$
378,851,2
56.00
$
386,428,2
81.12
$
394,156
,846.74
$
402,03
9,983.6
8
$
410,080,7
83.35
Variable
cost
$ -
70,000,
000.00
$
-
71,400,00
0.00
$ -
72,828,
000.00
$ -
74,284,
560.00
$
-
75,770,25
1.20
$
-
77,285,65
6.22
$ -
78,831,
369.35
$ -
80,407,
996.74
$
-
82,016,15
6.67
Fixed
cost
$ -
25,000,
000.00
$
-
25,000,00
0.00
$ -
25,000,
000.00
$ -
25,000,
000.00
$
-
25,000,00
0.00
$
-
25,000,00
0.00
$ -
25,000,
000.00
$ -
25,000,
000.00
$
-
25,000,00
0.00
Deprecia
tion
$ -
50,000,
000.00
$
-
45,000,00
0.00
$ -
40,500,
000.00
$ -
36,450,
000.00
$
-
32,805,00
0.00
$
-
29,524,50
0.00
$ -
26,572,
050.00
$ -
23,914,
845.00
$
-
21,523,36
0.50
investme
nt in
inventor
y
Cash
flow
before
tax
$
205,000
,000.00
$
215,600,0
00.00
$
225,812
,000.00
$
235,688
,240.00
$
245,276,0
04.80
$
254,618,1
24.90
$
263,753
,427.39
$
272,71
7,141.9
4
$
281,541,2
66.18
Tax @
45%
$ -
92,250,
000.00
$
-
97,020,00
0.00
$ -
101,615
,400.00
$ -
106,059
,708.00
$
-
110,374,2
02.16
$
-
114,578,1
56.20
$ -
118,689
,042.33
$ -
122,72
2,713.8
7
$
-
126,693,5
69.78
Cash
flow
after tax
$
112,750
,000.00
$
118,580,0
00.00
$
124,196
,600.00
$
129,628
,532.00
$
134,901,8
02.64
$
140,039,9
68.69
$
145,064
,385.07
$
149,99
4,428.0
7
$
154,847,6
96.40
Add:
Salvage
value
Plant
Land
Add:
Deprecia
tion
$
50,000,
000.00
$
45,000,00
0.00
$
40,500,
000.00
$
36,450,
000.00
$
32,805,00
0.00
$
29,524,50
0.00
$
26,572,
050.00
$
23,914,
845.00
$
21,523,36
0.50
Recover
y of
inventor
y
Free $ $ $ $ $ $ $ $ $
Paraphrase This Document
Need a fresh take? Get an instant paraphrase of this document with our AI Paraphraser
4MANAGERIAL FINANCE
cash
flow
162,750
,000.00
163,580,0
00.00
164,696
,600.00
166,078
,532.00
167,706,8
02.64
169,564,4
68.69
171,636
,435.07
149,99
4,428.0
7
176,371,0
56.90
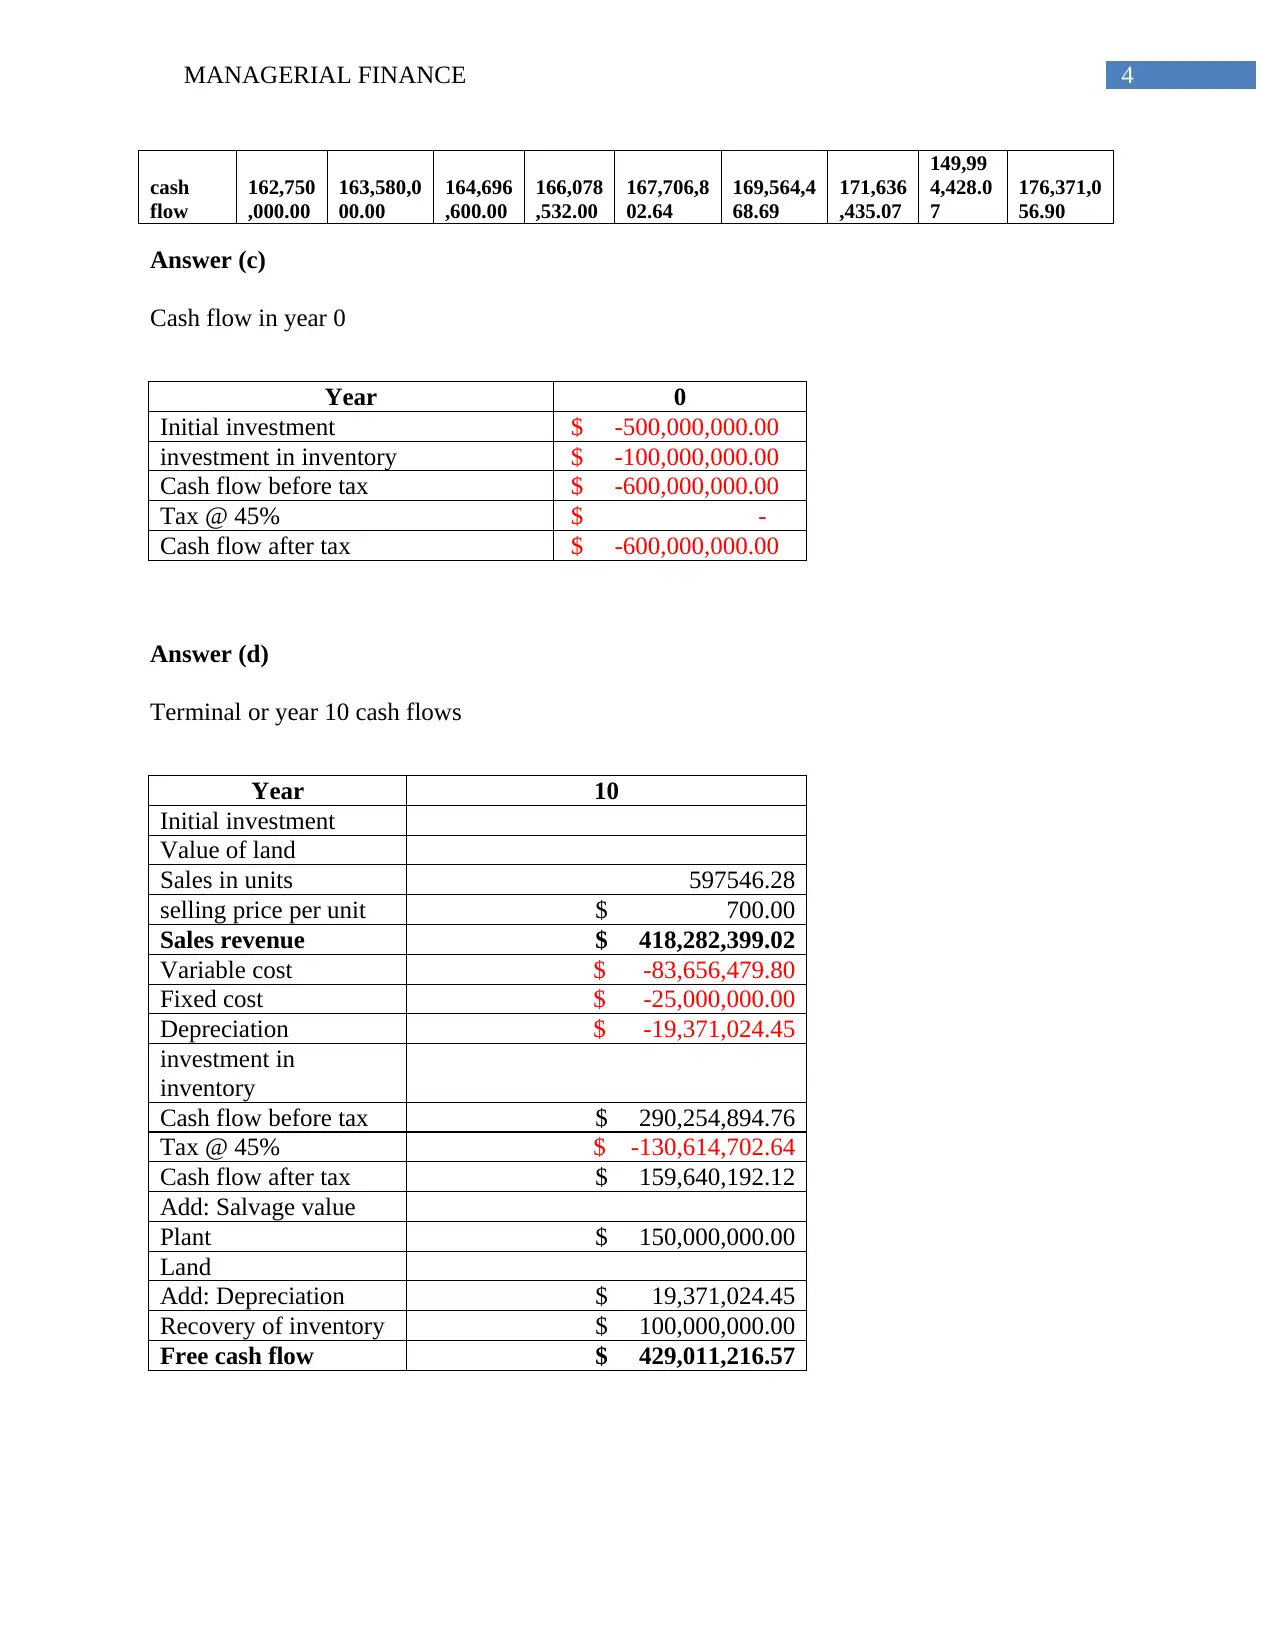
Answer (c)
Cash flow in year 0
Year 0
Initial investment $ -500,000,000.00
investment in inventory $ -100,000,000.00
Cash flow before tax $ -600,000,000.00
Tax @ 45% $ -
Cash flow after tax $ -600,000,000.00
Answer (d)
Terminal or year 10 cash flows
Year 10
Initial investment
Value of land
Sales in units 597546.28
selling price per unit $ 700.00
Sales revenue $ 418,282,399.02
Variable cost $ -83,656,479.80
Fixed cost $ -25,000,000.00
Depreciation $ -19,371,024.45
investment in
inventory
Cash flow before tax $ 290,254,894.76
Tax @ 45% $ -130,614,702.64
Cash flow after tax $ 159,640,192.12
Add: Salvage value
Plant $ 150,000,000.00
Land
Add: Depreciation $ 19,371,024.45
Recovery of inventory $ 100,000,000.00
Free cash flow $ 429,011,216.57
cash
flow
162,750
,000.00
163,580,0
00.00
164,696
,600.00
166,078
,532.00
167,706,8
02.64
169,564,4
68.69
171,636
,435.07
149,99
4,428.0
7
176,371,0
56.90
Answer (c)
Cash flow in year 0
Year 0
Initial investment $ -500,000,000.00
investment in inventory $ -100,000,000.00
Cash flow before tax $ -600,000,000.00
Tax @ 45% $ -
Cash flow after tax $ -600,000,000.00
Answer (d)
Terminal or year 10 cash flows
Year 10
Initial investment
Value of land
Sales in units 597546.28
selling price per unit $ 700.00
Sales revenue $ 418,282,399.02
Variable cost $ -83,656,479.80
Fixed cost $ -25,000,000.00
Depreciation $ -19,371,024.45
investment in
inventory
Cash flow before tax $ 290,254,894.76
Tax @ 45% $ -130,614,702.64
Cash flow after tax $ 159,640,192.12
Add: Salvage value
Plant $ 150,000,000.00
Land
Add: Depreciation $ 19,371,024.45
Recovery of inventory $ 100,000,000.00
Free cash flow $ 429,011,216.57
5MANAGERIAL FINANCE
Answer (e)
Net present value (NPV)
NPV is the difference among present value of future cash flows from any investment and
the amount invested for the acquiring the project. Present value of expected cash flow is
calculated through discounting the cash flows at the required return rate. Positive NPV signifies
better return and the negative NPV signifies worse return that is lower than zero. While any
manager requires comparing the projects and deciding regarding which one is to be selected. It
can be considered as a good approach for analysing the profitability of any investment in the
entity or any new project of the entity (Leyman and Vanhoucke 2016). NPV approach provides
various advantages like it considers the discounted cash flows while computing the computing
the value of net cash flows. Further, it considers the cost of capital and the inherent risk while
making the projections regarding future. Projection of the cash flows for 10 years into future is
definitely lower as compared to the cash flow for the next year. Looking into the NPV
calculation for the manufacturing plant of Dell Inc. it can be identified that the NPV of the
project is $ 258,659,222.81. It is signifying that the project will be able to generate the amount of
initial investment for the project. Hence, if the project is taken up it will increase the
shareholder’s wealth. Hence, considering the NPV only the project shall be accepted (Leyman
and Vanhoucke 2017)
Answer (f)
Internal rate of return and payback period
Internal rate of return (IRR) – IRR is the rate used for estimating the profitability of any
investment. It makes the discount rate of all the cash flows from the particular project equal to
⊘ This is a preview!⊘
Do you want full access?
Subscribe today to unlock all pages.
Trusted by 1+ million students worldwide
6MANAGERIAL FINANCE
zero. For analysing any project on the basis of IRR, it is accepted if the IRR of the project is
more than the project’s cost of capital. Looking into the IRR of the entity it is found that the IRR
of the project is 26% whereas the cost of capital of the company is 16%. Hence, the project shall
be taken up if the IRR is considered for taking up the project (Patrick and French 2016)
Payback period – payback period is the time taken by the project for recovering the investment
cost. To be more specific, payback period is length of time taken by the project to reach the point
of break-even. Desirability of any project is directly associated with the payback period. Shorter
payback period signifies that the investment is attractive as it takes less time to recover the
amount of initial investment. Looking into the payback period computation it is found that the
payback period is 3.66 years and the discounted payback period is 5.88 years. Hence, the project
is able to recover the amount of initial expenses within the useful life of the project (Mellichamp
2017)
Hence it can be identified that from all the aspects the project is acceptable as the NPV of
the project is in positive, IRR of the project is more than the cost of capital and the payback
period is less than the useful life of the project (Magni 2016).
Answer (g)
While analysing any project or investment for the purpose of investment, the cash flows
from the projects are discounted to the present value for assuring that the undertaking’s true
value is captured. Generally, discount rate applied is based on the market rate. However, on the
basis of circumstances associated with the investment or project it is required to utilize the risk
adjusted rate of discount. Risk adjusted rate of discount reveals the relationship among return
and risk (Gorshkov et al. 2014). Practically, an investor is willing to exposed herself or himself
Paraphrase This Document
Need a fresh take? Get an instant paraphrase of this document with our AI Paraphraser
7MANAGERIAL FINANCE
to more risk and it will be rewarded through higher return as greater losses can take place. This is
reflected under risk adjusted discount rate as the adjustment will make changes to the discount
rate that is based on the risk faced. Further the expected return on the investment in enhances
with the increase risk of the project. Most common adjustment to the risk is done due to the
uncertainty to timing, duration of the cash flows and dollar amount. Apart from that, uncertainty
is also there for the long term projects regarding future market scenario, level of inflation and
profitability on investment (Lane and Rosewall 2015). The risk shall be adjusted for the risk
adjusted projects based on the liquidity of the entity and the risk of default from the other parties.
Hence, the entity shall adjust the discount rate for reflecting the investment with potential to
damage the reputation of the entity that may lead to lawsuit or results into the regulatory issues.
Hence, the company’s approach of using the same discount rate for all the projects is not
appropriate and shall adjust the same based on the specific risks of the projects (Gorshkov et al.
2016).
Answer 2
Answer (a)
Total amount required to be raised through bank loan is 600 million. It is to be repaid in
10 equal instalments that is each instalment require payment of (600/10) = 60 million along with
interest. For the project to meet financial discipline, the lowest amount of cash flow that is $
14,99,94,428.07 that is the cash flow of year 8 will be considered. Hence after paying 600,00,000
as principle repayment it will left with 899,94,428.07 for meeting the interest expense. This
amount can meet up the interest rate of 15% as computed in excel.
8MANAGERIAL FINANCE
Answer (b)
Pros of the new system are –
Payment of interest and principle amount can be met comfortably with the cash flow
available with the company
The company will never fall short of the amount for making payment towards the loan
over the useful life of the project.
Cons of the new system are –
Cash is just the projection and based on the same deciding regarding the loan and its
interest rate will not be appropriate.
Due to market changes or other unfavourable circumstances sales as well as cash flow in
any year may not be as expected. In such scenario the company will face liquidity issue
in meeting its debt expenses.
Conclusion and recommendation
Based on the above discussion it can be identified that in question 1, where the entity was
considering taking up the project related to manufacturing plant, it is found that from all the
aspects the project is acceptable as the NPV of the project is in positive, IRR of the project is
more than the cost of capital and the payback period is less than the useful life of the project.
Hence, it is recommended that the project shall be taken up. However, the system used by the
entity that is applying same discount rate for all projects is not appropriate and it is
recommended that it shall adjust the same based on the specific risks of the projects.
⊘ This is a preview!⊘
Do you want full access?
Subscribe today to unlock all pages.
Trusted by 1+ million students worldwide
9MANAGERIAL FINANCE
Reference
Gorshkov, A.S., Rymkevich, P.P., Nemova, D.V. and Vatin, N.I., 2014. Method of calculating
the payback period of investment for renovation of building facades. Stroitel'stvo Unikal'nyh
Zdanij i Sooruzenij, (2), p.82.
Gorshkov, A.S., Vatin, N.I., Rymkevich, P.P. and Kydrevich, O.O., 2018. Payback period of
investments in energy saving. Magazine of Civil Engineering, 78(2).
Lane, K. and Rosewall, T., 2015. Firms’ investment decisions and interest rates. Reserve Bank of
Australia Bulletin. June quarter, pp.1-7.
Leyman, P. and Vanhoucke, M., 2016. Payment models and net present value optimization for
resource-constrained project scheduling. Computers & Industrial Engineering, 91, pp.139-153.
Leyman, P. and Vanhoucke, M., 2017. Capital-and resource-constrained project scheduling with
net present value optimization. European Journal of Operational Research, 256(3), pp.757-776.
Magni, C.A., 2016. Capital depreciation and the underdetermination of rate of return: A unifying
perspective. Journal of Mathematical Economics, 67, pp.54-79.
Mellichamp, D.A., 2017. Internal rate of return: Good and bad features, and a new way of
interpreting the historic measure. Computers & Chemical Engineering, 106, pp.396-406.
Patrick, M. and French, N., 2016. The internal rate of return (IRR): projections, benchmarks and
pitfalls. Journal of Property Investment & Finance, 34(6), pp.664-669.
Žižlavský, O., 2014. Net present value approach: method for economic assessment of innovation
projects. Procedia-Social and Behavioral Sciences, 156, pp.506-512.
Paraphrase This Document
Need a fresh take? Get an instant paraphrase of this document with our AI Paraphraser

10MANAGERIAL FINANCE
1 out of 11
Related Documents


Your All-in-One AI-Powered Toolkit for Academic Success.
+13062052269
info@desklib.com
Available 24*7 on WhatsApp / Email
![[object Object]](/_next/static/media/star-bottom.7253800d.svg)
Unlock your academic potential
Copyright © 2020–2026 A2Z Services. All Rights Reserved. Developed and managed by ZUCOL.