ACC515 Report: Financial Performance Evaluation of AMP Limited
VerifiedAdded on 2023/06/09
|11
|1810
|225
Report
AI Summary
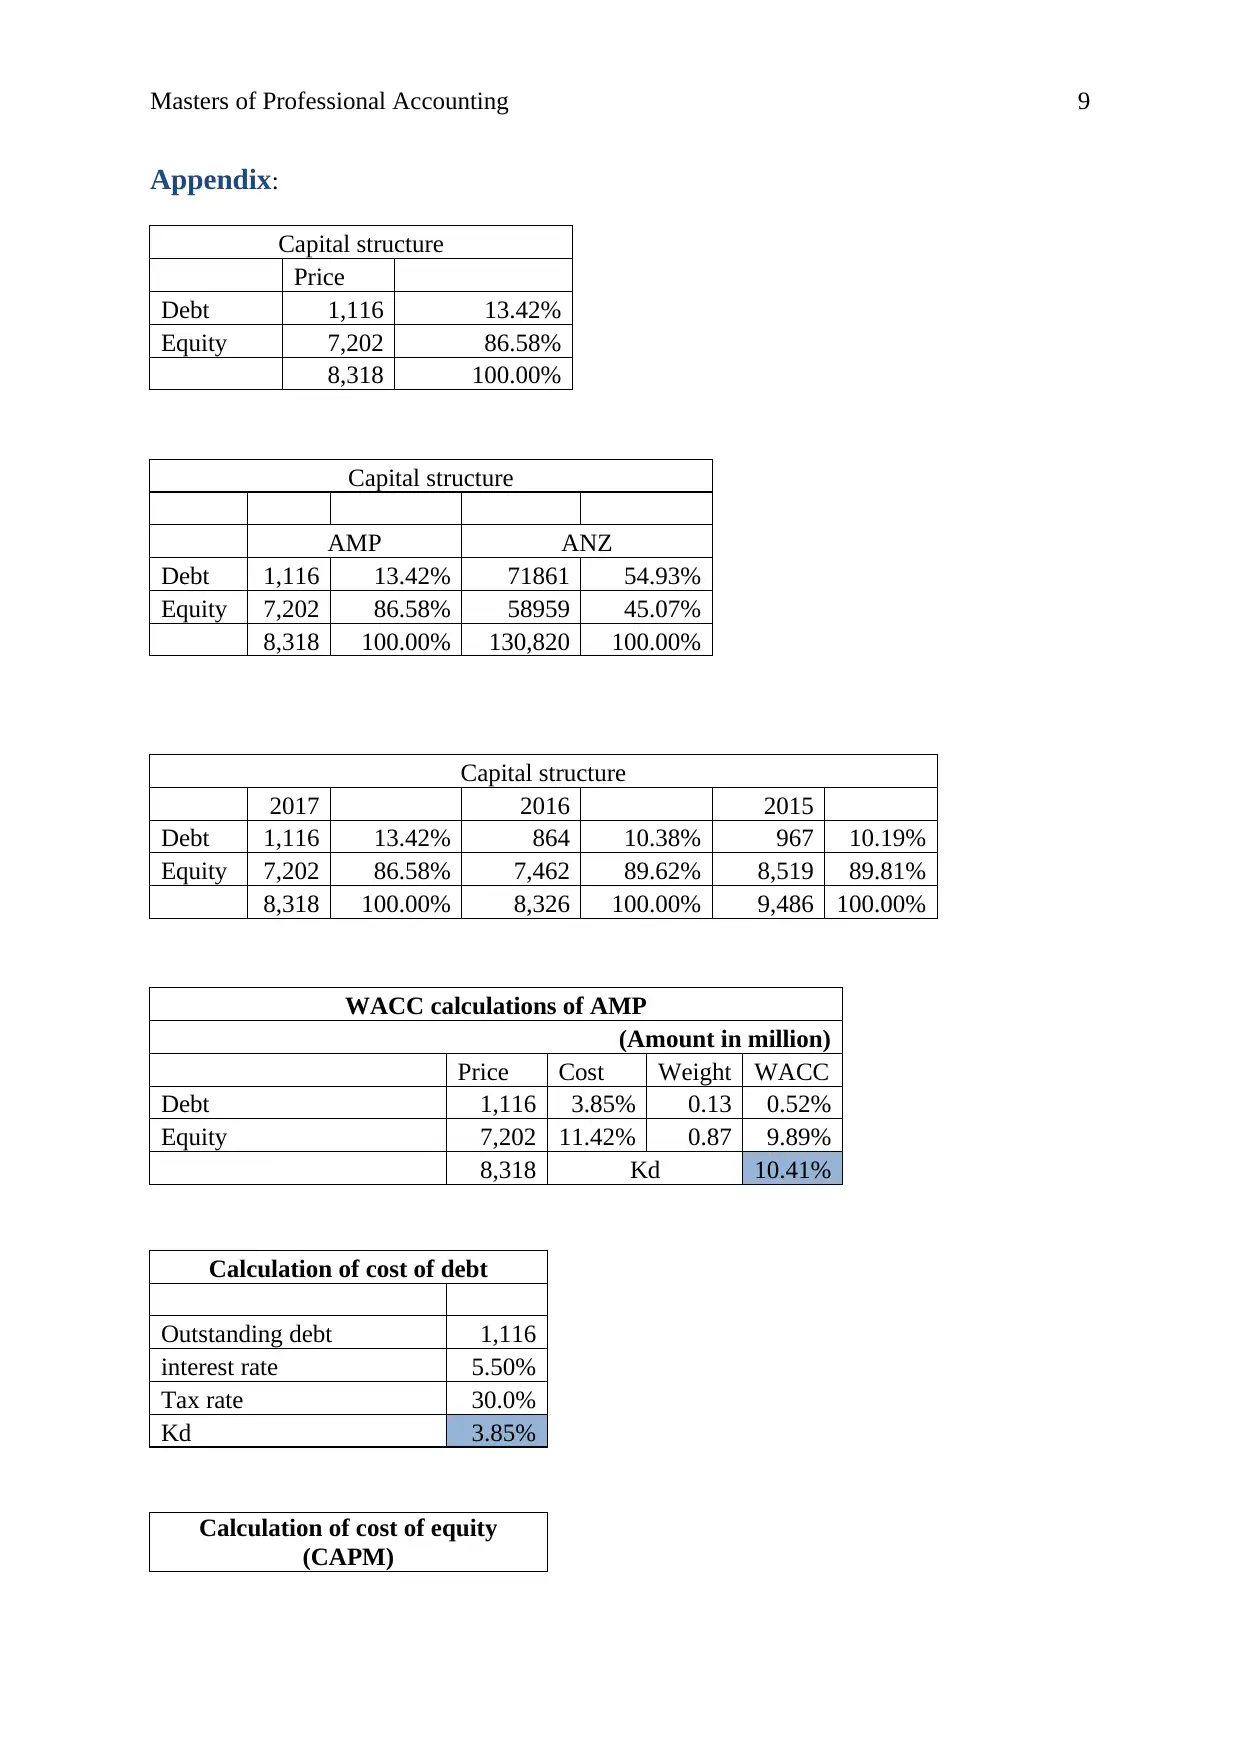
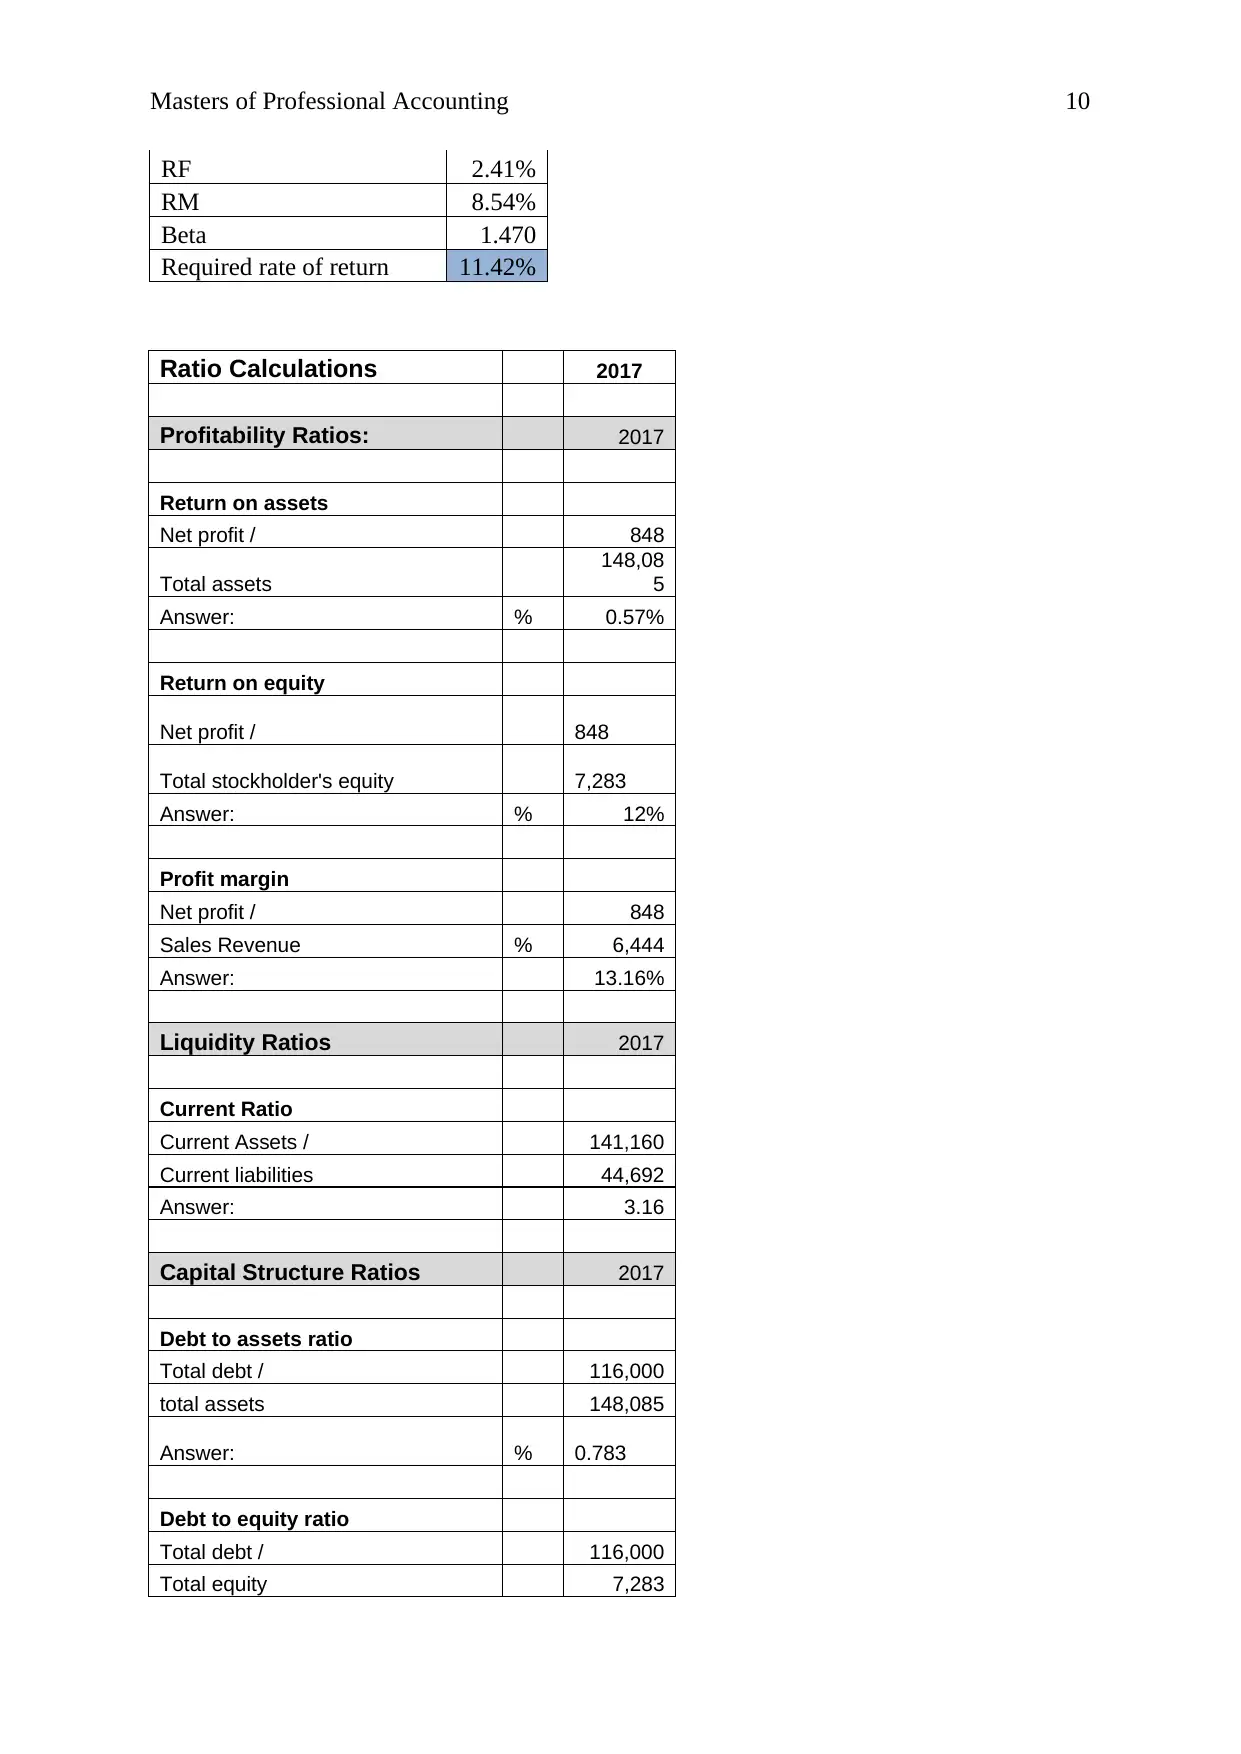
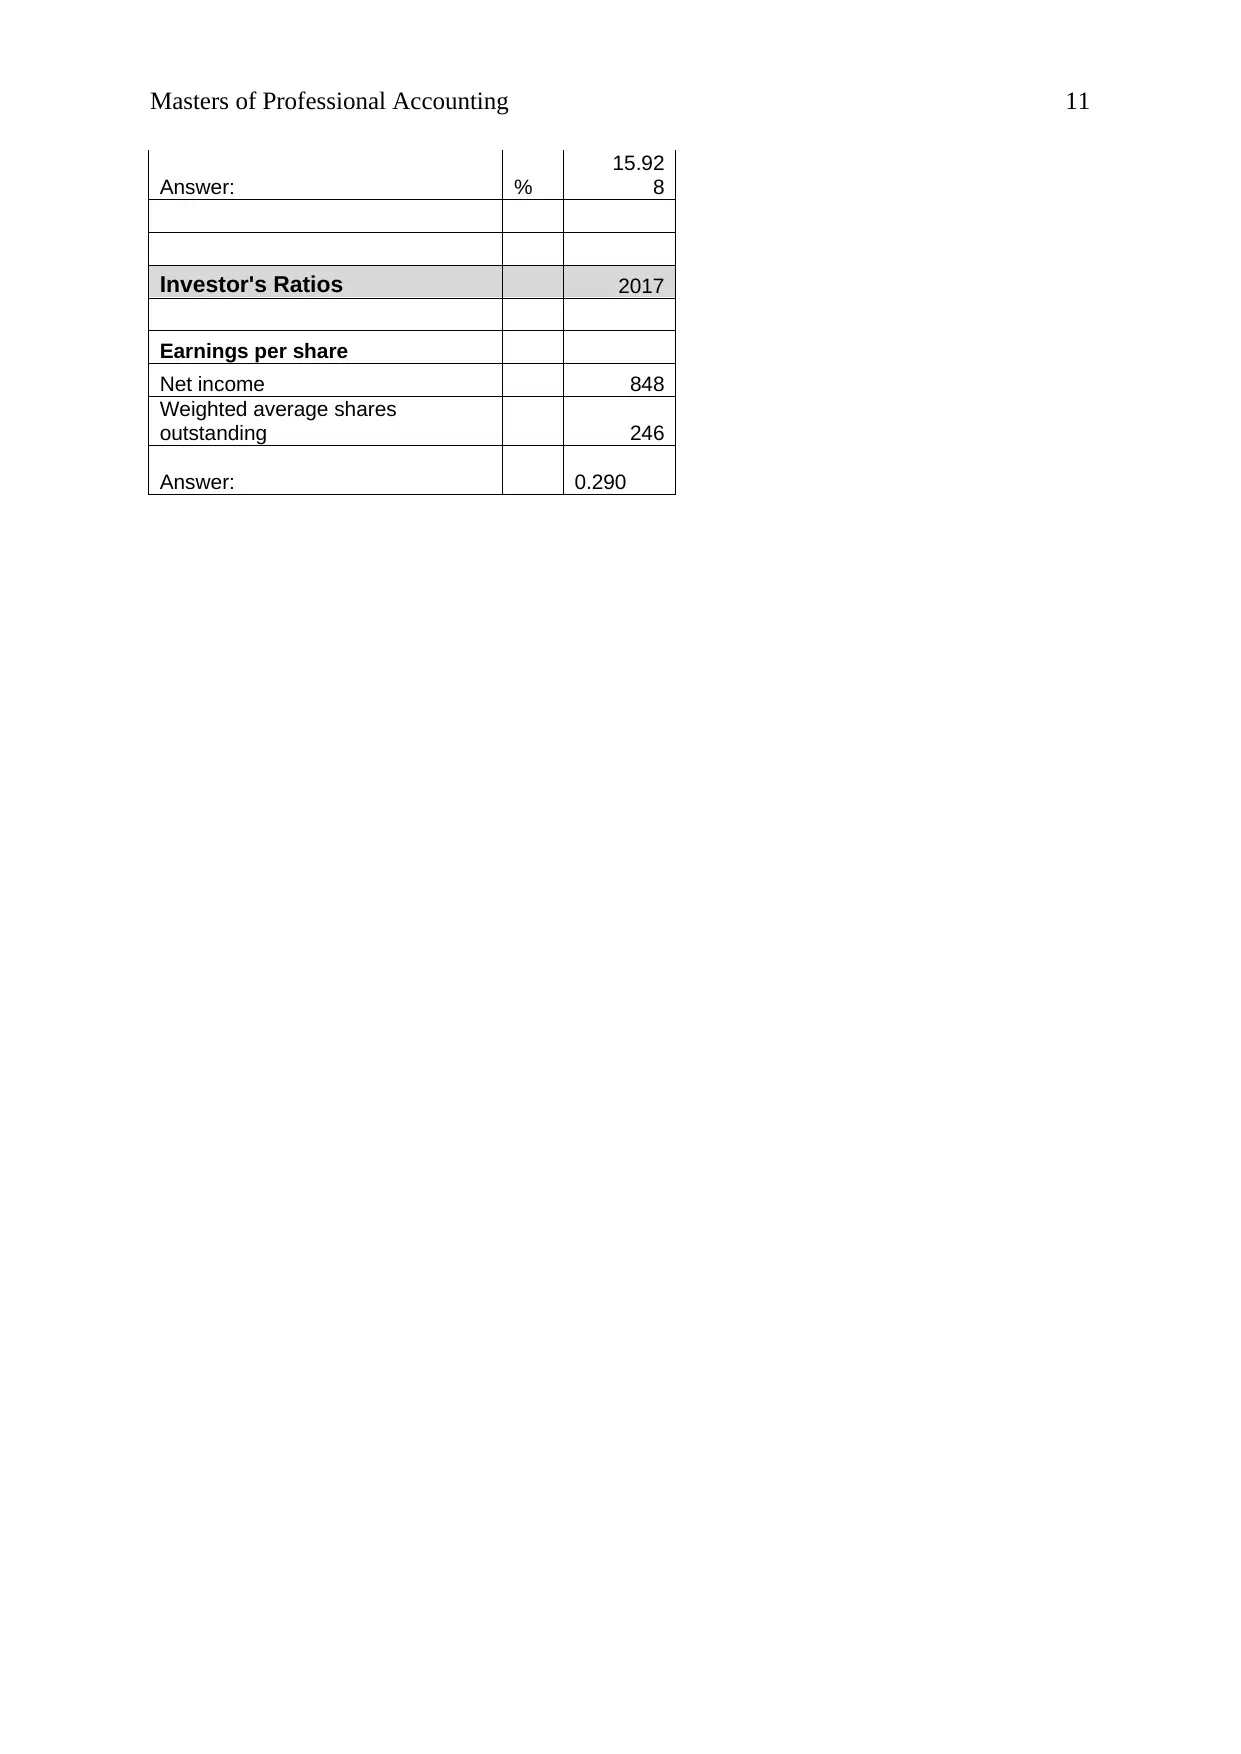
This report provides a comprehensive financial analysis of AMP Limited, focusing on its capital structure, weighted average cost of capital (WACC), and key financial ratios. The analysis assesses the company's funding sources, including debt and equity, and compares its capital structure with competitor ANZ bank. The WACC calculation reveals the cost of debt and equity, highlighting areas for improvement. Ratio analysis evaluates profitability, liquidity, and capital structure, while a discussion of material risks, such as strategic, credit, and operational risks, underscores their potential impact on the company's stock price. The report also addresses AMP's response to the Financial Services Royal Commission, including apologies, governance changes, and compensation to stakeholders. The report concludes by summarizing the risks and implemented changes to enhance overall performance. Desklib offers a wide range of solved assignments and study tools to support students.

Running Head: Masters of Professional Accounting
1
Project Report: Masters of Professional Accounting
1
Project Report: Masters of Professional Accounting
Paraphrase This Document
Need a fresh take? Get an instant paraphrase of this document with our AI Paraphraser

Masters of Professional Accounting 2
Executive summary
In the report, AMP limited’s capital structure, cost of capital and ratio analysis has
been studied to measure the overall performance of the company as well as the various risks
and their impact has also been measured to identify the overall performance of the business
and reach over a conclusion. The report mainly concentrates on the financial position and
financial performance of the company.

Masters of Professional Accounting 3
Contents
Introduction.......................................................................................................................4
Company overview...........................................................................................................4
Capital structure................................................................................................................4
WACC..............................................................................................................................5
Ratio analysis....................................................................................................................5
Material risk......................................................................................................................5
Conclusion........................................................................................................................6
References.........................................................................................................................8
Appendix...........................................................................................................................9
⊘ This is a preview!⊘
Do you want full access?
Subscribe today to unlock all pages.

Trusted by 1+ million students worldwide

Masters of Professional Accounting 4
Introduction:
Financial analysis on a business is one of the crucial and essential elements as this
process helps the business to identify the overall position of the company. It also helps the
business and its stakeholders to make various decisions. The main process of items of
financial analysis process is ratio analysis, calculation of WACC, capital structure
identification etc. Capital structure is a process which explains that how a business finances
its growth and the operations through using various different funds sources. The main capital
structure items are debt, equity, preference shares etc (Higgins, 2012). A business’s
proportion of long and short term debt is recognized at the time of evaluating the capital
structure.
On the other hand, WACC is the total weighted cost of a business which is required to
pay by the business to the debt holders and shareholders of the company. Ratio analysis
explains about the overall financial position and performance of the company (Gapenski &
Reiter, 2008). In the report, AMP limited’s capital structure, cost of capital and ratio analysis
has been studied to measure the overall performance of the company and reach over a
conclusion.
Company overview:
AMP is a financial and banking service company in New Zealand and Australian
market. It offers the investment products, superannuation, insurance, banking products and
financial advice containing saving accounts and home loans (Home, 2018). AMP has been
formed in 1849. The company also offers various services to its clients related to the financial
and wealth management services.
Capital structure:
Capital structure of the company has been identified and it has been measured that the
company has mainly raised the funds through borrowings and equity. The debt and equity
ratio of the company is 13%:87%. It explains that the equity position of the company is quite
higher and it is suggested to the company to reduce the equity level and improve the debt
level to manage the leverage position of the company and it would also help the company to
reduce the taxation level.
The capital structure of the business has been compared with the competitor, ANZ
bank and it has been found that the company is required to manage optimal capital structure
Paraphrase This Document
Need a fresh take? Get an instant paraphrase of this document with our AI Paraphraser

Masters of Professional Accounting 5
to improve the market position and manage the cost. The last 3 year capital structure of the
business explains that the company has improved the debt capital from last 2 years.
Figure 1: Capital Structure
WACC:
WACC position of the business has been evaluated further and it has been found that
the cost of debt and cost of equity of the business are 3.85% and 11.42% respectively. The
cost of equity explains that the business is offering only 3.85% to its shareholders who are
quite lower and it is suggested to the business to improve the level. It explains that the overall
WACC of the business is 10.41% which is quite higher and it is suggested to the company to
control on it through improving the debt proportion in capital structure (Fridson & Alvarez,
2011).
Ratio analysis:
The ratio analysis study explains that the overall profitability position of the company
is quite better. However, the business is required to reduce the liquidity level. It would help
the business to maintain the extra cost. The capital structure position of the business is not
optimal. In addition, the earnings of the company are quite higher which attracts the
customers to invest more in the company.
Material risk:
Annual report (2017) of the business explains that the material risk has been
categorized by the business in 7 categories to ensure that each risk is identified separately and

Masters of Professional Accounting 6
a better policy could be prepared for the business to save it from any risk. The stated 7 risk of
the business are strategic risk, credit risk, market risk, insurance risk, liquidity risk,
operational risk and concentration risk. All of this risk plays a crucial role in the business.
Few changes into any of them could affect the internal as well as external position of
the business. It has been identified that each of this risk could impact the stock price of the
business as well (Annual report, 2018). If the strategic risk is concerned, the affect of
strategy could affect the market and internal position of the business due to which the
investors would lose their interest in the stock price of the company which would lead to the
lower stock price of the company.
During the Financial Services Royal Commission, the company has apologized to the
customers and other stakeholders of the company and has agreed that due to their faults, the
stakeholders of the business have to face few losses. The business has told that they have
made few changes into the governance, controls and policies to improve the performance and
build a strong connection in the market. The business has also paid the compensation to the
related parties and stakeholders who have helped the business to strengthen the relationship
in industry and within the stakeholders (News, 2018).
The business has clearly accepted the mistakes and sincerely apologized for that along
with the compensation to the affected parties that ultimately helped the business to manage
the strong position in the industry and build a strong network in the market. The overall
changes done by the management and the top level executives of the company are
commendable and it has helped the business to grow rapidly and manage the stock prices in
the market (Rabin, 2013).
Through evaluating the financial and non financial performance of AMP, it has been
recognized that the company was facing strategic risk, operational risk and the marketing risk
due to which the financial performance of the business has also been affected a bit at the end
of the year 2017. The business has made few changes to reduce the level of these risks. Such
as, the company has improved the debt level from last years to reduce the strategic and
marketing risk of the business (annual report, 2018). The overall wealth of the business has
also been improved by the business through making various changes into its policies and the
operations.
Conclusion:
⊘ This is a preview!⊘
Do you want full access?
Subscribe today to unlock all pages.

Trusted by 1+ million students worldwide

Masters of Professional Accounting 7
To conclude, currently business is facing little risk which includes strategic risk,
operational risk and market risk of the business. The company has planned few changes and
implemented some of them to reduce the threat of these risks and improve the overall
performance of the business.
To conclude, currently business is facing little risk which includes strategic risk,
operational risk and market risk of the business. The company has planned few changes and
implemented some of them to reduce the threat of these risks and improve the overall
performance of the business.
Paraphrase This Document
Need a fresh take? Get an instant paraphrase of this document with our AI Paraphraser

Masters of Professional Accounting 8
References:
Annual Report. (2018). AMP Limited. [online]. Retrieved from:
http://member.afraccess.com/media?id=CMN://2A1072055&filename=20180320/
AMP_01963508.pdf
Chandra, P. (2011). Financial management. Tata McGraw-Hill Education.
Fridson, M. S., & Alvarez, F. (2011). Financial statement analysis: a practitioner's
guide (Vol. 597). John Wiley & Sons.
Gapenski, L. C., & Reiter, K. L. (2008). Healthcare finance: an introduction to accounting
and financial management. Chicago, IL: Health Administration Press.
Higgins, R. C. (2012). Analysis for financial management. McGraw-Hill/Irwin.
Home. (2018). AMP Limited. [online]. Retrieved from: https://www.amp.com.au/
News. (2018). AMP Limited. [online]. Retrieved from:
https://www.amp.com.au/news/2018/may/AMP-and-the-Royal-Commission
Rabin, M. (2013). Risk aversion and expected-utility theory: A calibration theorem.
In Handbook of the Fundamentals of Financial Decision Making: Part I (pp. 241-252).

Masters of Professional Accounting 9
Appendix:
Capital structure
Price
Debt 1,116 13.42%
Equity 7,202 86.58%
8,318 100.00%
Capital structure
AMP ANZ
Debt 1,116 13.42% 71861 54.93%
Equity 7,202 86.58% 58959 45.07%
8,318 100.00% 130,820 100.00%
Capital structure
2017 2016 2015
Debt 1,116 13.42% 864 10.38% 967 10.19%
Equity 7,202 86.58% 7,462 89.62% 8,519 89.81%
8,318 100.00% 8,326 100.00% 9,486 100.00%
WACC calculations of AMP
(Amount in million)
Price Cost Weight WACC
Debt 1,116 3.85% 0.13 0.52%
Equity 7,202 11.42% 0.87 9.89%
8,318 Kd 10.41%
Calculation of cost of debt
Outstanding debt 1,116
interest rate 5.50%
Tax rate 30.0%
Kd 3.85%
Calculation of cost of equity
(CAPM)
⊘ This is a preview!⊘
Do you want full access?
Subscribe today to unlock all pages.

Trusted by 1+ million students worldwide

Masters of Professional Accounting 10
RF 2.41%
RM 8.54%
Beta 1.470
Required rate of return 11.42%
Ratio Calculations 2017
Profitability Ratios: 2017
Return on assets
Net profit / 848
Total assets
148,08
5
Answer: % 0.57%
Return on equity
Net profit / 848
Total stockholder's equity 7,283
Answer: % 12%
Profit margin
Net profit / 848
Sales Revenue % 6,444
Answer: 13.16%
Liquidity Ratios 2017
Current Ratio
Current Assets / 141,160
Current liabilities 44,692
Answer: 3.16
Capital Structure Ratios 2017
Debt to assets ratio
Total debt / 116,000
total assets 148,085
Answer: % 0.783
Debt to equity ratio
Total debt / 116,000
Total equity 7,283
Paraphrase This Document
Need a fresh take? Get an instant paraphrase of this document with our AI Paraphraser

Masters of Professional Accounting 11
Answer: %
15.92
8
Investor's Ratios 2017
Earnings per share
Net income 848
Weighted average shares
outstanding 246
Answer: 0.290
Answer: %
15.92
8
Investor's Ratios 2017
Earnings per share
Net income 848
Weighted average shares
outstanding 246
Answer: 0.290
1 out of 11
Related Documents

Your All-in-One AI-Powered Toolkit for Academic Success.
+13062052269
info@desklib.com
Available 24*7 on WhatsApp / Email
Unlock your academic potential
Copyright © 2020–2025 A2Z Services. All Rights Reserved. Developed and managed by ZUCOL.