ACC91210 Finance for Managers: Capital Budgeting and Policy Analysis
VerifiedAdded on 2023/01/20
|26
|3100
|50
Report
AI Summary
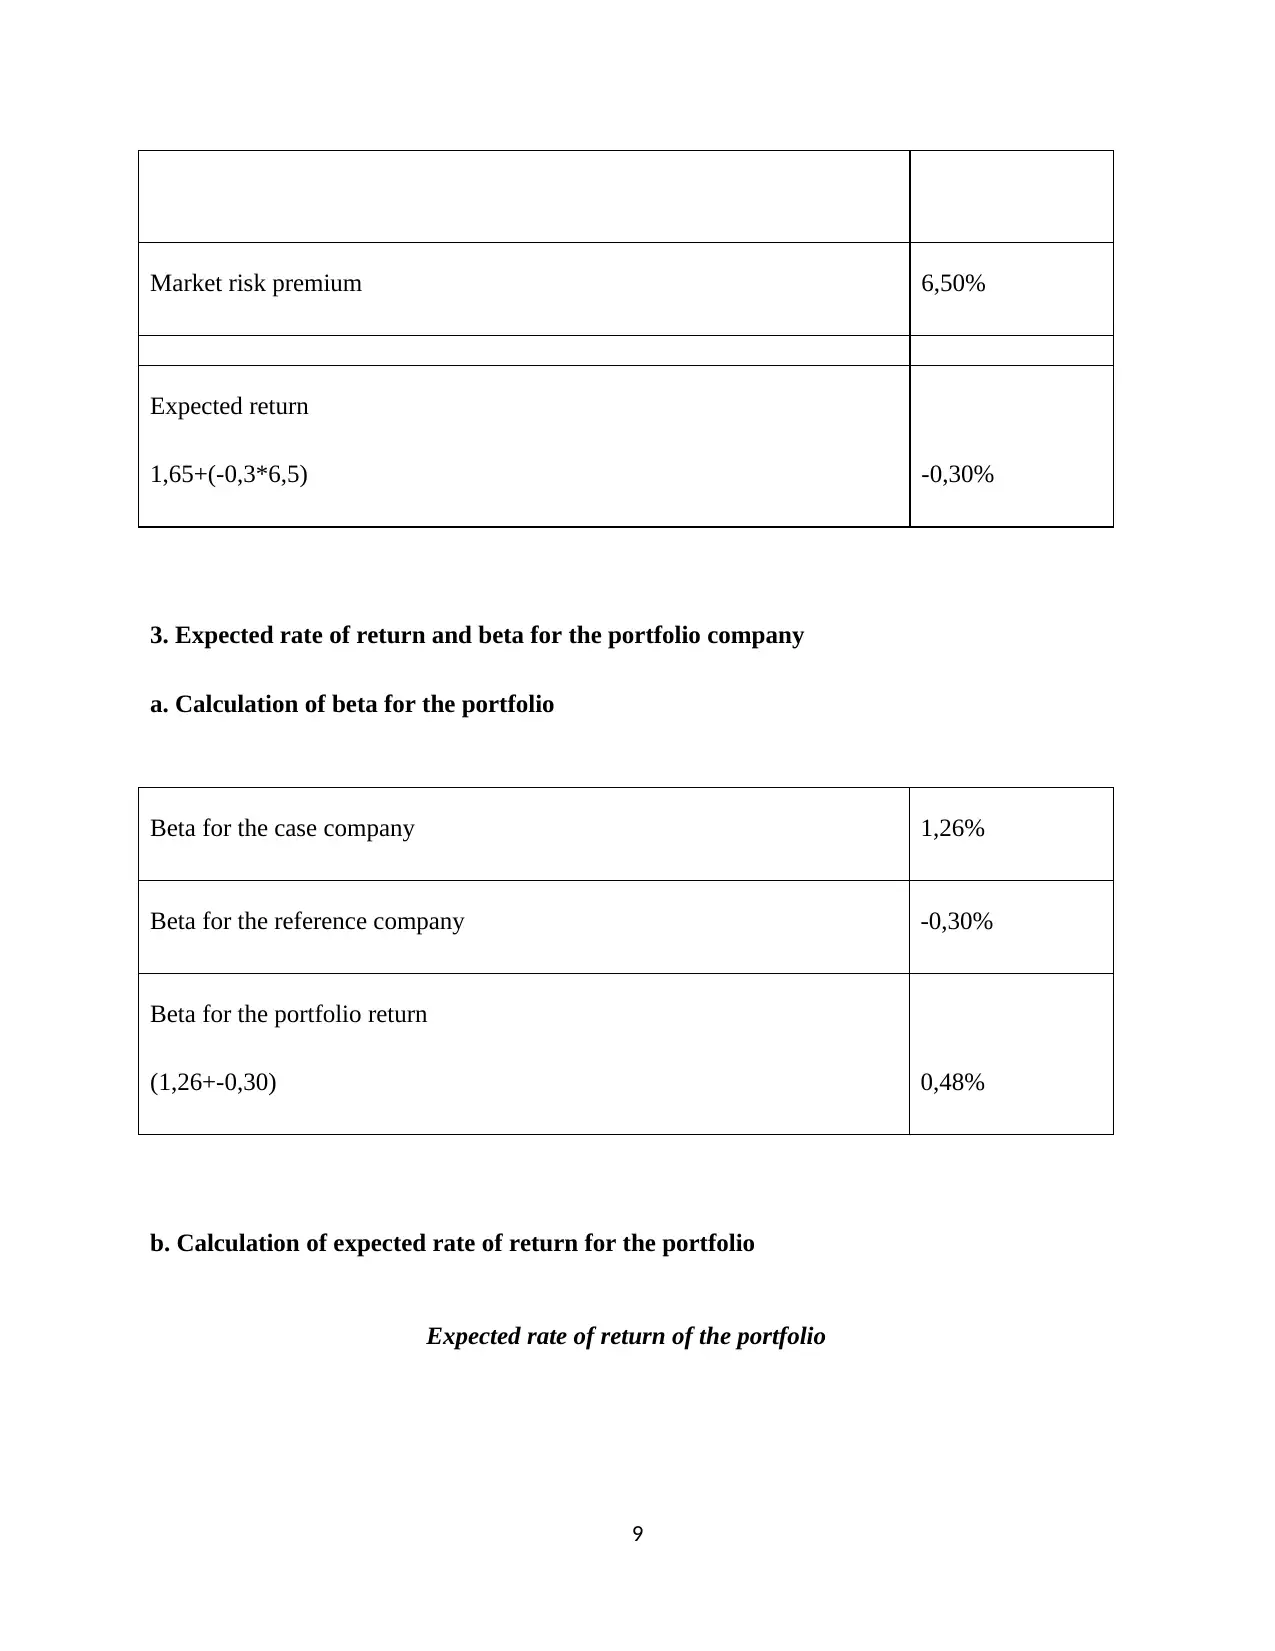
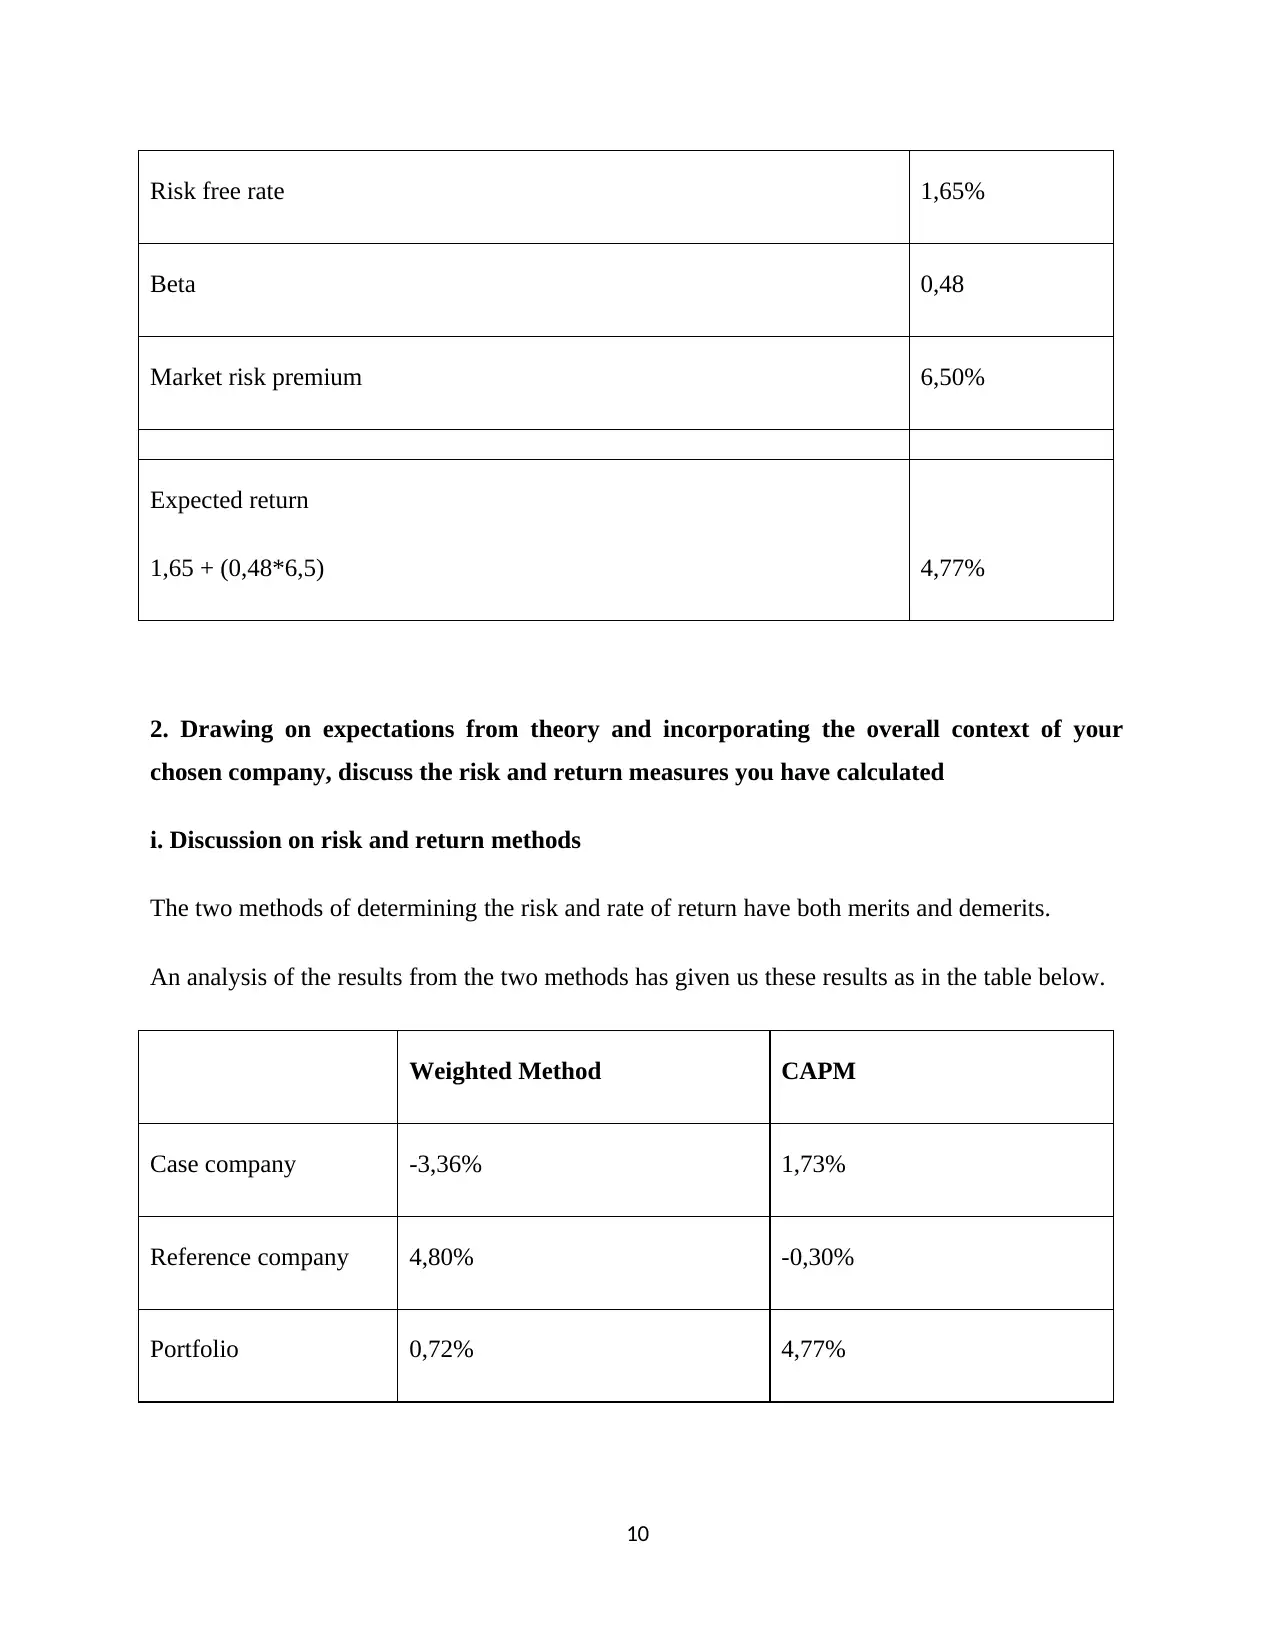
This report provides a comprehensive analysis of capital structure, payout policies, and capital budgeting, as applied to a case study company within the context of ACC91210 Finance for Managers. The report begins with an examination of capital structure and payout policies, including an evaluation of risk and return measures using the Capital Asset Pricing Model (CAPM) and weighted average methods. It then transitions to capital budgeting, focusing on a financial analysis of a proposed project involving recycling sachet waste, using techniques such as payback period and net present value (NPV). The analysis includes detailed financial projections and cash flow calculations, aiming to determine the project's feasibility and its potential impact on the company's financial performance, addressing the importance of capital investment decisions and strategic financial planning.

ACC91210
Finance for Managers
1
Finance for Managers
1
Paraphrase This Document
Need a fresh take? Get an instant paraphrase of this document with our AI Paraphraser

Table of Contents
TASK 1............................................................................................................................................3
Capital Structure and Payout Policy Analysis.............................................................................3
TASK 2..........................................................................................................................................12
Capital Budgeting......................................................................................................................12
References......................................................................................................................................25
2

TASK 1
Capital Structure and Payout Policy Analysis
1. The historical monthly rates of return for the market index only (monthly rates of return
for the companies are given)
Rate of return of the index
The formula for the calculating the monthly rate of return is change in index value as a
percentage.
In our case we will get the difference between the current month and previous month. We will
express the difference as a percentage of the previous month’s index.
Month Current index Previous index
Monthly
Rates of return
01-Oct 59 483,09
01-Nov 58 149,20 59 483,09 -2,24%
01-Dec 57 887,91 58 149,20 -0,45%
01-Jan 60 199,50 57 887,91 3,99%
01-Feb 63 843,82 60 199,50 6,05%
01-Mar 64 292,24 63 843,82 0,70%
3
⊘ This is a preview!⊘
Do you want full access?
Subscribe today to unlock all pages.

Trusted by 1+ million students worldwide

A. The historical average rate of return and standard deviation of returns
i. Average mean and standard deviation for the case company (BLD).
a. Rate of return for the case company
Rate of return
01-Oct
01-Nov -9,09%
01-Dec -3,14%
01-Jan 0,02%
01-Feb 0,61%
01-Mar -5,22%
4
i. Average mean and standard deviation for the case company (BLD).
a. Rate of return for the case company
Rate of return
01-Oct
01-Nov -9,09%
01-Dec -3,14%
01-Jan 0,02%
01-Feb 0,61%
01-Mar -5,22%
4
Paraphrase This Document
Need a fresh take? Get an instant paraphrase of this document with our AI Paraphraser

The average mean rate of return is the sum of the rates of return divided by the number of
periods. The sum of the rates of return is -16.82 and the number of periods is 5 months.
Average rate of return = -16.82/5
= -3.36%
Standard deviation is a measure of variability from the expected mean in a population.
The formula is
Standard deviation is 3.56
ii. Average mean and standard deviation for the reference company.
a. Rate of return for the reference company
Month Rate of return
01-Oct
01-Nov 14%
01-Dec 8%
01-Jan 1%
01-Feb -2%
5

01-Mar 3%
Average rate of return = sum of rates of returns /number of periods
= 24/5
= 4.8 %
Standard deviation is 5.64
iii. Average mean and standard deviation for the index
Rates of return for the index
Month Rate of return
01-Oct
01-Nov -2,24%
01-Dec -0,45%
01-Jan 3,99%
01-Feb 6,05%
01-Mar 0,70%
6
Average rate of return = sum of rates of returns /number of periods
= 24/5
= 4.8 %
Standard deviation is 5.64
iii. Average mean and standard deviation for the index
Rates of return for the index
Month Rate of return
01-Oct
01-Nov -2,24%
01-Dec -0,45%
01-Jan 3,99%
01-Feb 6,05%
01-Mar 0,70%
6
⊘ This is a preview!⊘
Do you want full access?
Subscribe today to unlock all pages.

Trusted by 1+ million students worldwide

Average rate of return = sum of rates of returns /number of periods
= 8.06/5
= 1.61%
Standard deviation is 3.01
iv. Average mean and standard deviation for an equally weighted portfolio of the case
company and the reference company
In this case since it an equally weighted portfolio; we will use the arithmetic mean.
Case company average return -3,36%
Reference company average return 4,80%
Average return for the portfolio 0,72%
Case company standard deviation 3,56%
Reference company standard deviation 5,64%
standard deviation for the portfolio 4,60%
7
Paraphrase This Document
Need a fresh take? Get an instant paraphrase of this document with our AI Paraphraser

B. Calculate the expected returns and portfolio beta as follows:
i. Capital Asset Pricing Model
1. Expected rate of return for the case company
The formula is:
Expected return = Risk Free Rate + [Beta x Market Return Premium]
Risk free rate 1,65%
Beta 1,26%
Market risk premium 6,50%
Expected return
(1,65+(1,26*6,5) 1,7%
2. Expected rate of return for the reference company
Risk free rate 1,65%
Beta -0,3
8

Market risk premium 6,50%
Expected return
1,65+(-0,3*6,5) -0,30%
3. Expected rate of return and beta for the portfolio company
a. Calculation of beta for the portfolio
Beta for the case company 1,26%
Beta for the reference company -0,30%
Beta for the portfolio return
(1,26+-0,30) 0,48%
b. Calculation of expected rate of return for the portfolio
Expected rate of return of the portfolio
9
⊘ This is a preview!⊘
Do you want full access?
Subscribe today to unlock all pages.

Trusted by 1+ million students worldwide

Risk free rate 1,65%
Beta 0,48
Market risk premium 6,50%
Expected return
1,65 + (0,48*6,5) 4,77%
2. Drawing on expectations from theory and incorporating the overall context of your
chosen company, discuss the risk and return measures you have calculated
i. Discussion on risk and return methods
The two methods of determining the risk and rate of return have both merits and demerits.
An analysis of the results from the two methods has given us these results as in the table below.
Weighted Method CAPM
Case company -3,36% 1,73%
Reference company 4,80% -0,30%
Portfolio 0,72% 4,77%
10
Paraphrase This Document
Need a fresh take? Get an instant paraphrase of this document with our AI Paraphraser

The weighted rate method is simplistic as it simply gives weight to the rate of return to determine
the expected rate of return (Corporate Finance Institute, 2019). However this is complemented
by analysing the standard deviation which gives us an indication of the volatility of the rates of
return.
In our case, the reference company having a higher rate of return is more volatile and caution
will have to be taken of such a stock is to be bought. The use of historical data may make us
reach wrong conclusions on the current price and future price.
The comparison of the stocks has to be done individually and this may make it less reliable when
doing comparison with the market. However to resolve this, another concept of weighting is
introduced. Assigning the stocks and prices different weights can assist in normalising the
values. This will have the effect of assigning the fair value to each stock and value depending on
the criteria used.
The capital asset pricing method tries to align the returns by comparing this with the
performance of the market. This means that the pricing of the stock is pegged to the risk attached
to it. The benchmark is the risk free rate, which the rate of government bonds is widely used as a
proxy.
The introduction of beta which is measure the stock volatility as compared to the volatility of the
market. This gives us a value that is aligned to the market. Investors basically want to have a
return higher than the set risk free rate. This is compensation for the time taken in holding the
stock and risk.
However this method relies on assumptions of fixed interest rates for government bonds,
predictable investor behaviours and market fundamentals. However it remains a realistic tool for
estimating if a stock is fairly valued (Mackaya and Haque, 2016).
The two methods try to predict the return of a stock. However other factors also affect the pricing
of stocks and subsequent expected returns. Total return consists of two components, income
stream investment which provides a performance measure focusing on an income stream on an
asset. The second is the coupon and dividend yield where investors are provided with useful
information but the components may be changed due to change in assets i.e. capital gain or
11

capital loss which some may have zero bonds where shares do not pay any dividends (Filatova,
2018).
TASK 2
Capital Budgeting
MEMO
To: The CEO
From: Finance Manager
Subject: Financial Projections for recycling sachet waste
The environmental impact of plastic waste is reduce by producing recycled plastic which does
not have adverse impact on profit of the company and it also enhances the goodwill of the
company in the competitive market. While introducing this innovation in the company some
research and development program has been done by the R&D department which provides some
useful benefits of recycling the plastic waste. The main plan is to replace the use of virgin plastic
in packaging which reduces the cost and enhances the profit margin for the company. The
finance department has some estimation regarding the packaging cost based on virgin plastic
which is expected to increase by 2% per year after year which adverse effect on the company’s
profit margin. The recent variable plastic packaging costs is $27 million which has been
increasing per year. If the company recycles the sachet plastic which used in packaging the
products reduces the following two points which are mentioned below:
Firstly, it will reduce costs compared to production of virgin plastic and this projection
also reduces the annual forecast cost of packaging by 10%
Secondly, a virgin plastic supplier margin which is equal to 8% of annual forecast
packaging costs will be reduced. This benefit is expected to be offset by a new cost
associated with paying a partner to supply plastic waste raw material for recycling.
12
⊘ This is a preview!⊘
Do you want full access?
Subscribe today to unlock all pages.

Trusted by 1+ million students worldwide
1 out of 26
Related Documents

Your All-in-One AI-Powered Toolkit for Academic Success.
+13062052269
info@desklib.com
Available 24*7 on WhatsApp / Email
Unlock your academic potential
Copyright © 2020–2025 A2Z Services. All Rights Reserved. Developed and managed by ZUCOL.