ACC91210 Finance for Managers - Case Study 1: Risk and Return Analysis
VerifiedAdded on 2022/12/15
|12
|2439
|459
Case Study
AI Summary
This case study analyzes the risk and return of Boral Limited and a reference company, along with a portfolio comprised of both. It begins by calculating historical monthly returns, average returns, and standard deviations for each entity and the market index. The Capital Asset Pricing Model (CAPM) is then applied to determine expected returns, considering risk-free rates, market risk premium, and beta. The study calculates portfolio beta and expected return, followed by a discussion on the relationship between risk and return, explaining the use of CAPM. Finally, the assignment addresses the impact of systematic and unsystematic risk on Boral Limited's returns, concluding with a comprehensive analysis of risk and return dynamics within the context of financial management.

Case Study 1
Paraphrase This Document
Need a fresh take? Get an instant paraphrase of this document with our AI Paraphraser
Contents
Part A: Calculation of historical monthly rate of return, historical average rate of return and
standard deviation............................................................................................................................3
A.1: Historical monthly rate of return of market index...............................................................3
Part A.2: Historical average return and standard deviation.........................................................3
Part B: Expected Return and portfolio beta.....................................................................................5
B.1: Expected return of Boral Limited and Reference Company................................................5
Part B.2: Portfolio Beta and Expected Return.............................................................................6
Part C: Discussion on risk and return for the case company, Reference Company and portfolio...7
Use of CAPM to explain the risk and return relationship............................................................7
Impact of systematic risk and unsystematic risk on the return of Boral Limited........................8
References........................................................................................................................................9
Part A: Calculation of historical monthly rate of return, historical average rate of return
and standard deviation
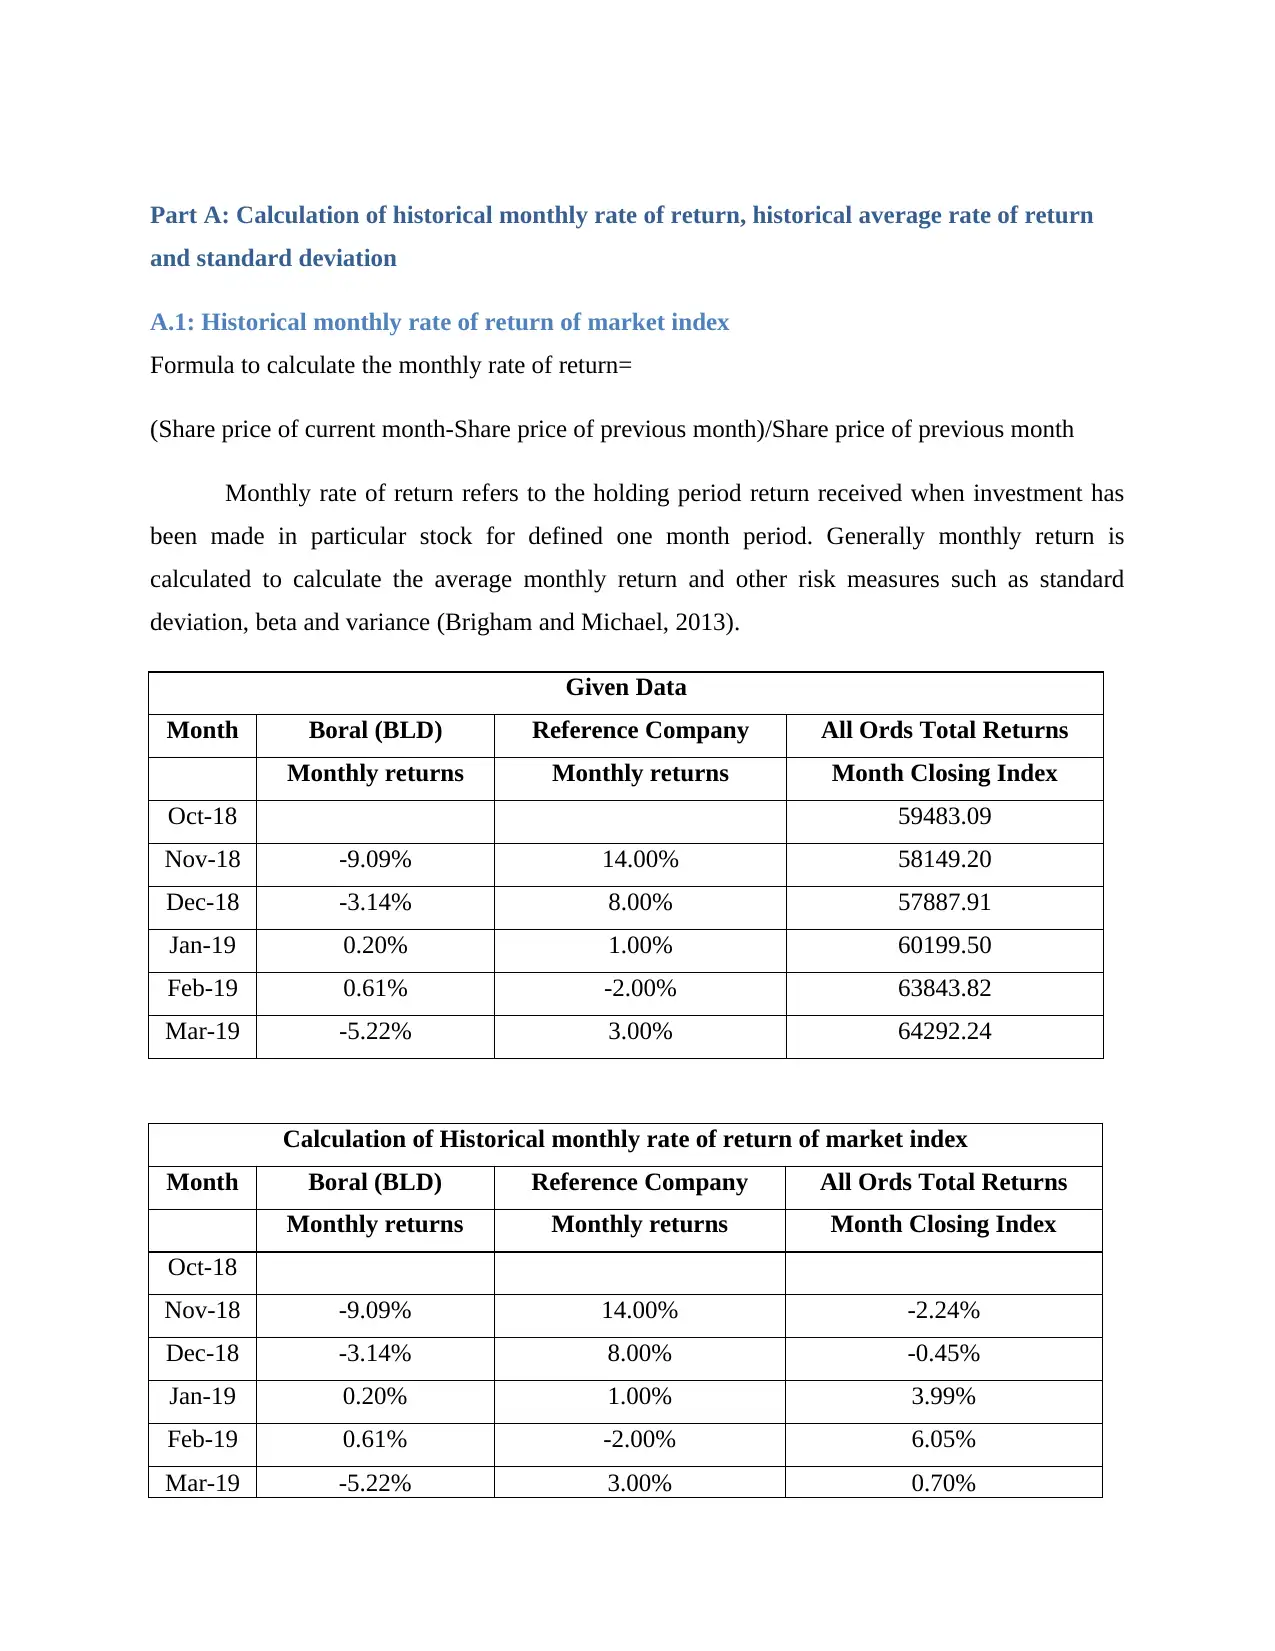
A.1: Historical monthly rate of return of market index
Formula to calculate the monthly rate of return=
(Share price of current month-Share price of previous month)/Share price of previous month
Monthly rate of return refers to the holding period return received when investment has
been made in particular stock for defined one month period. Generally monthly return is
calculated to calculate the average monthly return and other risk measures such as standard
deviation, beta and variance (Brigham and Michael, 2013).
Given Data
Month Boral (BLD) Reference Company All Ords Total Returns
Monthly returns Monthly returns Month Closing Index
Oct-18 59483.09
Nov-18 -9.09% 14.00% 58149.20
Dec-18 -3.14% 8.00% 57887.91
Jan-19 0.20% 1.00% 60199.50
Feb-19 0.61% -2.00% 63843.82
Mar-19 -5.22% 3.00% 64292.24
Calculation of Historical monthly rate of return of market index
Month Boral (BLD) Reference Company All Ords Total Returns
Monthly returns Monthly returns Month Closing Index
Oct-18
Nov-18 -9.09% 14.00% -2.24%
Dec-18 -3.14% 8.00% -0.45%
Jan-19 0.20% 1.00% 3.99%
Feb-19 0.61% -2.00% 6.05%
Mar-19 -5.22% 3.00% 0.70%
and standard deviation
A.1: Historical monthly rate of return of market index
Formula to calculate the monthly rate of return=
(Share price of current month-Share price of previous month)/Share price of previous month
Monthly rate of return refers to the holding period return received when investment has
been made in particular stock for defined one month period. Generally monthly return is
calculated to calculate the average monthly return and other risk measures such as standard
deviation, beta and variance (Brigham and Michael, 2013).
Given Data
Month Boral (BLD) Reference Company All Ords Total Returns
Monthly returns Monthly returns Month Closing Index
Oct-18 59483.09
Nov-18 -9.09% 14.00% 58149.20
Dec-18 -3.14% 8.00% 57887.91
Jan-19 0.20% 1.00% 60199.50
Feb-19 0.61% -2.00% 63843.82
Mar-19 -5.22% 3.00% 64292.24
Calculation of Historical monthly rate of return of market index
Month Boral (BLD) Reference Company All Ords Total Returns
Monthly returns Monthly returns Month Closing Index
Oct-18
Nov-18 -9.09% 14.00% -2.24%
Dec-18 -3.14% 8.00% -0.45%
Jan-19 0.20% 1.00% 3.99%
Feb-19 0.61% -2.00% 6.05%
Mar-19 -5.22% 3.00% 0.70%
⊘ This is a preview!⊘
Do you want full access?
Subscribe today to unlock all pages.
Trusted by 1+ million students worldwide
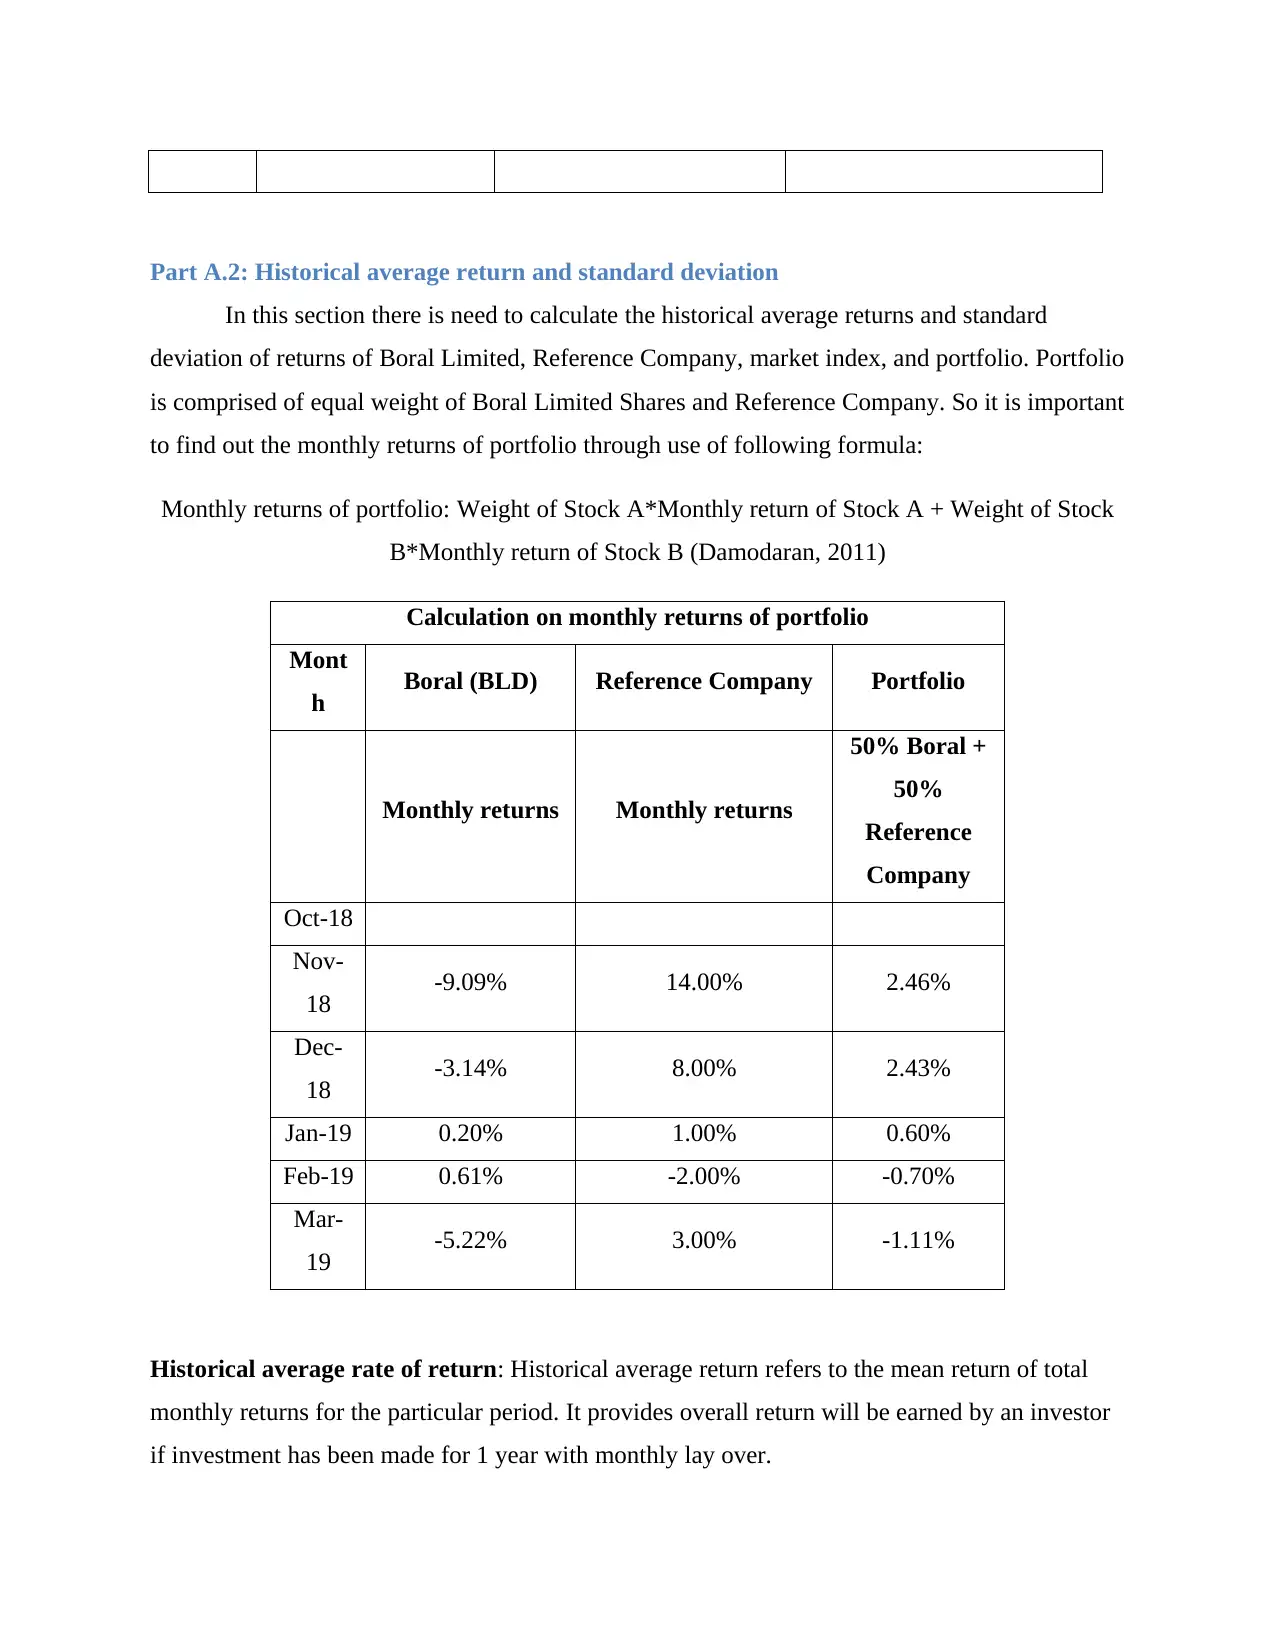
Part A.2: Historical average return and standard deviation
In this section there is need to calculate the historical average returns and standard
deviation of returns of Boral Limited, Reference Company, market index, and portfolio. Portfolio
is comprised of equal weight of Boral Limited Shares and Reference Company. So it is important
to find out the monthly returns of portfolio through use of following formula:
Monthly returns of portfolio: Weight of Stock A*Monthly return of Stock A + Weight of Stock
B*Monthly return of Stock B (Damodaran, 2011)
Calculation on monthly returns of portfolio
Mont
h Boral (BLD) Reference Company Portfolio
Monthly returns Monthly returns
50% Boral +
50%
Reference
Company
Oct-18
Nov-
18 -9.09% 14.00% 2.46%
Dec-
18 -3.14% 8.00% 2.43%
Jan-19 0.20% 1.00% 0.60%
Feb-19 0.61% -2.00% -0.70%
Mar-
19 -5.22% 3.00% -1.11%
Historical average rate of return: Historical average return refers to the mean return of total
monthly returns for the particular period. It provides overall return will be earned by an investor
if investment has been made for 1 year with monthly lay over.
Paraphrase This Document
Need a fresh take? Get an instant paraphrase of this document with our AI Paraphraser
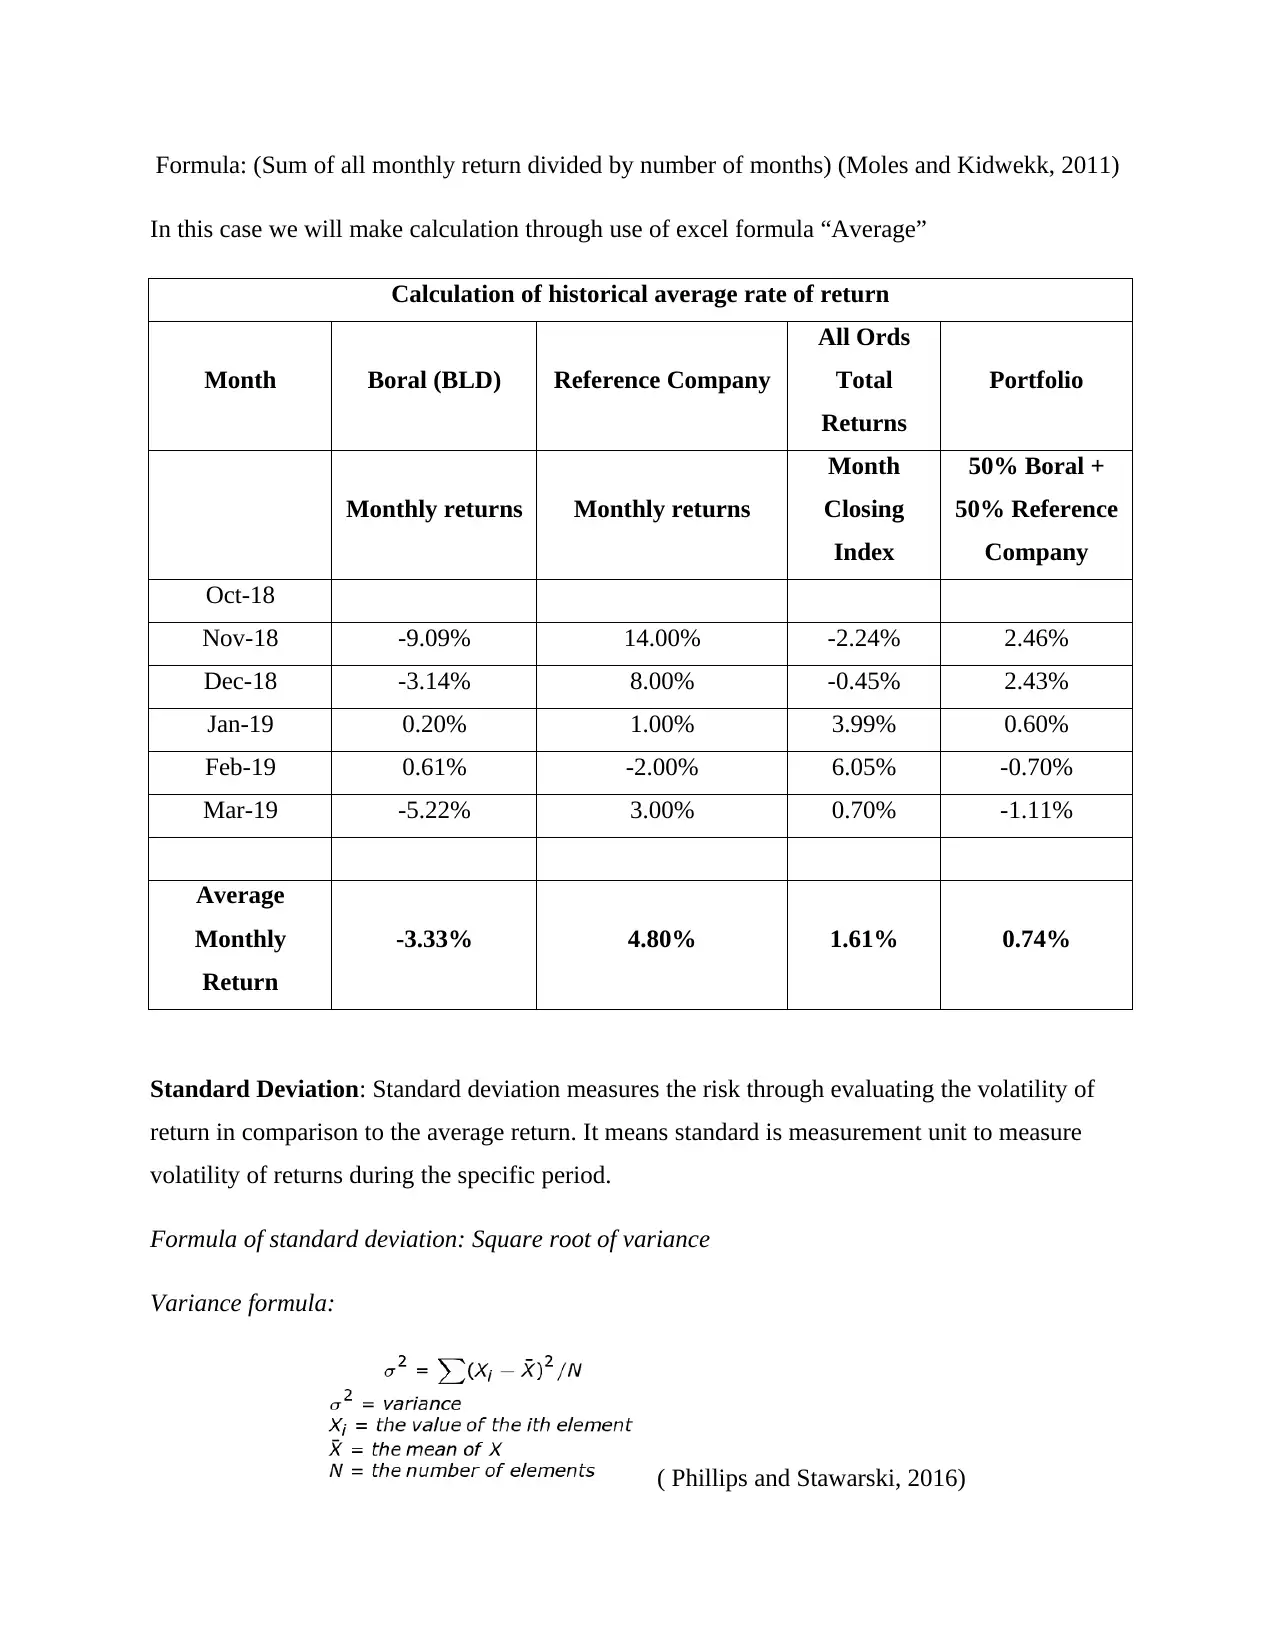
Formula: (Sum of all monthly return divided by number of months) (Moles and Kidwekk, 2011)
In this case we will make calculation through use of excel formula “Average”
Calculation of historical average rate of return
Month Boral (BLD) Reference Company
All Ords
Total
Returns
Portfolio
Monthly returns Monthly returns
Month
Closing
Index
50% Boral +
50% Reference
Company
Oct-18
Nov-18 -9.09% 14.00% -2.24% 2.46%
Dec-18 -3.14% 8.00% -0.45% 2.43%
Jan-19 0.20% 1.00% 3.99% 0.60%
Feb-19 0.61% -2.00% 6.05% -0.70%
Mar-19 -5.22% 3.00% 0.70% -1.11%
Average
Monthly
Return
-3.33% 4.80% 1.61% 0.74%
Standard Deviation: Standard deviation measures the risk through evaluating the volatility of
return in comparison to the average return. It means standard is measurement unit to measure
volatility of returns during the specific period.
Formula of standard deviation: Square root of variance
Variance formula:
( Phillips and Stawarski, 2016)
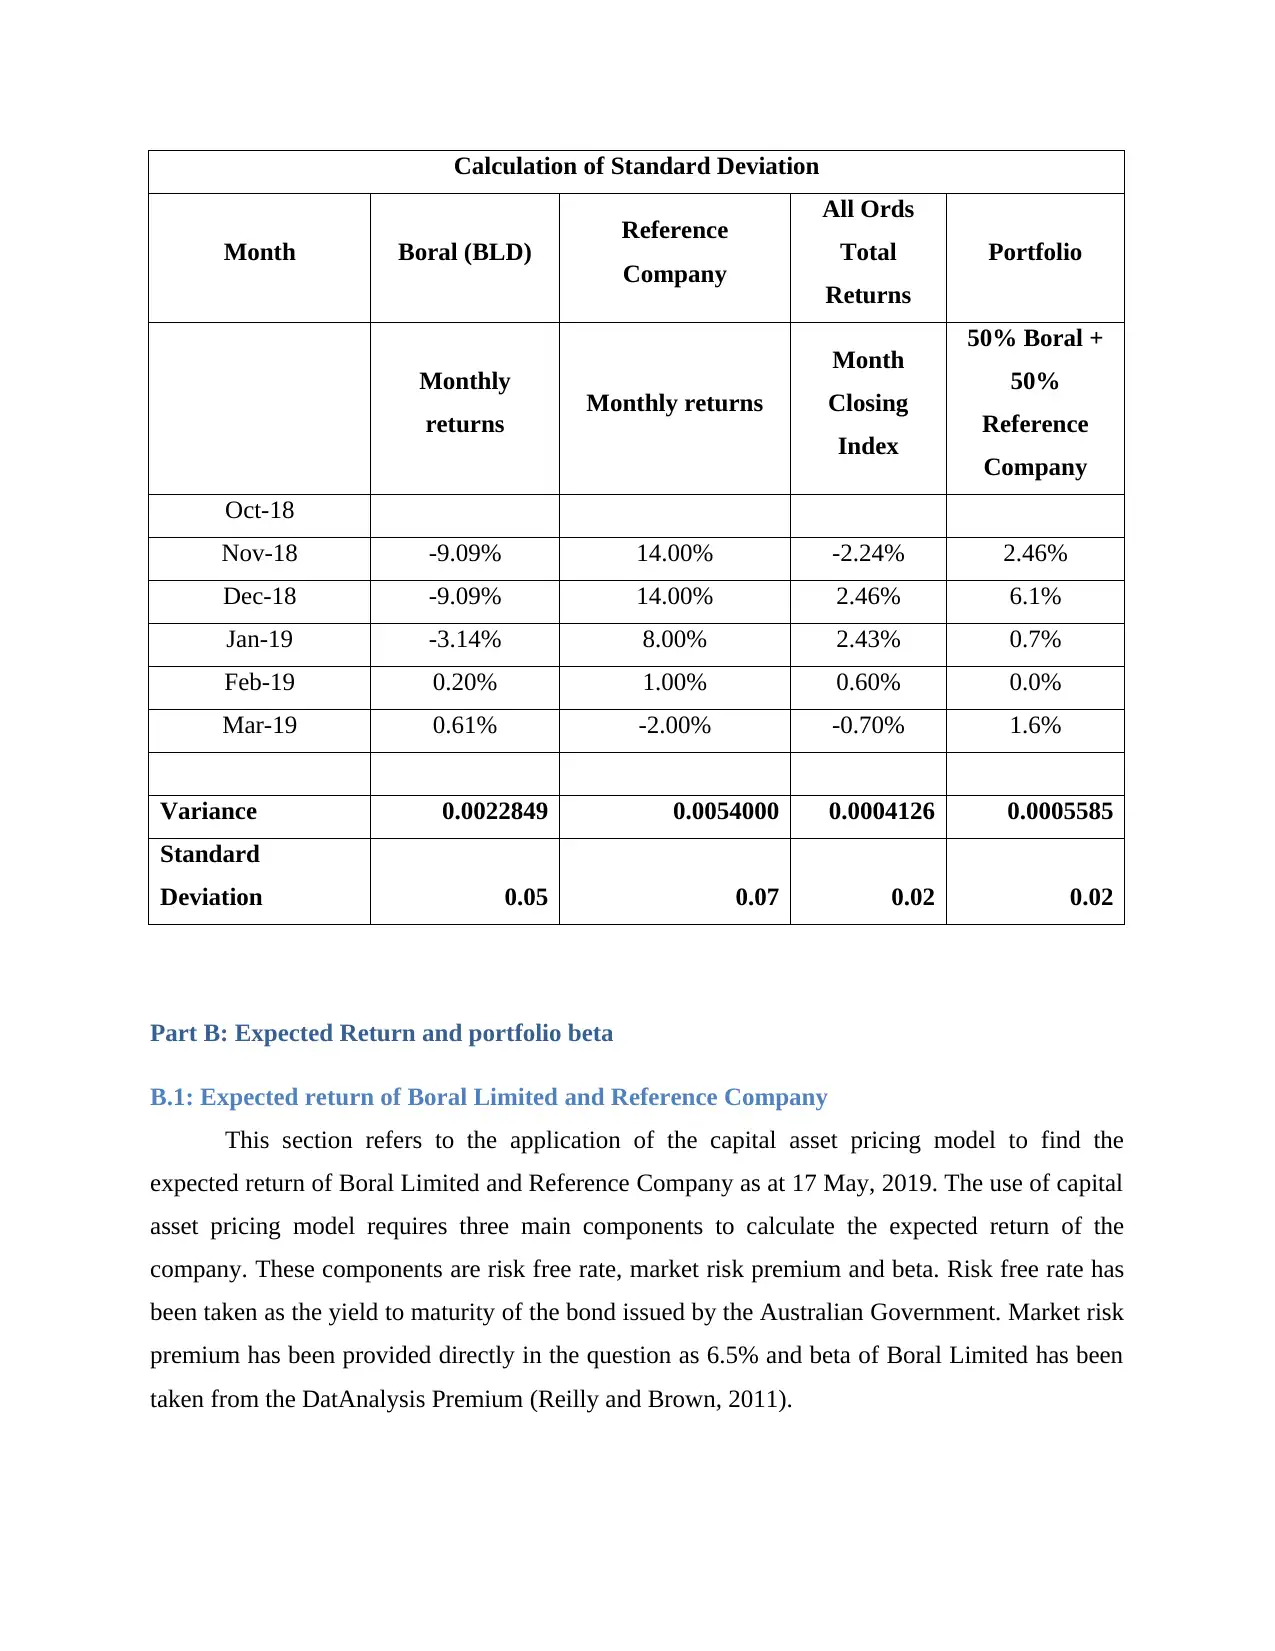
Calculation of Standard Deviation
Month Boral (BLD) Reference
Company
All Ords
Total
Returns
Portfolio
Monthly
returns Monthly returns
Month
Closing
Index
50% Boral +
50%
Reference
Company
Oct-18
Nov-18 -9.09% 14.00% -2.24% 2.46%
Dec-18 -9.09% 14.00% 2.46% 6.1%
Jan-19 -3.14% 8.00% 2.43% 0.7%
Feb-19 0.20% 1.00% 0.60% 0.0%
Mar-19 0.61% -2.00% -0.70% 1.6%
Variance 0.0022849 0.0054000 0.0004126 0.0005585
Standard
Deviation 0.05 0.07 0.02 0.02
Part B: Expected Return and portfolio beta
B.1: Expected return of Boral Limited and Reference Company
This section refers to the application of the capital asset pricing model to find the
expected return of Boral Limited and Reference Company as at 17 May, 2019. The use of capital
asset pricing model requires three main components to calculate the expected return of the
company. These components are risk free rate, market risk premium and beta. Risk free rate has
been taken as the yield to maturity of the bond issued by the Australian Government. Market risk
premium has been provided directly in the question as 6.5% and beta of Boral Limited has been
taken from the DatAnalysis Premium (Reilly and Brown, 2011).
⊘ This is a preview!⊘
Do you want full access?
Subscribe today to unlock all pages.
Trusted by 1+ million students worldwide
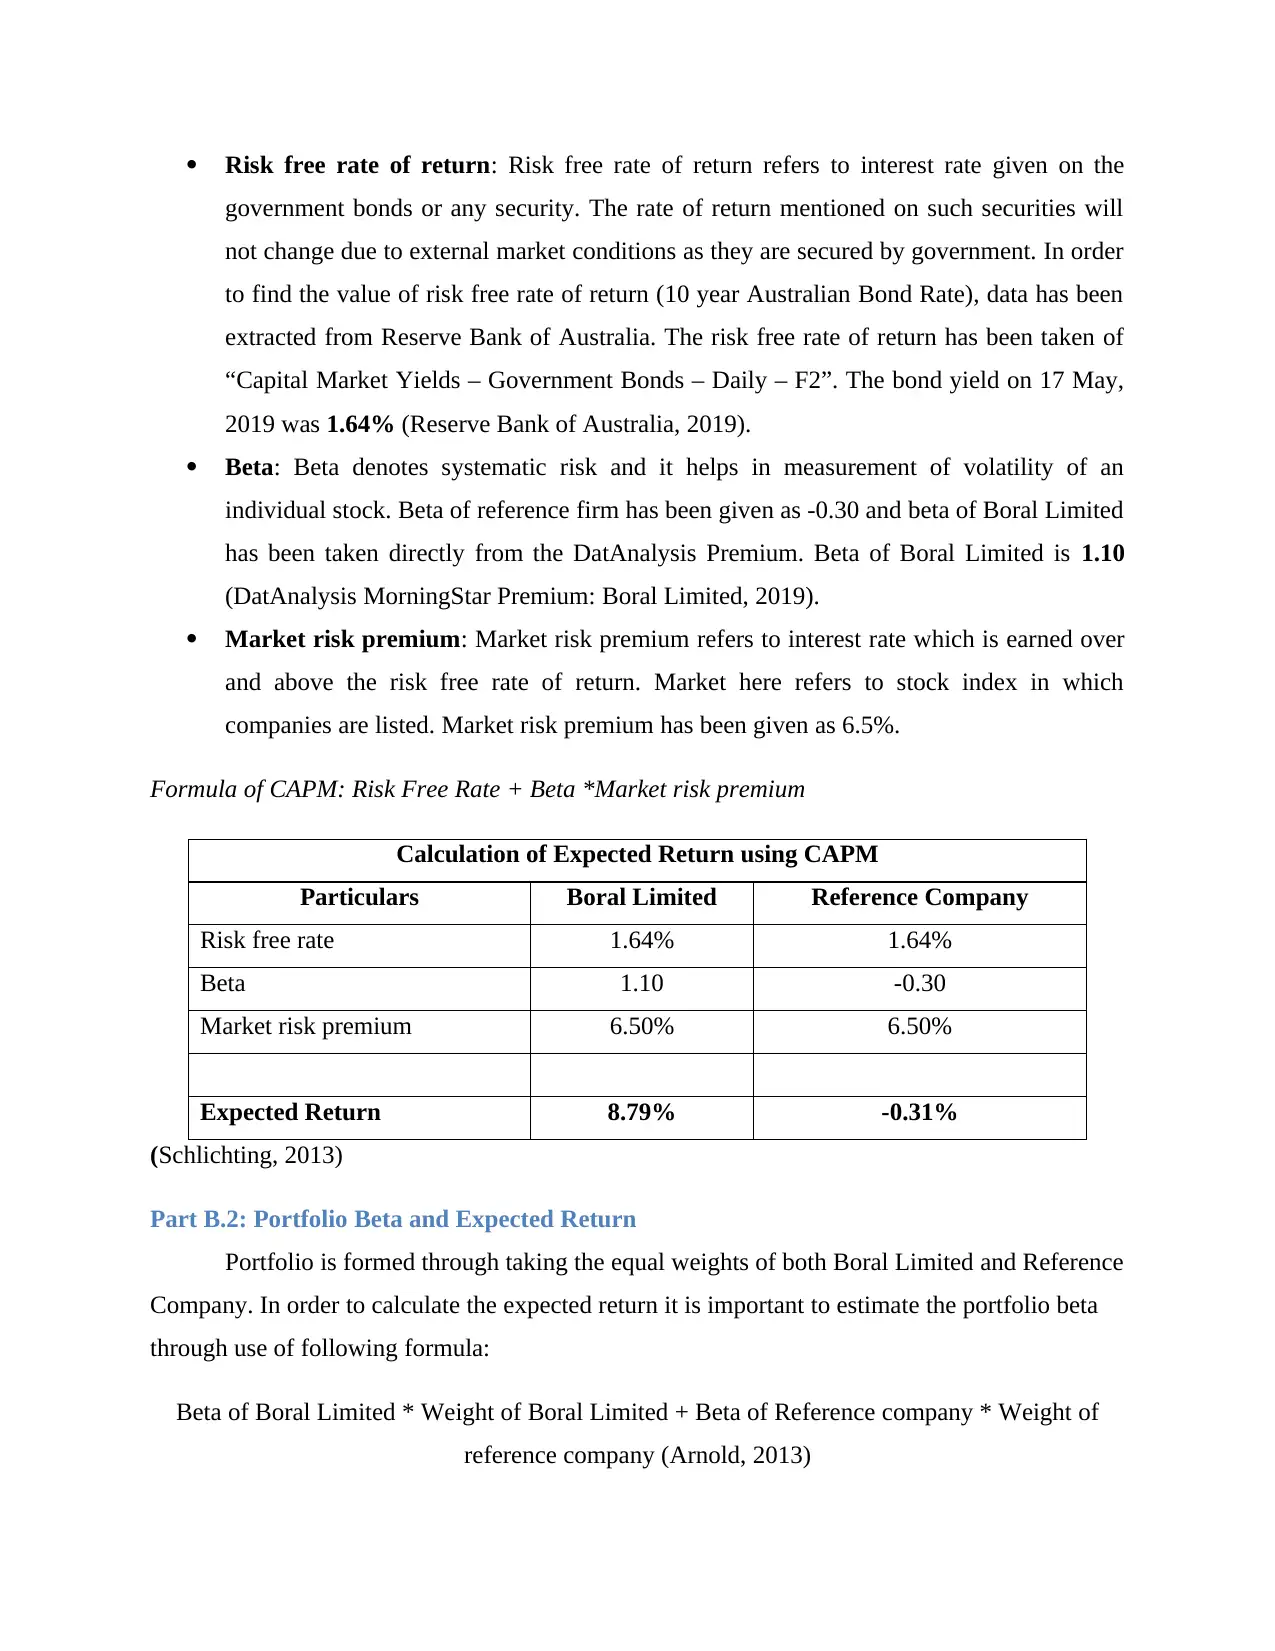
Risk free rate of return: Risk free rate of return refers to interest rate given on the
government bonds or any security. The rate of return mentioned on such securities will
not change due to external market conditions as they are secured by government. In order
to find the value of risk free rate of return (10 year Australian Bond Rate), data has been
extracted from Reserve Bank of Australia. The risk free rate of return has been taken of
“Capital Market Yields – Government Bonds – Daily – F2”. The bond yield on 17 May,
2019 was 1.64% (Reserve Bank of Australia, 2019).
Beta: Beta denotes systematic risk and it helps in measurement of volatility of an
individual stock. Beta of reference firm has been given as -0.30 and beta of Boral Limited
has been taken directly from the DatAnalysis Premium. Beta of Boral Limited is 1.10
(DatAnalysis MorningStar Premium: Boral Limited, 2019).
Market risk premium: Market risk premium refers to interest rate which is earned over
and above the risk free rate of return. Market here refers to stock index in which
companies are listed. Market risk premium has been given as 6.5%.
Formula of CAPM: Risk Free Rate + Beta *Market risk premium
Calculation of Expected Return using CAPM
Particulars Boral Limited Reference Company
Risk free rate 1.64% 1.64%
Beta 1.10 -0.30
Market risk premium 6.50% 6.50%
Expected Return 8.79% -0.31%
(Schlichting, 2013)
Part B.2: Portfolio Beta and Expected Return
Portfolio is formed through taking the equal weights of both Boral Limited and Reference
Company. In order to calculate the expected return it is important to estimate the portfolio beta
through use of following formula:
Beta of Boral Limited * Weight of Boral Limited + Beta of Reference company * Weight of
reference company (Arnold, 2013)
Paraphrase This Document
Need a fresh take? Get an instant paraphrase of this document with our AI Paraphraser
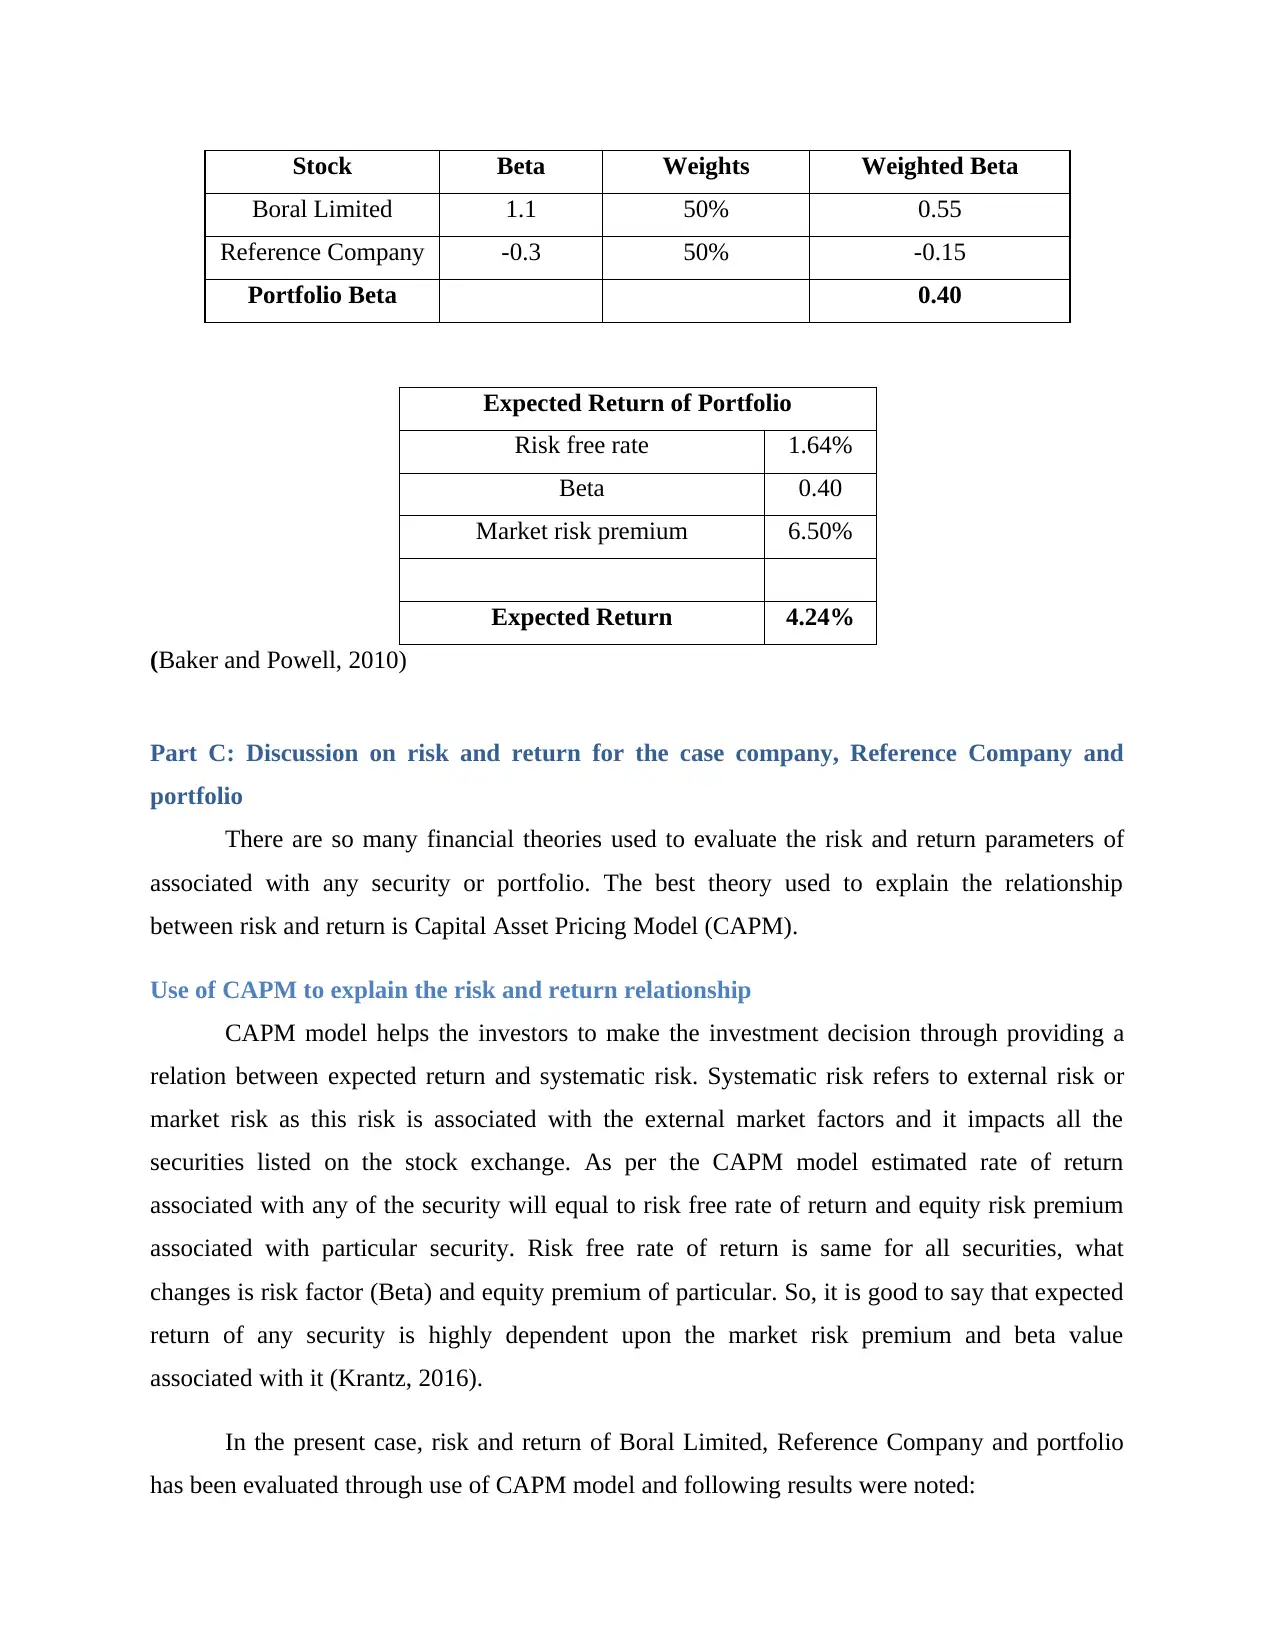
Stock Beta Weights Weighted Beta
Boral Limited 1.1 50% 0.55
Reference Company -0.3 50% -0.15
Portfolio Beta 0.40
Expected Return of Portfolio
Risk free rate 1.64%
Beta 0.40
Market risk premium 6.50%
Expected Return 4.24%
(Baker and Powell, 2010)
Part C: Discussion on risk and return for the case company, Reference Company and
portfolio
There are so many financial theories used to evaluate the risk and return parameters of
associated with any security or portfolio. The best theory used to explain the relationship
between risk and return is Capital Asset Pricing Model (CAPM).
Use of CAPM to explain the risk and return relationship
CAPM model helps the investors to make the investment decision through providing a
relation between expected return and systematic risk. Systematic risk refers to external risk or
market risk as this risk is associated with the external market factors and it impacts all the
securities listed on the stock exchange. As per the CAPM model estimated rate of return
associated with any of the security will equal to risk free rate of return and equity risk premium
associated with particular security. Risk free rate of return is same for all securities, what
changes is risk factor (Beta) and equity premium of particular. So, it is good to say that expected
return of any security is highly dependent upon the market risk premium and beta value
associated with it (Krantz, 2016).
In the present case, risk and return of Boral Limited, Reference Company and portfolio
has been evaluated through use of CAPM model and following results were noted:
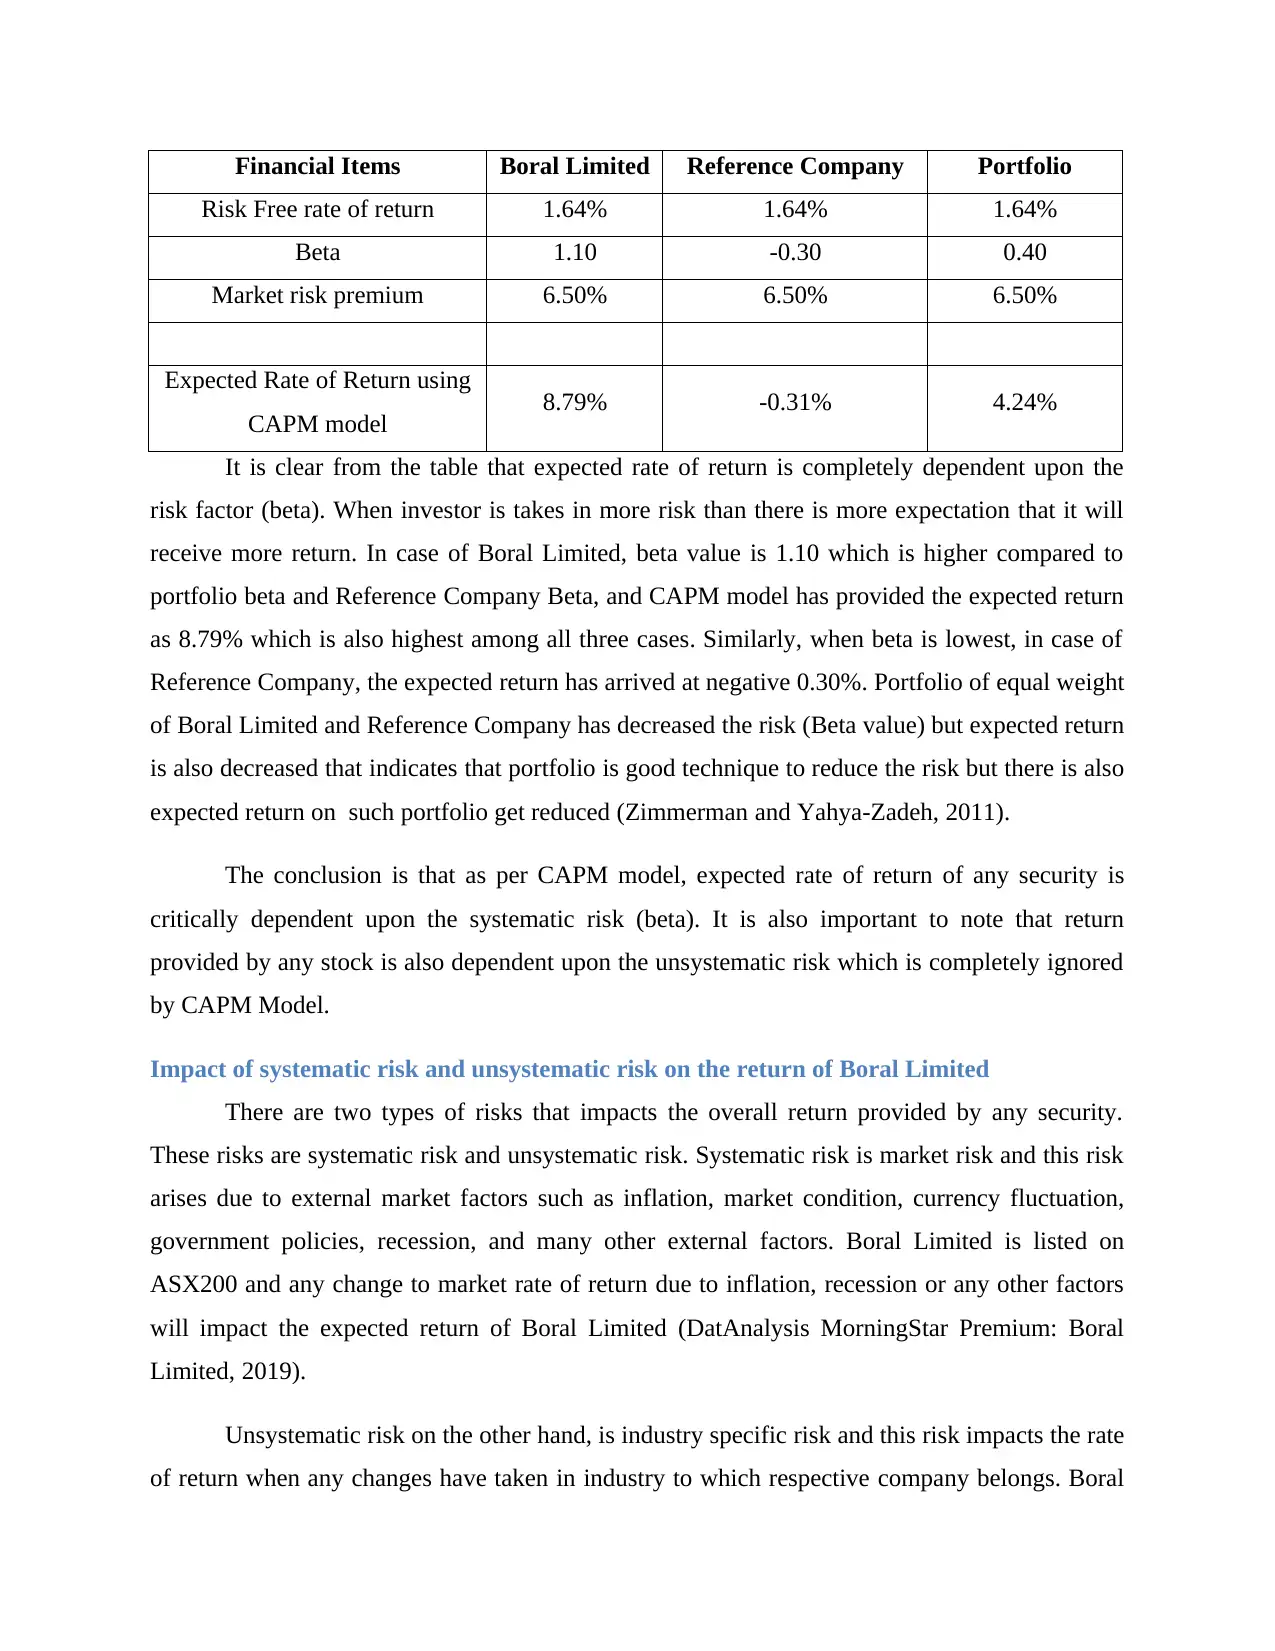
Financial Items Boral Limited Reference Company Portfolio
Risk Free rate of return 1.64% 1.64% 1.64%
Beta 1.10 -0.30 0.40
Market risk premium 6.50% 6.50% 6.50%
Expected Rate of Return using
CAPM model 8.79% -0.31% 4.24%
It is clear from the table that expected rate of return is completely dependent upon the
risk factor (beta). When investor is takes in more risk than there is more expectation that it will
receive more return. In case of Boral Limited, beta value is 1.10 which is higher compared to
portfolio beta and Reference Company Beta, and CAPM model has provided the expected return
as 8.79% which is also highest among all three cases. Similarly, when beta is lowest, in case of
Reference Company, the expected return has arrived at negative 0.30%. Portfolio of equal weight
of Boral Limited and Reference Company has decreased the risk (Beta value) but expected return
is also decreased that indicates that portfolio is good technique to reduce the risk but there is also
expected return on such portfolio get reduced (Zimmerman and Yahya-Zadeh, 2011).
The conclusion is that as per CAPM model, expected rate of return of any security is
critically dependent upon the systematic risk (beta). It is also important to note that return
provided by any stock is also dependent upon the unsystematic risk which is completely ignored
by CAPM Model.
Impact of systematic risk and unsystematic risk on the return of Boral Limited
There are two types of risks that impacts the overall return provided by any security.
These risks are systematic risk and unsystematic risk. Systematic risk is market risk and this risk
arises due to external market factors such as inflation, market condition, currency fluctuation,
government policies, recession, and many other external factors. Boral Limited is listed on
ASX200 and any change to market rate of return due to inflation, recession or any other factors
will impact the expected return of Boral Limited (DatAnalysis MorningStar Premium: Boral
Limited, 2019).
Unsystematic risk on the other hand, is industry specific risk and this risk impacts the rate
of return when any changes have taken in industry to which respective company belongs. Boral
⊘ This is a preview!⊘
Do you want full access?
Subscribe today to unlock all pages.
Trusted by 1+ million students worldwide
Limited belongs to construction industry in Australia and as per IBIS World report on
Construction industry of Australia, weal infrastructure and building investment has lead to
decline in revenue over the last 5 years. However there is heavy demand of construction material
in all of Australia due to ongoing project but government pricing policies and environmental
factors has led Boral Limited to limit their profits. So, it can be said that construction industry of
Australia is governed and regulated with competitive pricing and strict government policies with
regard to environment and other factors (IBIS World, 2019).
Paraphrase This Document
Need a fresh take? Get an instant paraphrase of this document with our AI Paraphraser
References
Arnold, G., 2013. Corporate financial management. USA: Pearson Higher Ed.
Baker, K. and Powell, G. 2010. Understanding Financial Management: A Practical Guide.
USA: John Wiley & Sons.
Brigham, F., and Michael C. 2013. Financial management: Theory & practice. Canada: Cengage
Learning.
Damodaran, A, 2011. Applied corporate finance. USA: John Wiley & sons.
DatAnalysis MorningStar Premium: Boral Limited. 2019. Key Data. [Online]. Available at:
https://datanalysis-morningstar-com-au.ezproxy.uow.edu.au/af/company/pricesensmeasures?
ASXCode=BLD&xtm-licensee=datpremium [Accessed on: 22 May, 2019].
IBIS World. 2019. Commercial and Industrial Building Construction - Australia Market
Research Report. . [Online]. Available at: https://www.ibisworld.com.au/industry-trends/market-
research-reports/construction/building/commercial-industrial-building-construction.html
[Accessed on: 22 May, 2019].
Krantz, M. 2016. Fundamental Analysis for Dummies. USA: John Wiley & Sons.
Moles, P. and Kidwekk, D. 2011. Corporate finance. USA: John Wiley &sons.
Phillips, P.P. and Stawarski, C.A. 2016. Data Collection: Planning for and Collecting All Types
of Data. USA: John Wiley & Sons.
Reilly.F.K. and Brown.K.C. 2011. Investment analysis & portfolio management. UK: South
western Cengage learning.
Reserve Bank of Australia. 2019. Interest rates. [Online]. Available at:
https://www.rba.gov.au/statistics/tables/ [Accessed on: 22 May, 2019].
Schlichting, T. 2013. Fundamental Analysis, Behavioral Finance and Technical Analysis on the
Stock Market. Australia: GRIN Verlag.

Zimmerman, J.L. and Yahya-Zadeh, M., 2011. Accounting for decision making and
control. Issues in Accounting Education, 26(1), pp.258-259.
control. Issues in Accounting Education, 26(1), pp.258-259.
⊘ This is a preview!⊘
Do you want full access?
Subscribe today to unlock all pages.
Trusted by 1+ million students worldwide
1 out of 12
Related Documents


Your All-in-One AI-Powered Toolkit for Academic Success.
+13062052269
info@desklib.com
Available 24*7 on WhatsApp / Email
![[object Object]](/_next/static/media/star-bottom.7253800d.svg)
Unlock your academic potential
Copyright © 2020–2026 A2Z Services. All Rights Reserved. Developed and managed by ZUCOL.