Comprehensive Account and Finance Report: Financial Analysis
VerifiedAdded on 2023/01/17
|20
|3923
|47
Report
AI Summary
This report provides a detailed analysis of account and finance principles, encompassing key elements of financial statements such as assets, liabilities, equity, revenue, and expenses. It explores the functions of an auditor's report, including the different types of opinions (clean, qualified, adverse, and disclaimer) and their implications. The report also examines qualitative information within annual reports, focusing on the objectives of notes to financial statements and company overviews. Furthermore, it includes a consolidated statement of financial position and performs a thorough financial ratio analysis, calculating and interpreting ratios like current ratio, acid test ratio, accounts receivable turnover, inventory turnover, and accounts payable turnover to assess the financial health and performance of a company. The report concludes with common-size comparative statements of financial position, offering insights into financial trends.

ACCOUNT AND
FINANCE
Contents
FINANCE
Contents
Paraphrase This Document
Need a fresh take? Get an instant paraphrase of this document with our AI Paraphraser
INTRODUCTION...........................................................................................................................3
MAIN BODY...................................................................................................................................3
Task 1.....................................................................................................................................3
Task 2.....................................................................................................................................6
Task 3.....................................................................................................................................7
CONCLUSION..............................................................................................................................19
REFERENCES..............................................................................................................................20
INTRODUCTION
The term accounts and finance both are key aspects. Accounts can be defined as measure, storing
and interaction of monetary and anti-financial data on financial entities such as companies and
corporations (Anandarajan, Anandarajan and Srinivasan, 2012). Accounting is often alluded to as
"the business language". While the finance is value of monetary resources which are needed to
complete different operations. The report covers information about different elements of
financial statements, role of auditor’s report. In the further part of report various calculations are
done as accordance of given data.
MAIN BODY
Task 1.
(a) Element of financial statements.
Financial statements- Financial statements are documents compiled by the company's
management to show the financial results and role at a time. It has below mentioned
elements which are as follows:
Assets- Assets are the possessions or legal protections of a company for which
value of fund can be attached. In other terms, this is a value object that is expected
to produce benefits in the future. These assets can be classified into many types
such as tangible, intangible, current and noncurrent assets.
Liabilities- It can be defined as current responsibility of the company resulting
from previous events, the resolution of which is expected to occur in the outflow
from the corporation of assets reflecting economic benefits (Hillier, Westerfield,
Jaffe and Jordan, 2013). There are various types of liabilities such as current and
noncurrent liabilities.
Equity- Equity is the financial interest of a corporation in the type of a portfolio.
In financial terms, it is the contrast between the asset value and the expense of
debt of anything owned. This is primarily the remaining sum balanced by the
assets toward liabilities.
Investment by owners- This indicates the gain in capital arising from the sale of
assets in return for ownership stake (Czarniawska, 2012). This describes the
⊘ This is a preview!⊘
Do you want full access?
Subscribe today to unlock all pages.
Trusted by 1+ million students worldwide
commitment of any owner to the company. The issue of shareholdings by a
company for money is expenditure by the owners.
Distribution to owners- It reflects a reduction in capital arising from the sale to the
owners. It shall assess the drawdown of the owner from the ownership stake of
the firm. An example of payment to owners is the monetary dividends paid by a
corporation to its investors.
Revenue- Revenue is the money a company receives from its regular business
operations. It is the inflow of capital, which results in an improvement in the
equity of the shareholder. Trade of goods and services for exchange of cash is an
example of income.
Gains- Gain is an improvement in the assets of the owner of secondary
transactions that are sporadic and non-recurring in nature (Power, 2012).
Expenses- Expenditures are the gross outflows of income generated by the
business venture. The total expenditures are charged to the profit and loss ledger.
Losses- Loss is a reduction in owner's capital as a result of secondary transactions
that are frequent and non-recurring in nature.
Comprehensive income- Comprehensive income is a shift in the company's assets
from non-owner origin transactions. That covers all adjustments in the company's
capital, other than those arising from acquisitions by investors and transfers to
owners (Chan, Tong and Zhang, 2012).
(b) The functions of the auditor’s report in an annual report.
The auditor's report expresses an opinion on the accuracy and quality of the firm's
monetary results. Within the report, the auditor may express any concerns about the
financial position of the business or any additional details related to it. There are basically
four types of auditor’s report which are as:
The clean or unqualified opinion- This report shows the auditor's view that all the
documents released for the analysis show that the financial transactions and records of
the company are accurate and appropriate (Byrne, Flood and Willis, 2012).
Qualified opinion- This report is usually positive because it shows that the auditor
has found no problems with the monetary documentation.
Paraphrase This Document
Need a fresh take? Get an instant paraphrase of this document with our AI Paraphraser
Adverse opinion- The unfavourable judgment means the company has not
complied with the standards by the UK GAAP and that the auditor has found a
gap in the firm's statements.
Disclaimer of opinion- This implies that the auditor was not able to finish the
audit due to a specific reason.
It has below mentioned functions which are as follows:
If any of the issues needed to be included in the audit report have been addressed
in the adverse or eligible form, the auditor's report shall also state the explanations
for them (Jones, 2014).
The findings or remarks on business transactions or matters that have a negative
effect on the ability to function of the firm referred to in the report of the auditor
shall be perused by the auditor in the general assembly before the firm. It can be
inspected by any representative of the firm.
The auditor should have a comment on the following matters in his report on
behalf of the businesses covered by that order: fixed assets, stock, fraud reporting
etc.
(c) Qualitative information in annual reports and its objectives.
In the annual report, different types of qualitative information are included such as notes of
financial statements, about company and many more (Van Hoepen, 2013). Herein, below
objectives of these information is done below:
Objective of notes of financial statements- The main purpose of the notes to the financial
reports is to further explain the accounting processes used by firm and to reveal
information that happened during and instantly after the end of the financial reporting
period.
Objective of information about company- Annual reports include details on the firm's
mission and history and review the company's accomplishments over the past year
(Hellmann, 2013). Due to which users can access information about industry in which
company deals.
Task 2.
Consolidated statement of financial position of Simone Bhd. as at 31 December 2018.
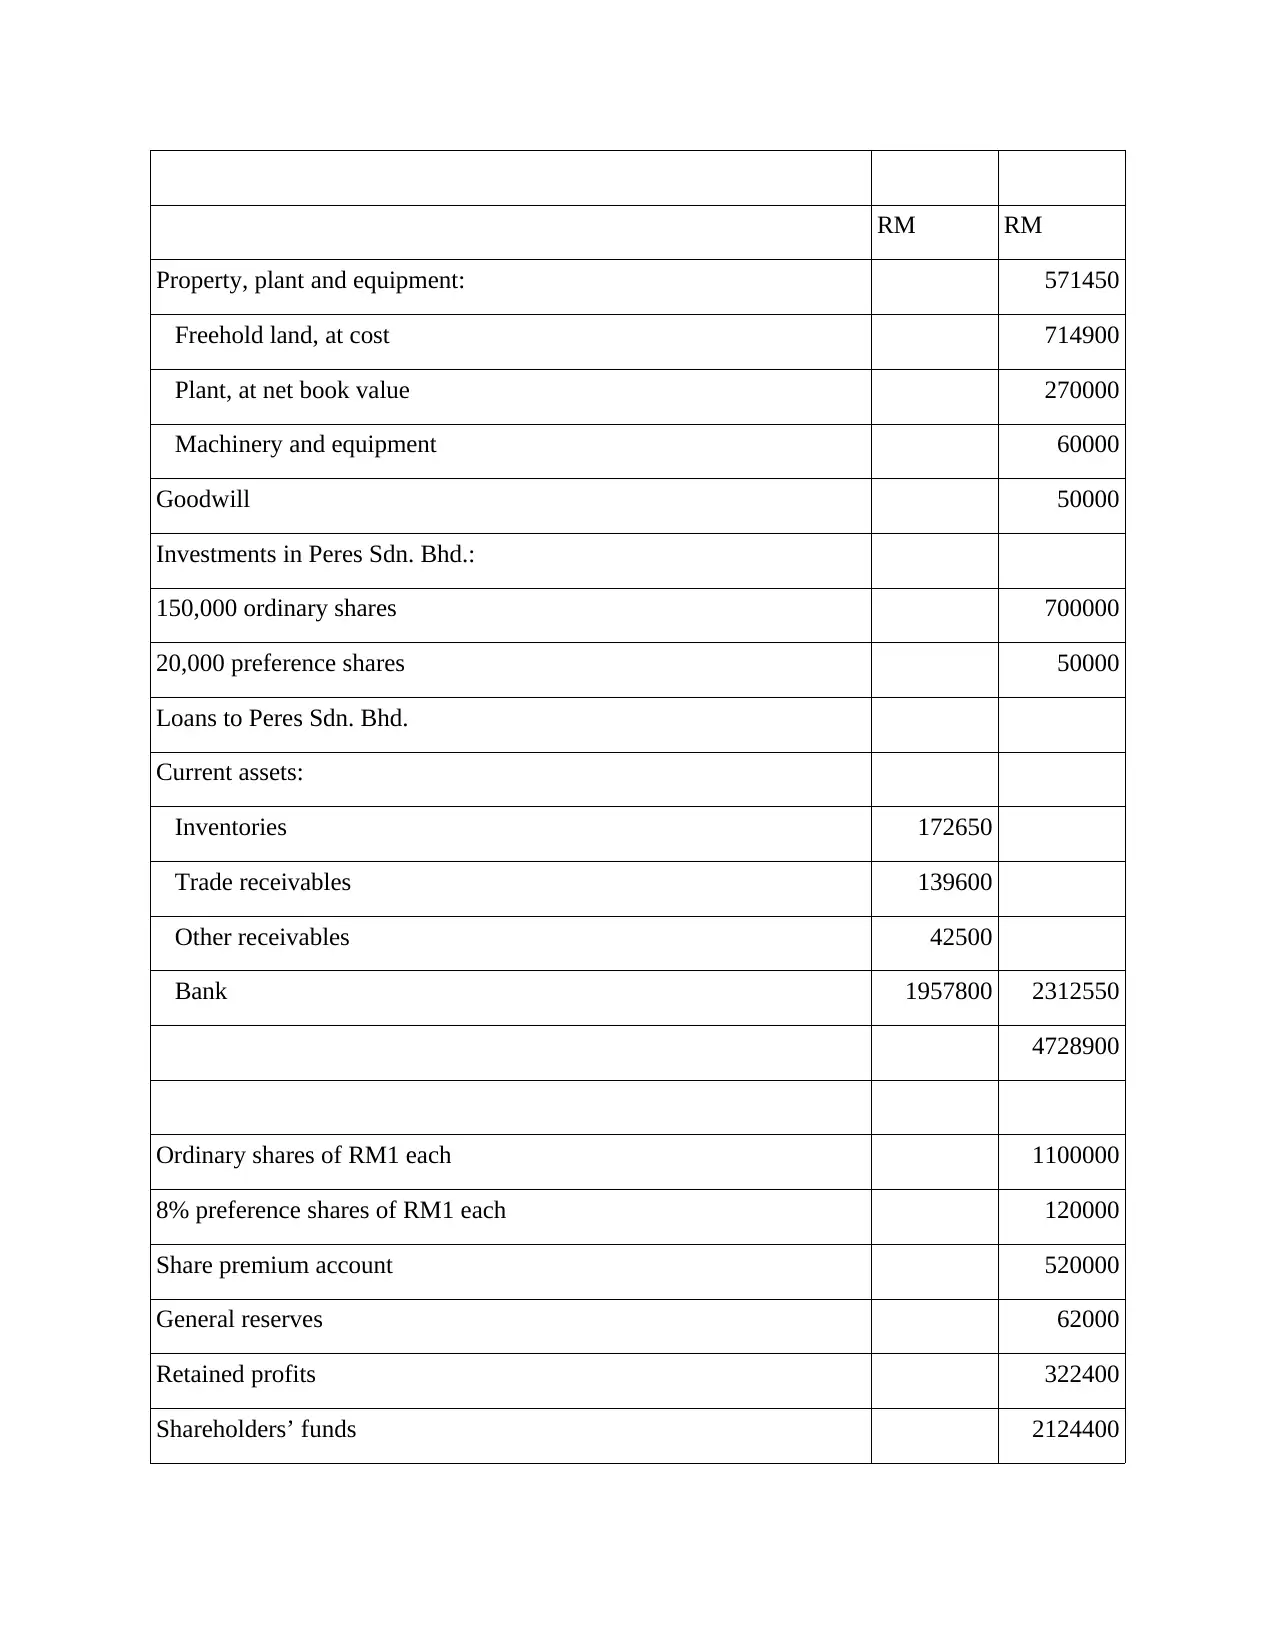
RM RM
Property, plant and equipment: 571450
Freehold land, at cost 714900
Plant, at net book value 270000
Machinery and equipment 60000
Goodwill 50000
Investments in Peres Sdn. Bhd.:
150,000 ordinary shares 700000
20,000 preference shares 50000
Loans to Peres Sdn. Bhd.
Current assets:
Inventories 172650
Trade receivables 139600
Other receivables 42500
Bank 1957800 2312550
4728900
Ordinary shares of RM1 each 1100000
8% preference shares of RM1 each 120000
Share premium account 520000
General reserves 62000
Retained profits 322400
Shareholders’ funds 2124400
⊘ This is a preview!⊘
Do you want full access?
Subscribe today to unlock all pages.
Trusted by 1+ million students worldwide
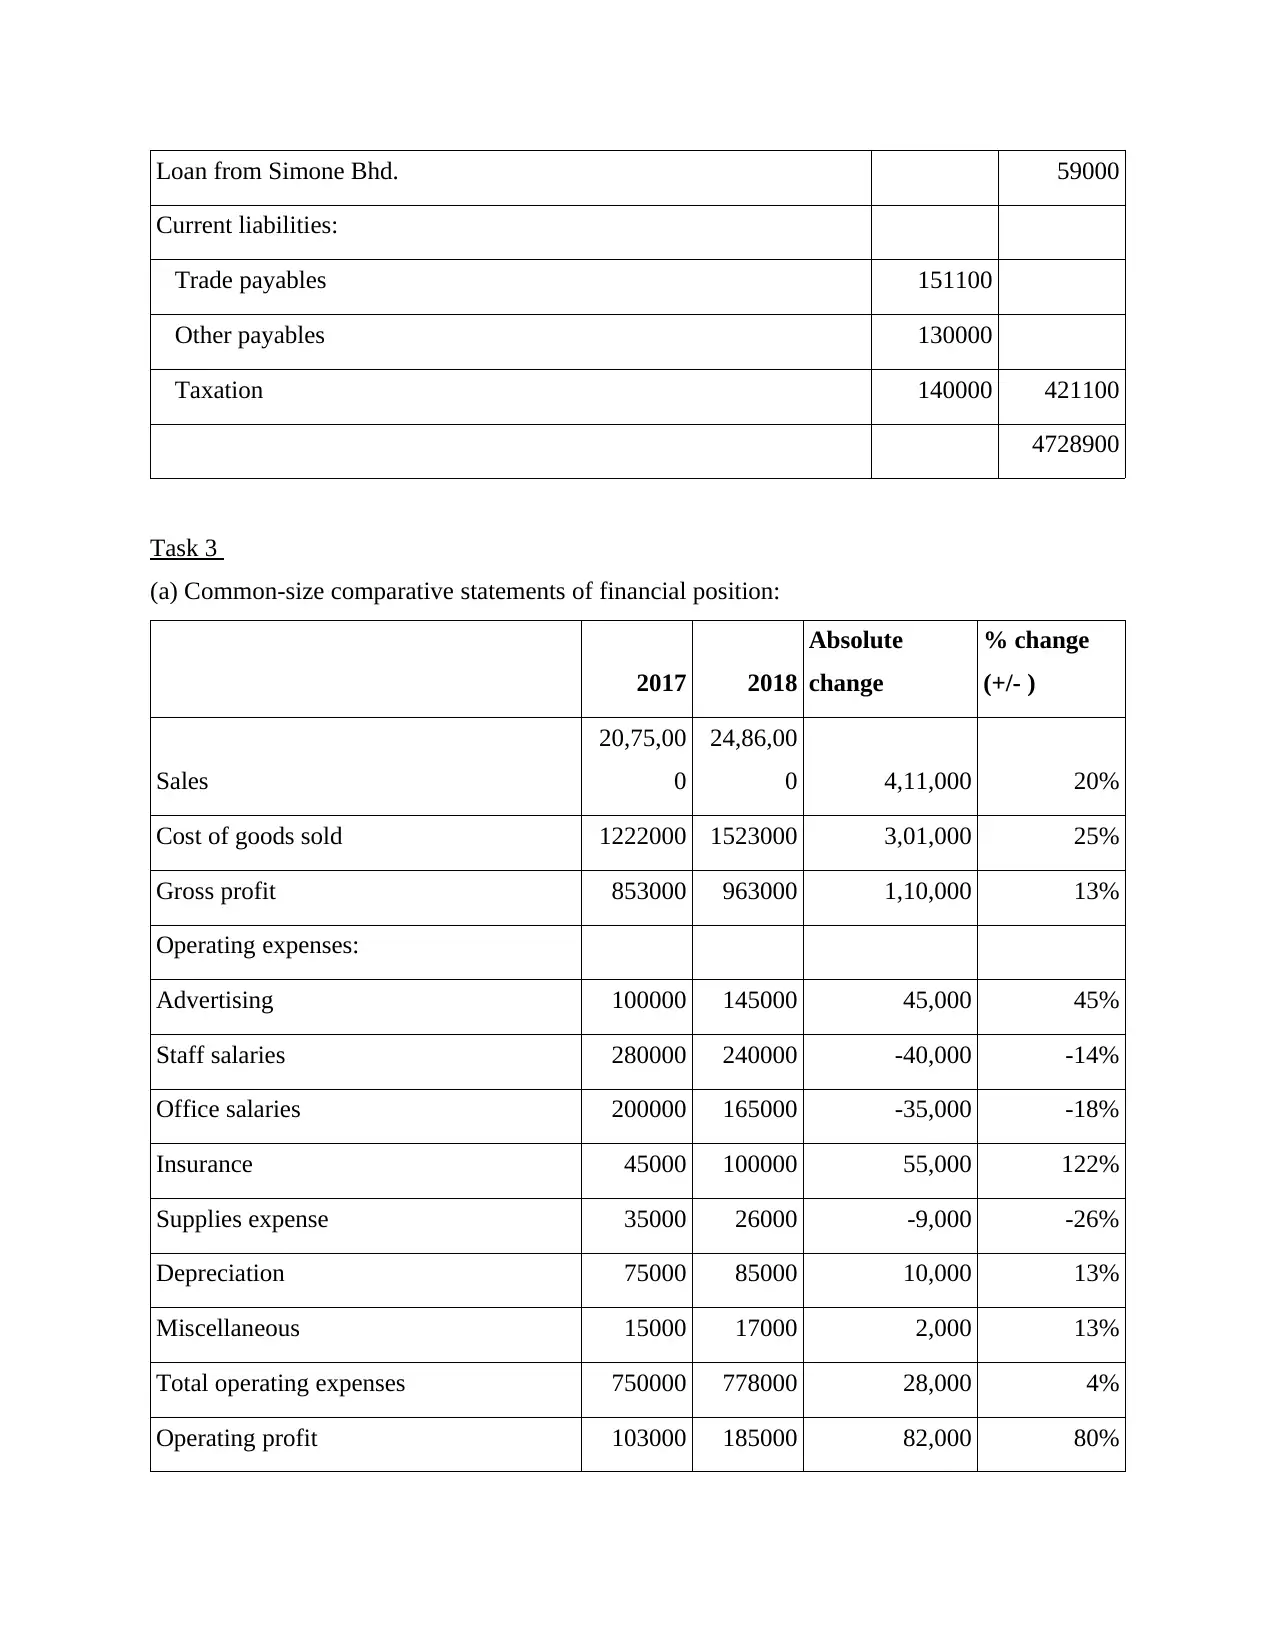
Loan from Simone Bhd. 59000
Current liabilities:
Trade payables 151100
Other payables 130000
Taxation 140000 421100
4728900
Task 3
(a) Common-size comparative statements of financial position:
2017 2018
Absolute
change
% change
(+/- )
Sales
20,75,00
0
24,86,00
0 4,11,000 20%
Cost of goods sold 1222000 1523000 3,01,000 25%
Gross profit 853000 963000 1,10,000 13%
Operating expenses:
Advertising 100000 145000 45,000 45%
Staff salaries 280000 240000 -40,000 -14%
Office salaries 200000 165000 -35,000 -18%
Insurance 45000 100000 55,000 122%
Supplies expense 35000 26000 -9,000 -26%
Depreciation 75000 85000 10,000 13%
Miscellaneous 15000 17000 2,000 13%
Total operating expenses 750000 778000 28,000 4%
Operating profit 103000 185000 82,000 80%
Paraphrase This Document
Need a fresh take? Get an instant paraphrase of this document with our AI Paraphraser
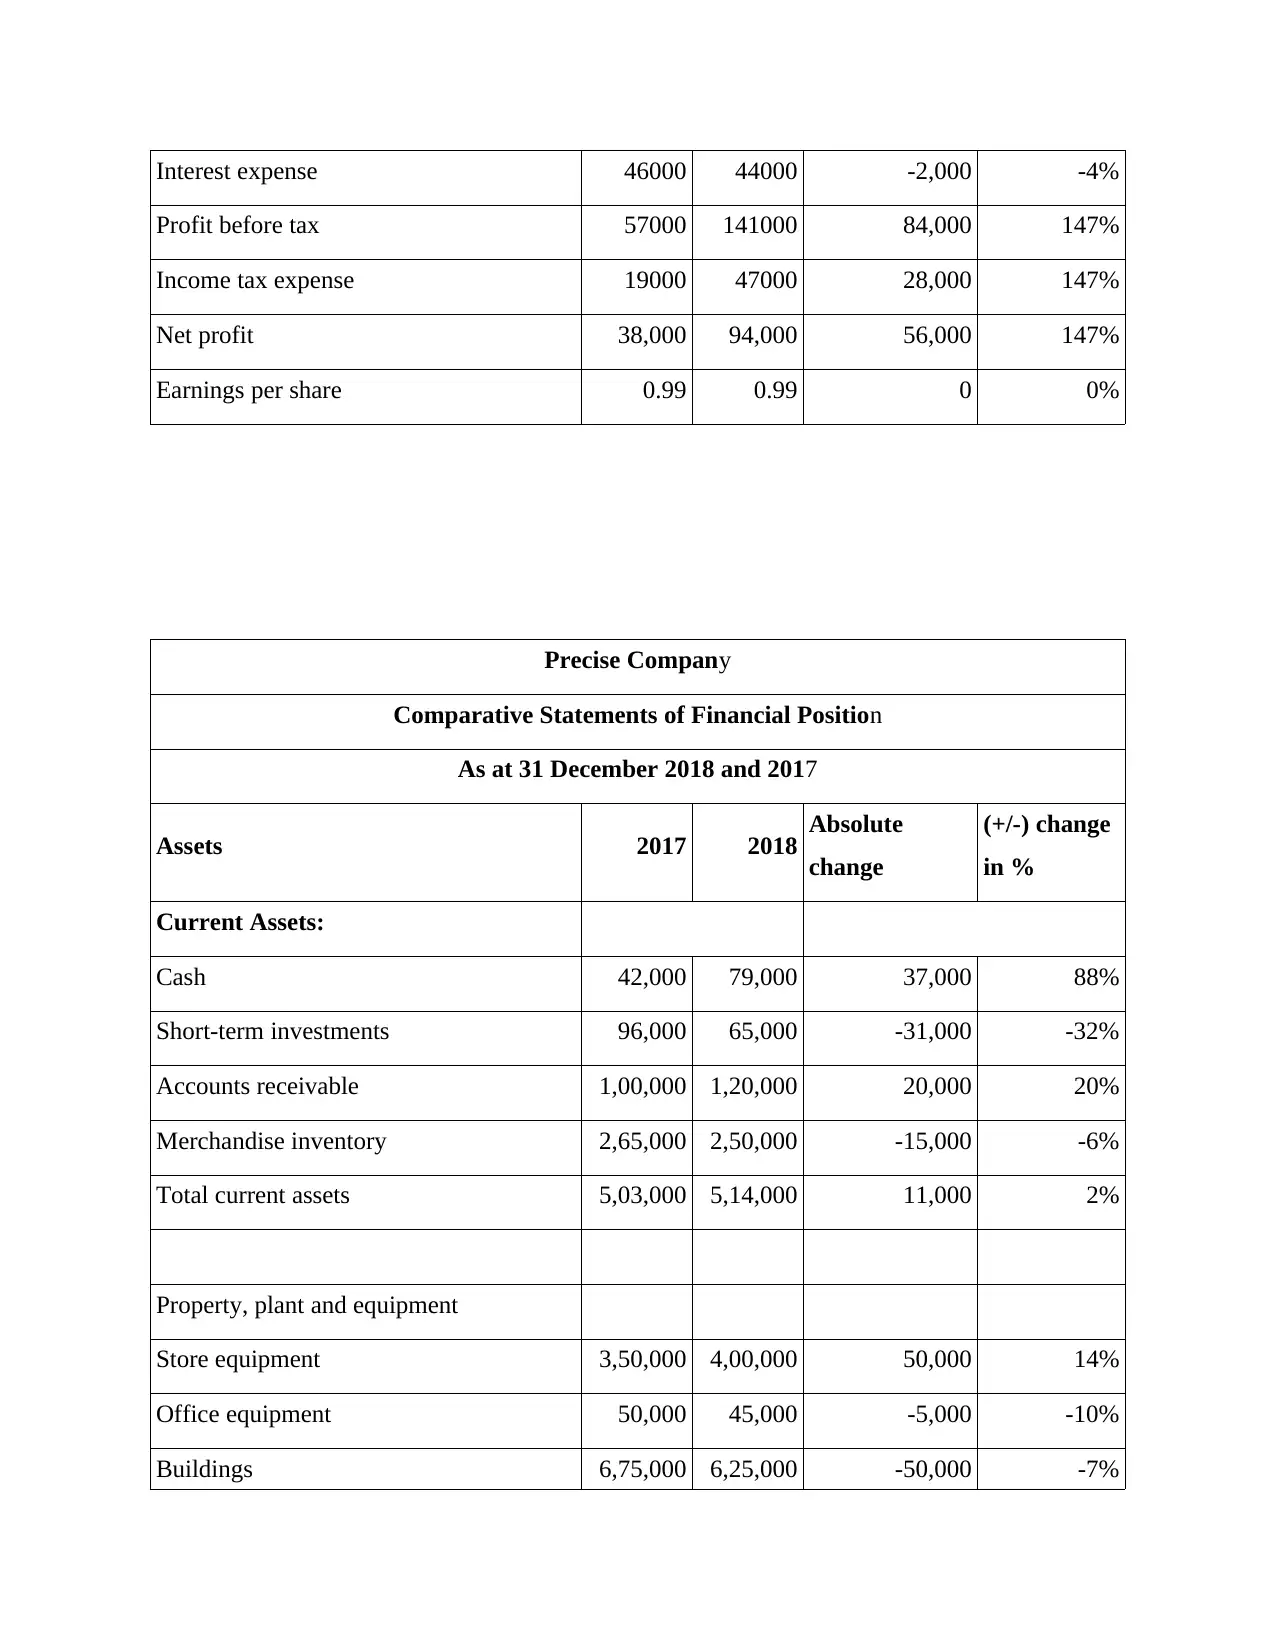
Interest expense 46000 44000 -2,000 -4%
Profit before tax 57000 141000 84,000 147%
Income tax expense 19000 47000 28,000 147%
Net profit 38,000 94,000 56,000 147%
Earnings per share 0.99 0.99 0 0%
Precise Company
Comparative Statements of Financial Position
As at 31 December 2018 and 2017
Assets 2017 2018 Absolute
change
(+/-) change
in %
Current Assets:
Cash 42,000 79,000 37,000 88%
Short-term investments 96,000 65,000 -31,000 -32%
Accounts receivable 1,00,000 1,20,000 20,000 20%
Merchandise inventory 2,65,000 2,50,000 -15,000 -6%
Total current assets 5,03,000 5,14,000 11,000 2%
Property, plant and equipment
Store equipment 3,50,000 4,00,000 50,000 14%
Office equipment 50,000 45,000 -5,000 -10%
Buildings 6,75,000 6,25,000 -50,000 -7%
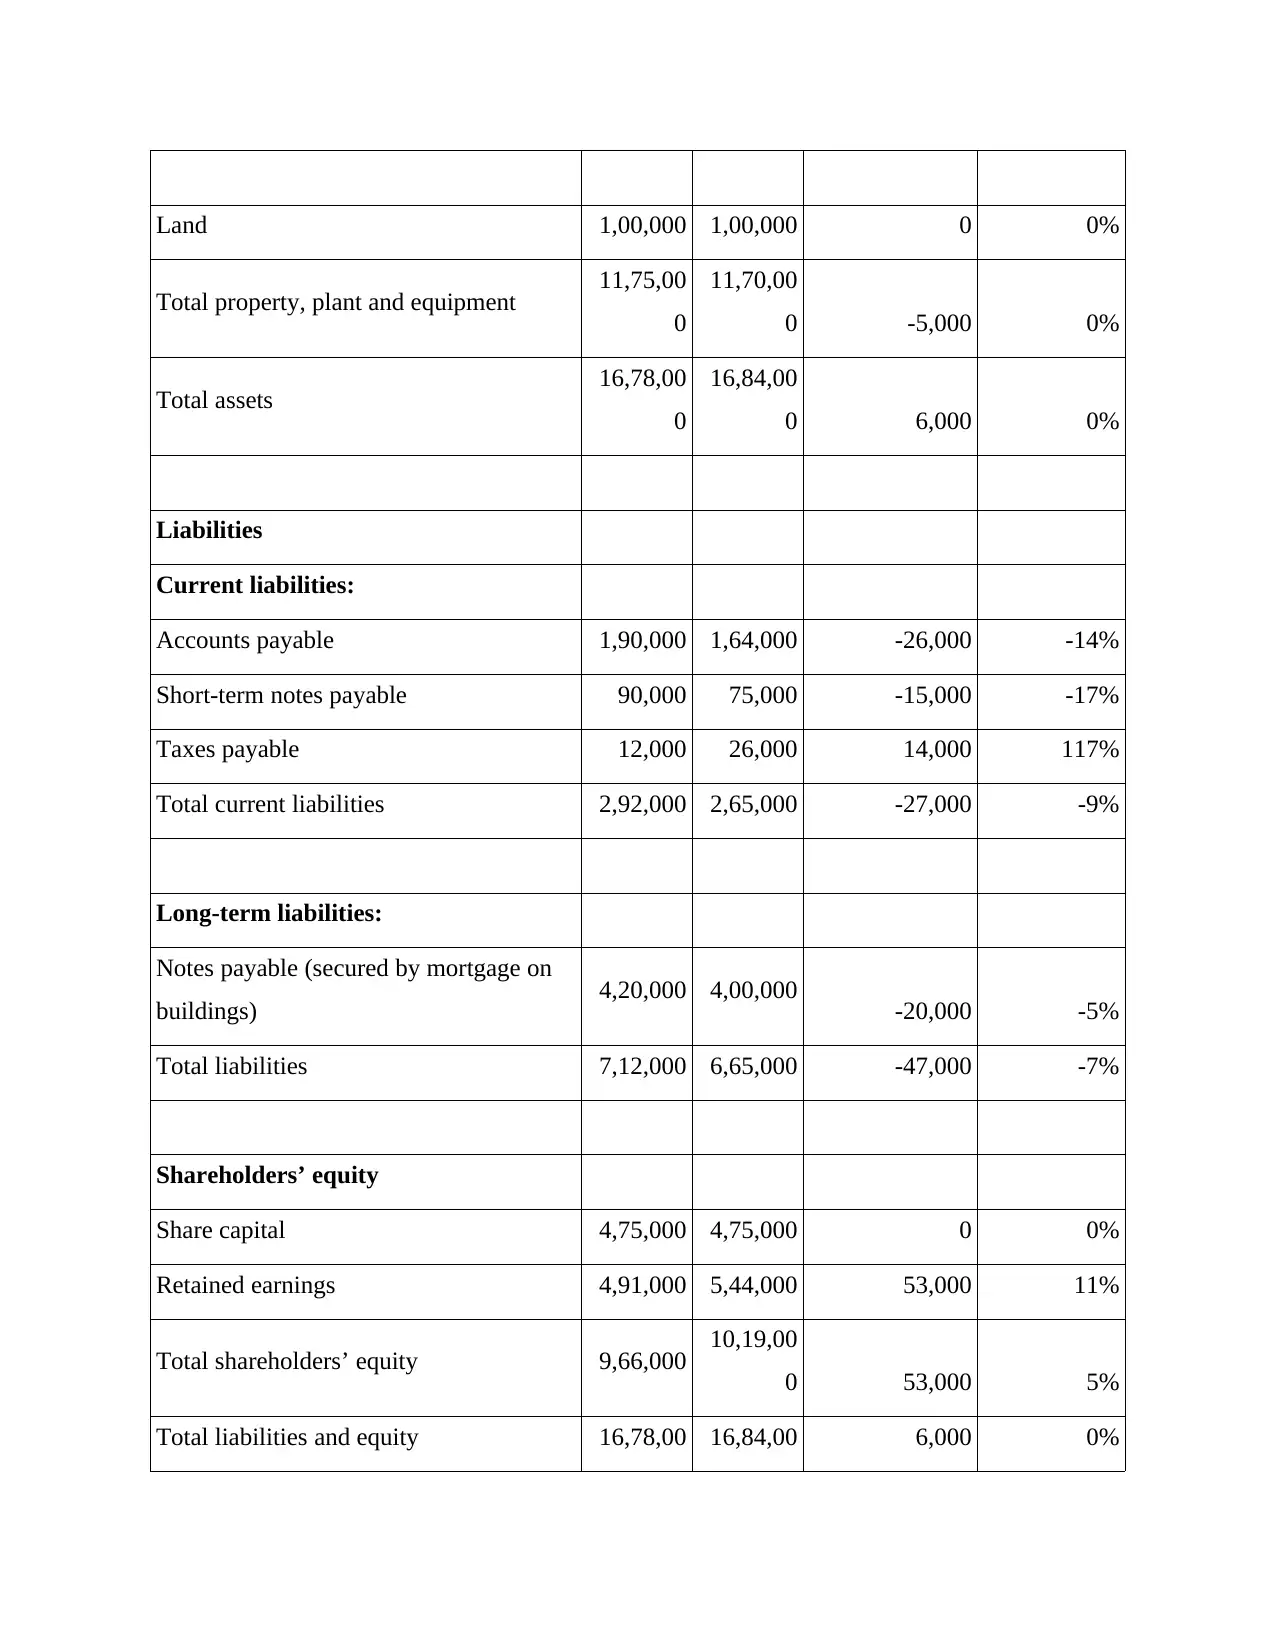
Land 1,00,000 1,00,000 0 0%
Total property, plant and equipment 11,75,00
0
11,70,00
0 -5,000 0%
Total assets 16,78,00
0
16,84,00
0 6,000 0%
Liabilities
Current liabilities:
Accounts payable 1,90,000 1,64,000 -26,000 -14%
Short-term notes payable 90,000 75,000 -15,000 -17%
Taxes payable 12,000 26,000 14,000 117%
Total current liabilities 2,92,000 2,65,000 -27,000 -9%
Long-term liabilities:
Notes payable (secured by mortgage on
buildings) 4,20,000 4,00,000 -20,000 -5%
Total liabilities 7,12,000 6,65,000 -47,000 -7%
Shareholders’ equity
Share capital 4,75,000 4,75,000 0 0%
Retained earnings 4,91,000 5,44,000 53,000 11%
Total shareholders’ equity 9,66,000 10,19,00
0 53,000 5%
Total liabilities and equity 16,78,00 16,84,00 6,000 0%
⊘ This is a preview!⊘
Do you want full access?
Subscribe today to unlock all pages.
Trusted by 1+ million students worldwide
0 0
(b) Calculations of ratios:
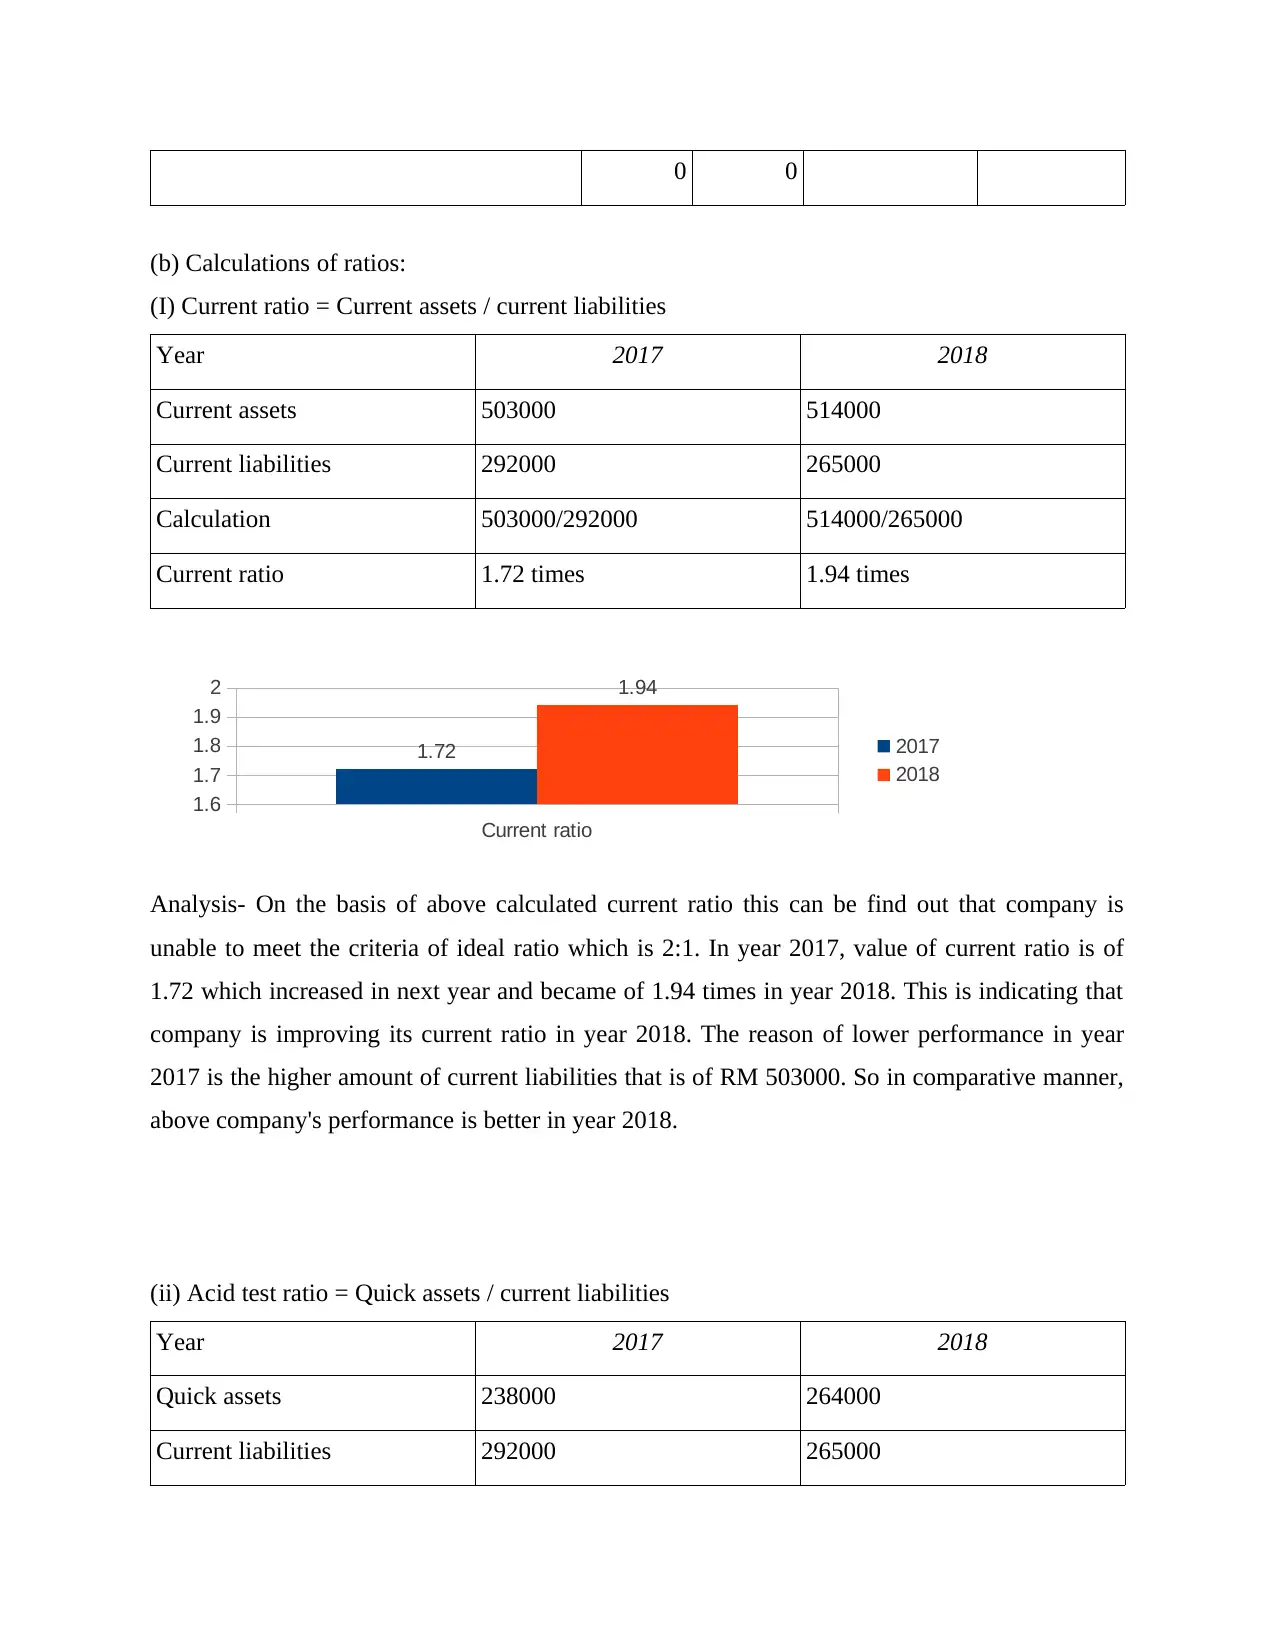
(I) Current ratio = Current assets / current liabilities
Year 2017 2018
Current assets 503000 514000
Current liabilities 292000 265000
Calculation 503000/292000 514000/265000
Current ratio 1.72 times 1.94 times
Current ratio
1.6
1.7
1.8
1.9
2
1.72
1.94
2017
2018
Analysis- On the basis of above calculated current ratio this can be find out that company is
unable to meet the criteria of ideal ratio which is 2:1. In year 2017, value of current ratio is of
1.72 which increased in next year and became of 1.94 times in year 2018. This is indicating that
company is improving its current ratio in year 2018. The reason of lower performance in year
2017 is the higher amount of current liabilities that is of RM 503000. So in comparative manner,
above company's performance is better in year 2018.
(ii) Acid test ratio = Quick assets / current liabilities
Year 2017 2018
Quick assets 238000 264000
Current liabilities 292000 265000
(b) Calculations of ratios:
(I) Current ratio = Current assets / current liabilities
Year 2017 2018
Current assets 503000 514000
Current liabilities 292000 265000
Calculation 503000/292000 514000/265000
Current ratio 1.72 times 1.94 times
Current ratio
1.6
1.7
1.8
1.9
2
1.72
1.94
2017
2018
Analysis- On the basis of above calculated current ratio this can be find out that company is
unable to meet the criteria of ideal ratio which is 2:1. In year 2017, value of current ratio is of
1.72 which increased in next year and became of 1.94 times in year 2018. This is indicating that
company is improving its current ratio in year 2018. The reason of lower performance in year
2017 is the higher amount of current liabilities that is of RM 503000. So in comparative manner,
above company's performance is better in year 2018.
(ii) Acid test ratio = Quick assets / current liabilities
Year 2017 2018
Quick assets 238000 264000
Current liabilities 292000 265000
Paraphrase This Document
Need a fresh take? Get an instant paraphrase of this document with our AI Paraphraser
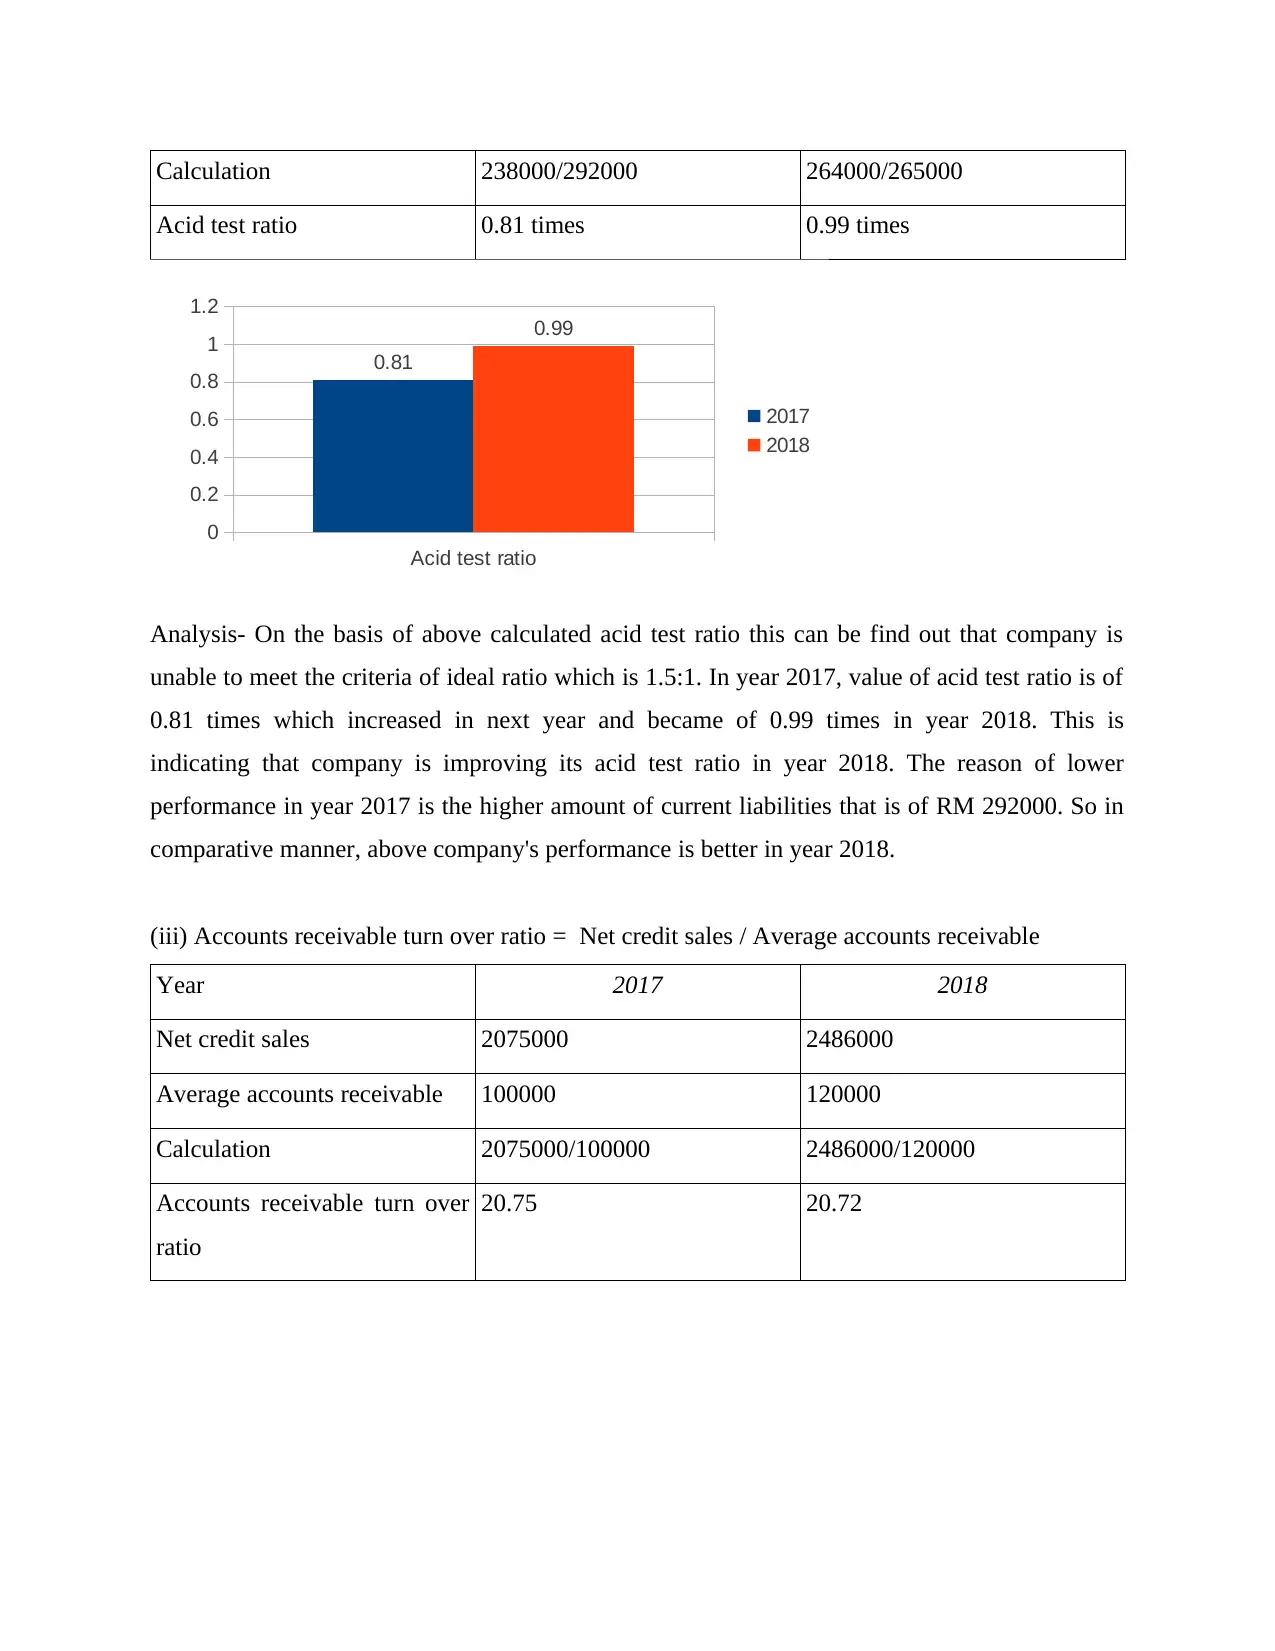
Calculation 238000/292000 264000/265000
Acid test ratio 0.81 times 0.99 times
Acid test ratio
0
0.2
0.4
0.6
0.8
1
1.2
0.81
0.99
2017
2018
Analysis- On the basis of above calculated acid test ratio this can be find out that company is
unable to meet the criteria of ideal ratio which is 1.5:1. In year 2017, value of acid test ratio is of
0.81 times which increased in next year and became of 0.99 times in year 2018. This is
indicating that company is improving its acid test ratio in year 2018. The reason of lower
performance in year 2017 is the higher amount of current liabilities that is of RM 292000. So in
comparative manner, above company's performance is better in year 2018.
(iii) Accounts receivable turn over ratio = Net credit sales / Average accounts receivable
Year 2017 2018
Net credit sales 2075000 2486000
Average accounts receivable 100000 120000
Calculation 2075000/100000 2486000/120000
Accounts receivable turn over
ratio
20.75 20.72
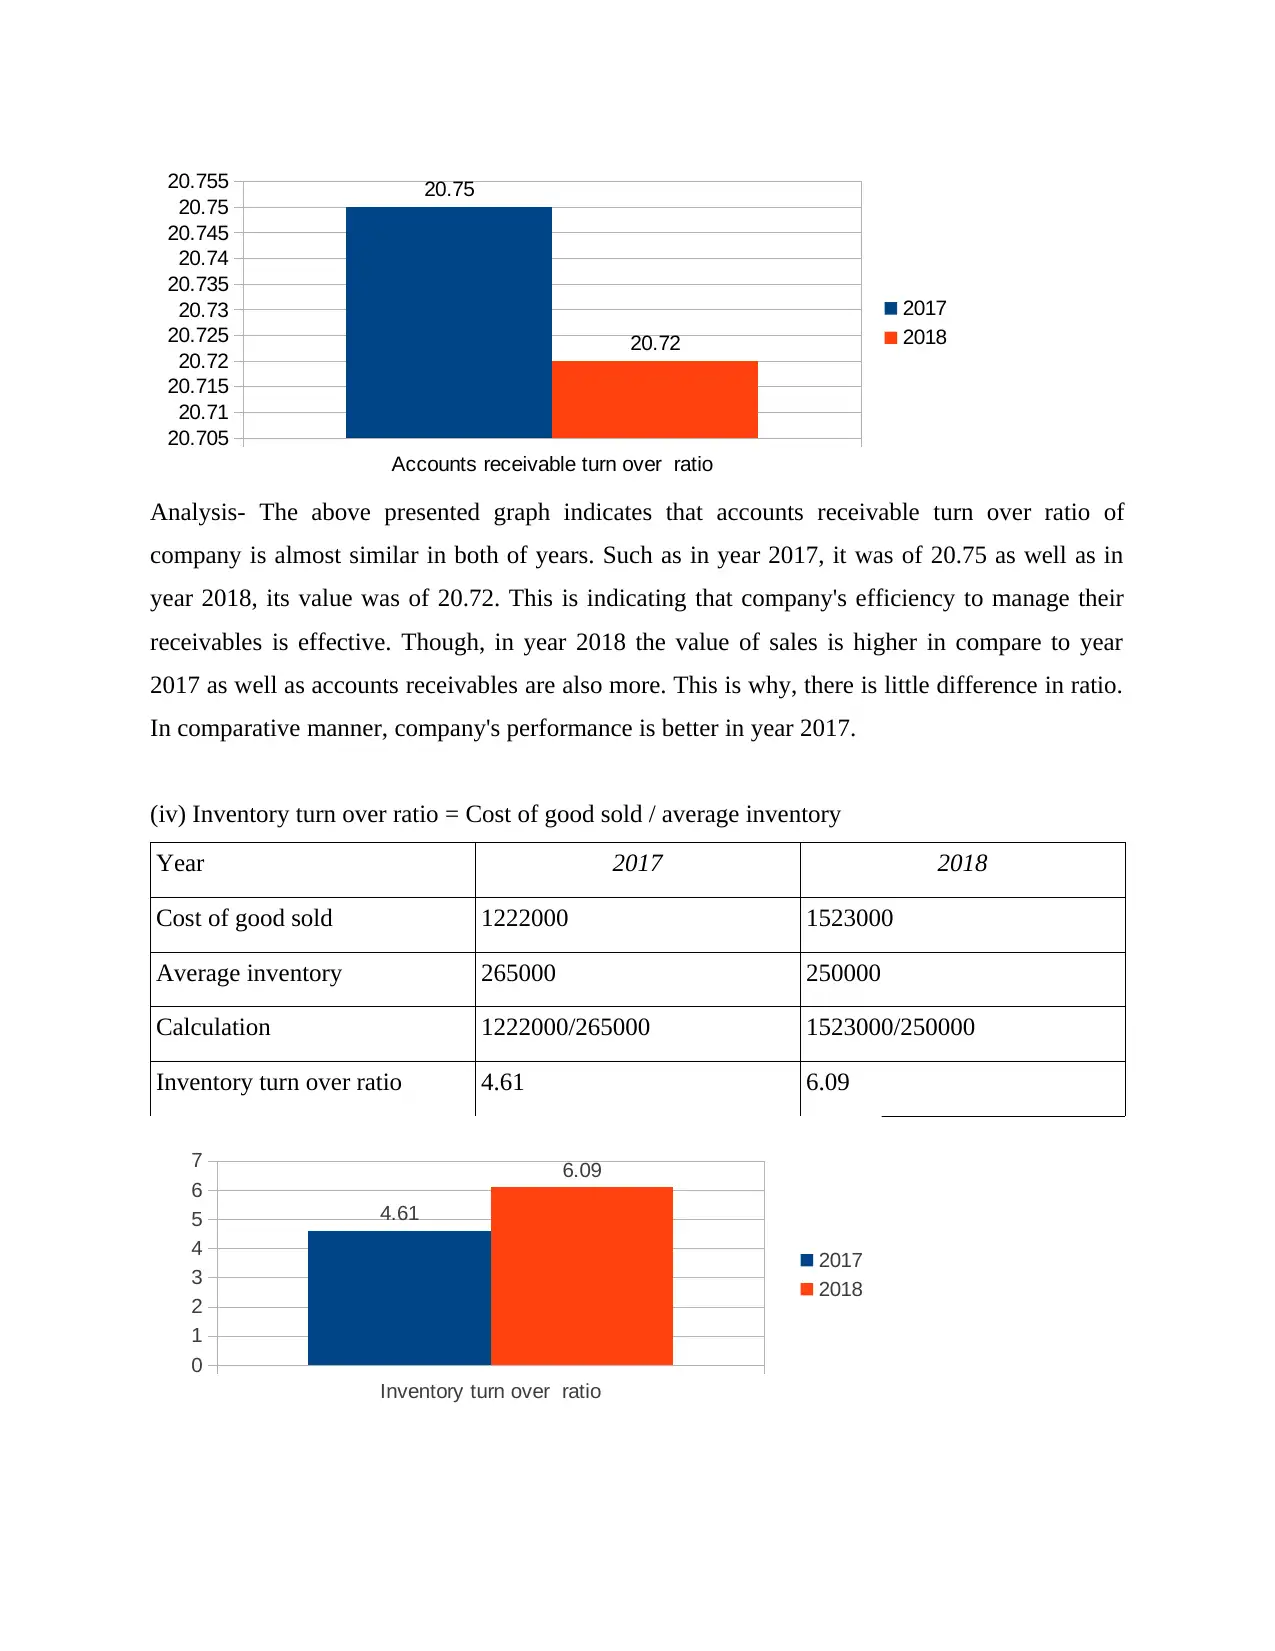
Analysis- The above presented graph indicates that accounts receivable turn over ratio of
company is almost similar in both of years. Such as in year 2017, it was of 20.75 as well as in
year 2018, its value was of 20.72. This is indicating that company's efficiency to manage their
receivables is effective. Though, in year 2018 the value of sales is higher in compare to year
2017 as well as accounts receivables are also more. This is why, there is little difference in ratio.
In comparative manner, company's performance is better in year 2017.
(iv) Inventory turn over ratio = Cost of good sold / average inventory
Year 2017 2018
Cost of good sold 1222000 1523000
Average inventory 265000 250000
Calculation 1222000/265000 1523000/250000
Inventory turn over ratio 4.61 6.09
Inventory turn over ratio
0
1
2
3
4
5
6
7
4.61
6.09
2017
2018
Accounts receivable turn over ratio
20.705
20.71
20.715
20.72
20.725
20.73
20.735
20.74
20.745
20.75
20.755 20.75
20.72
2017
2018
⊘ This is a preview!⊘
Do you want full access?
Subscribe today to unlock all pages.
Trusted by 1+ million students worldwide
1 out of 20
Related Documents


Your All-in-One AI-Powered Toolkit for Academic Success.
+13062052269
info@desklib.com
Available 24*7 on WhatsApp / Email
![[object Object]](/_next/static/media/star-bottom.7253800d.svg)
Unlock your academic potential
Copyright © 2020–2026 A2Z Services. All Rights Reserved. Developed and managed by ZUCOL.