Accountancy Introduction Task Solution - Financial Analysis

Verified

Added on  2023/06/09

|8
|1134
|149
Homework Assignment
AI Summary
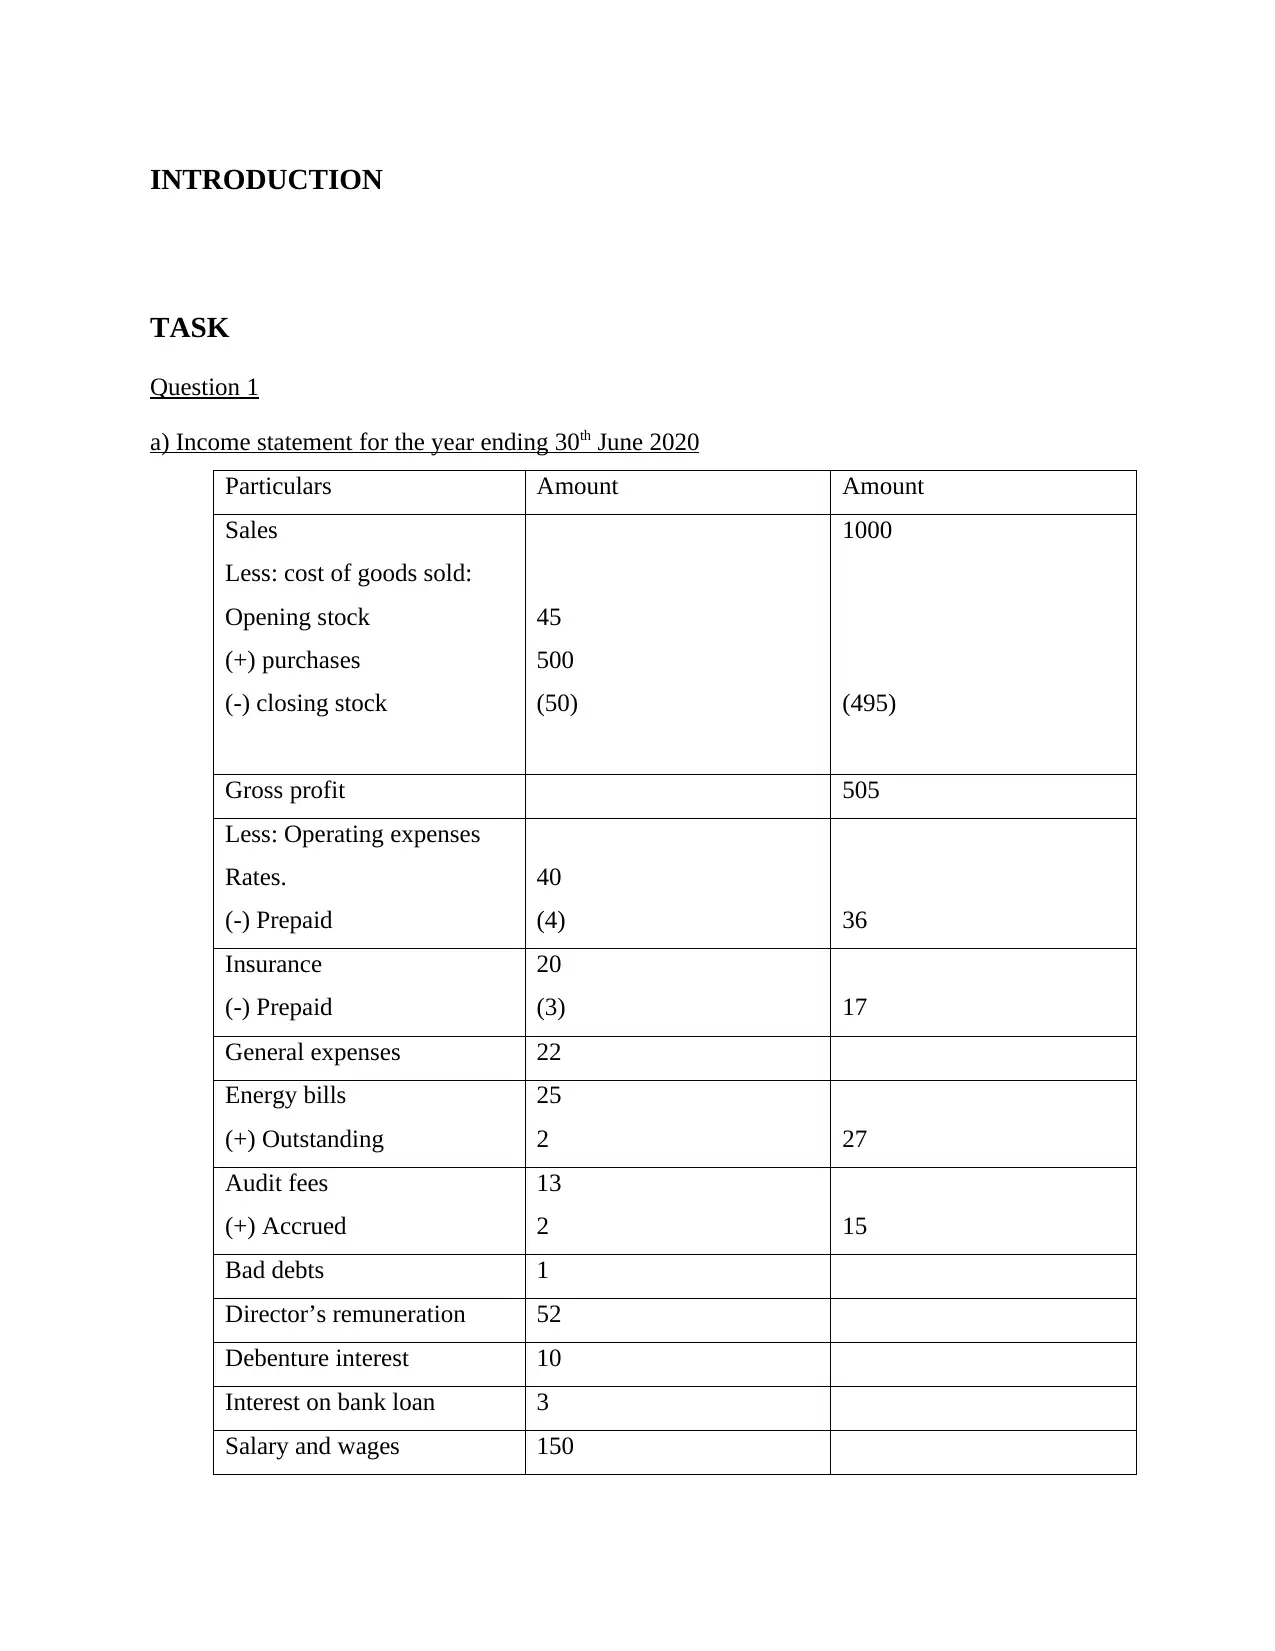
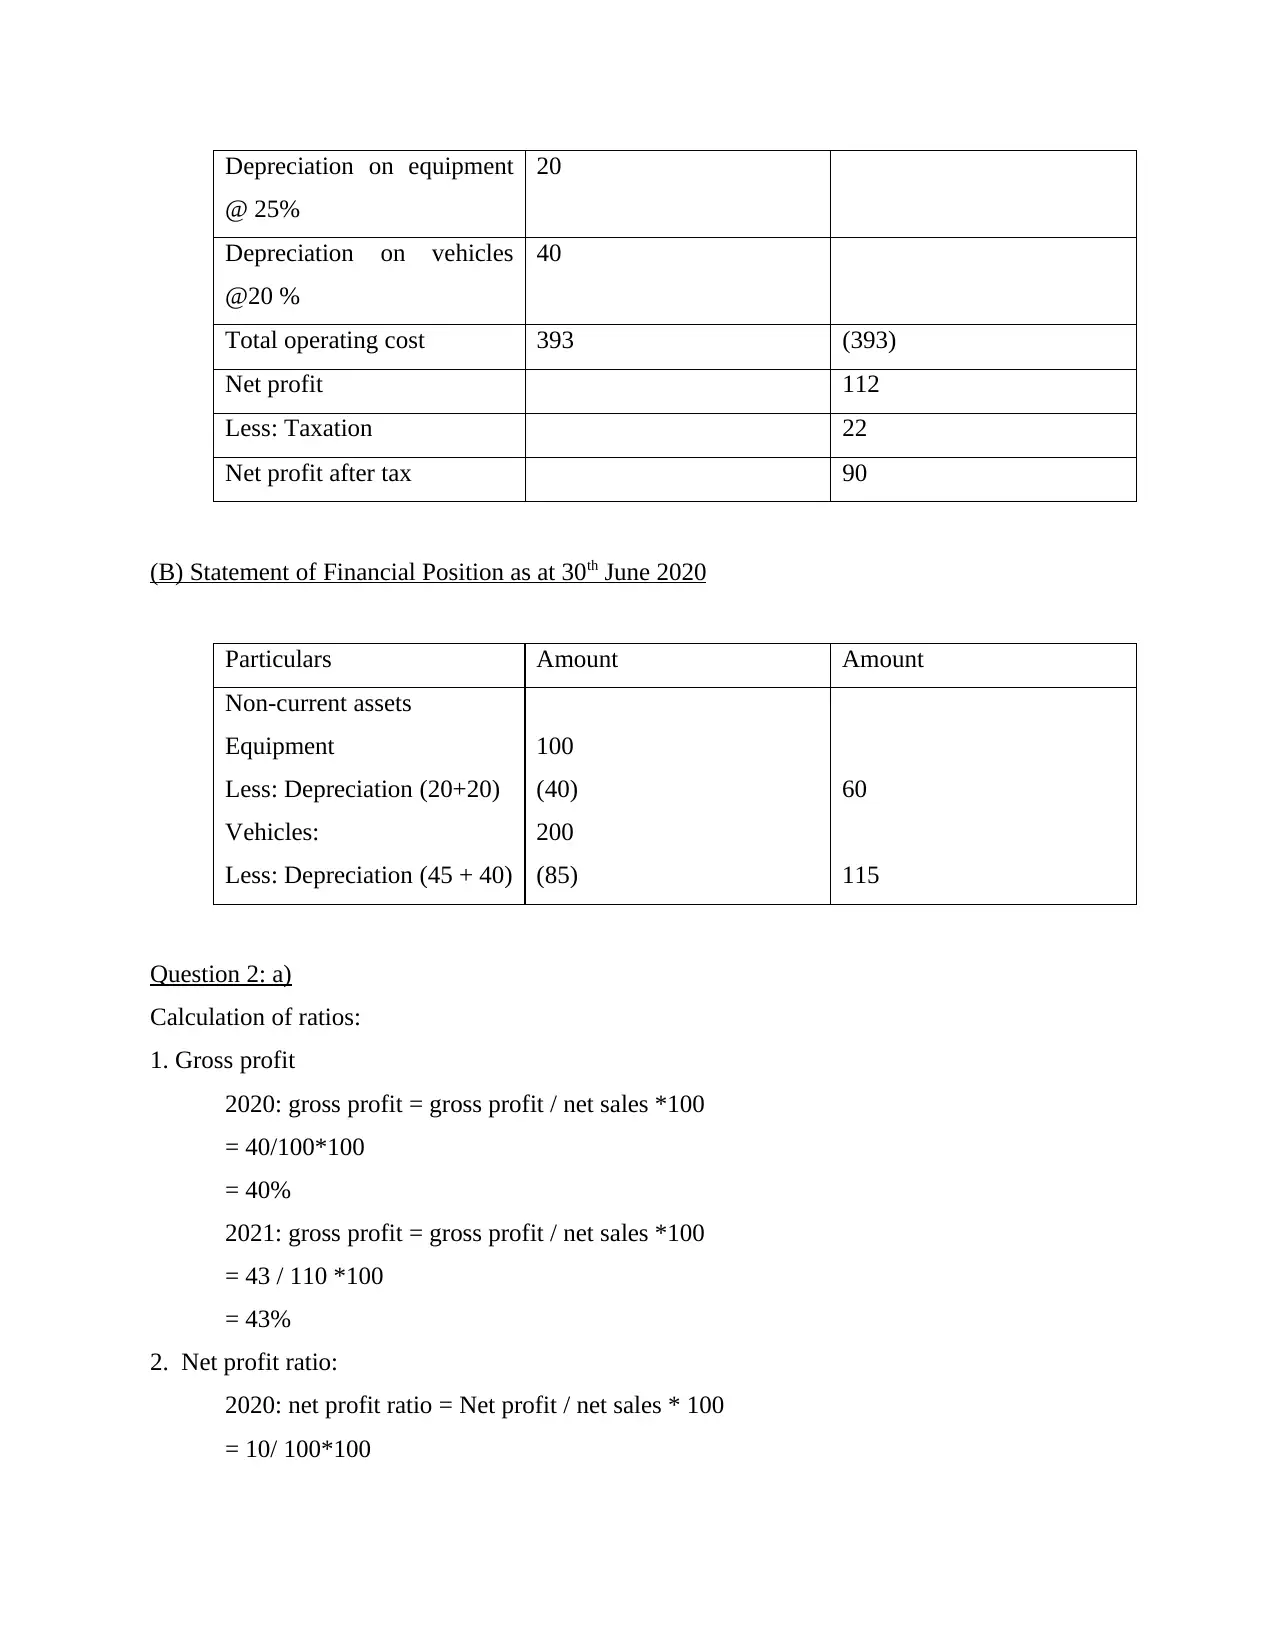
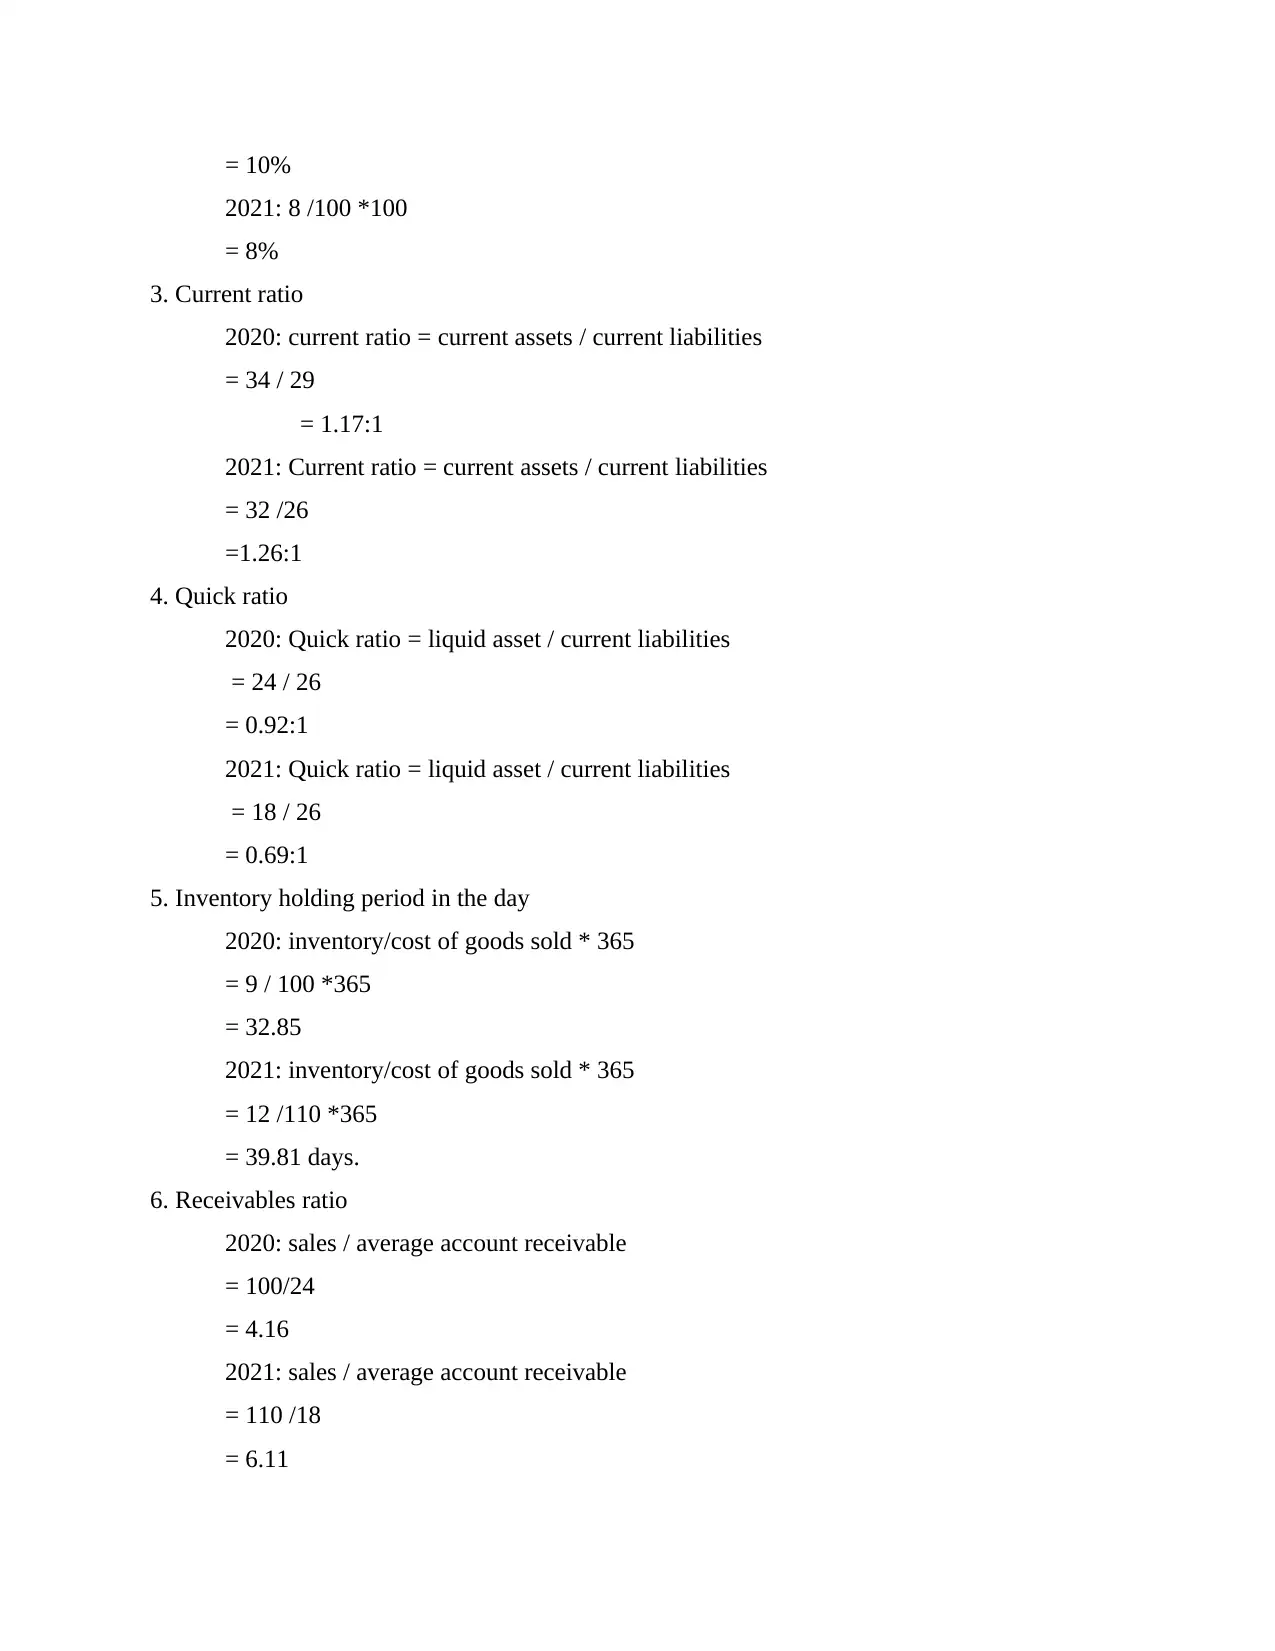
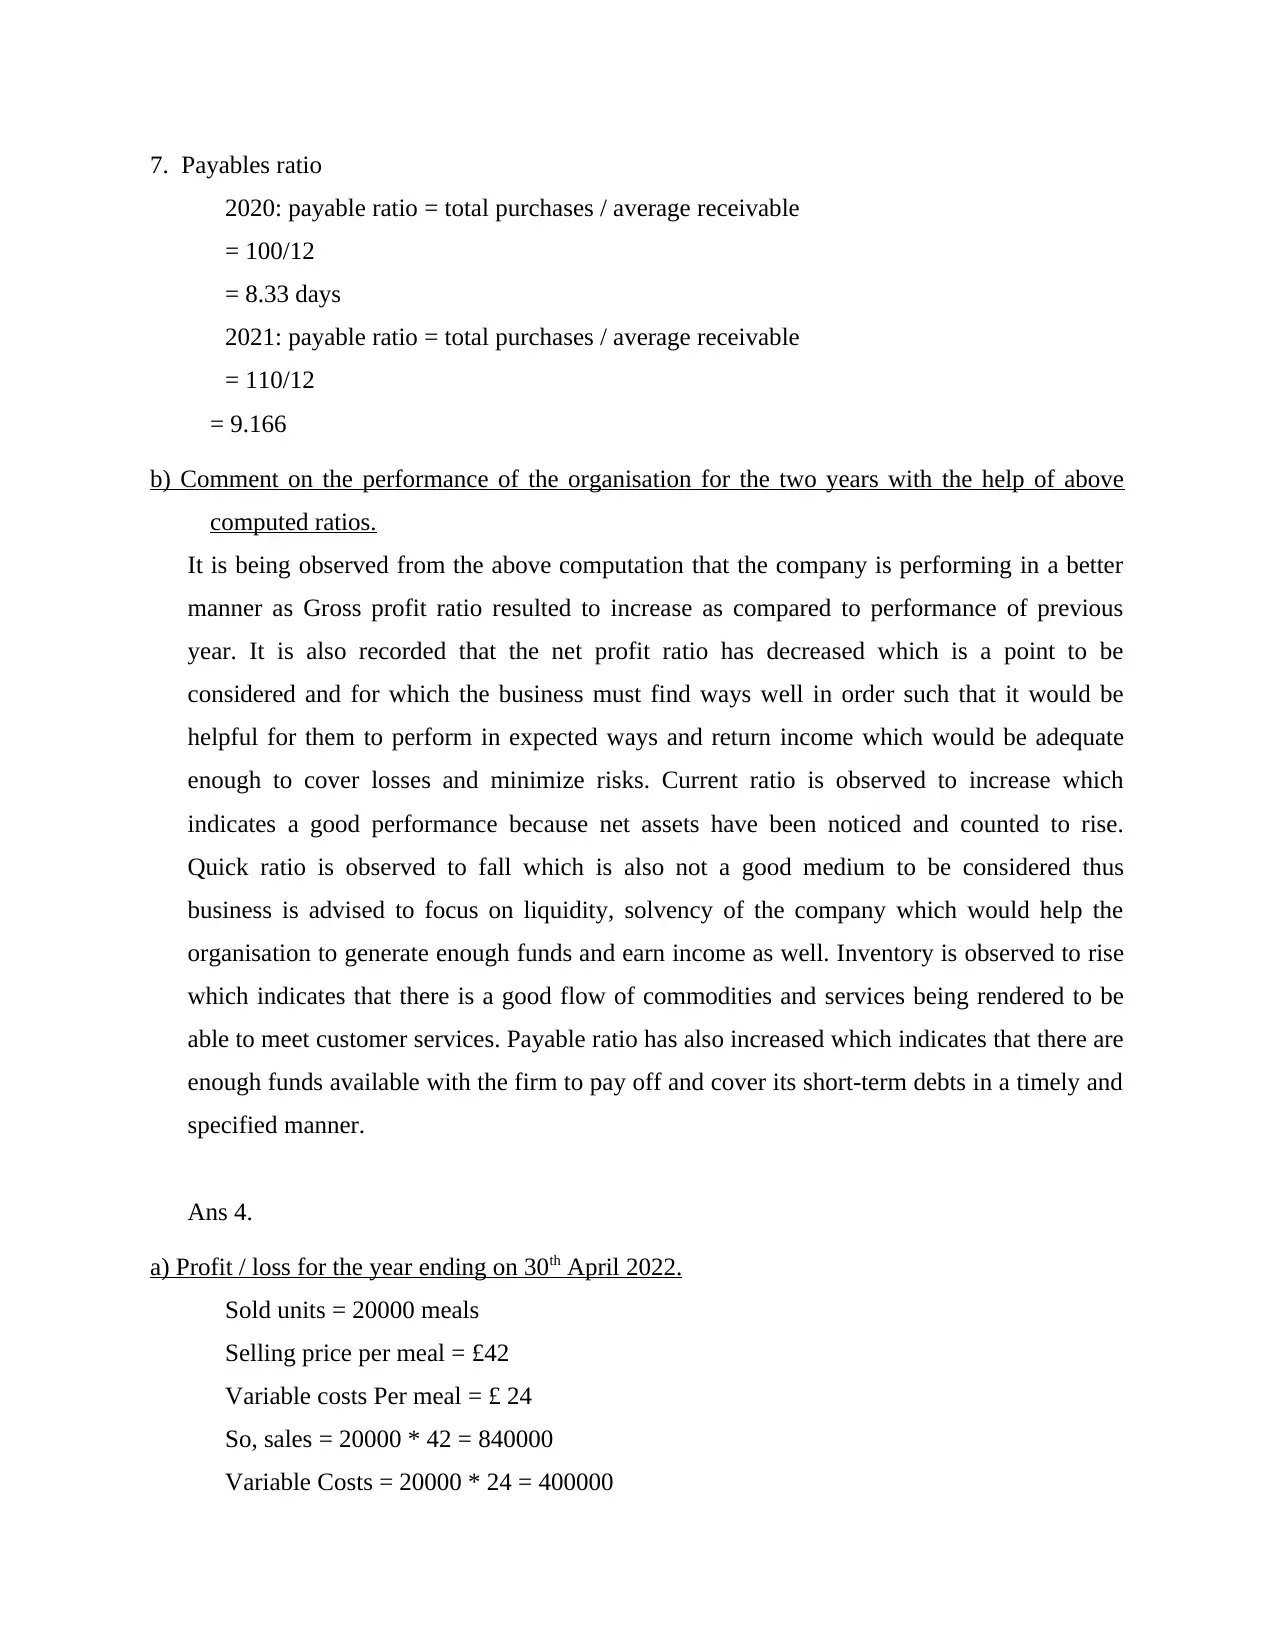
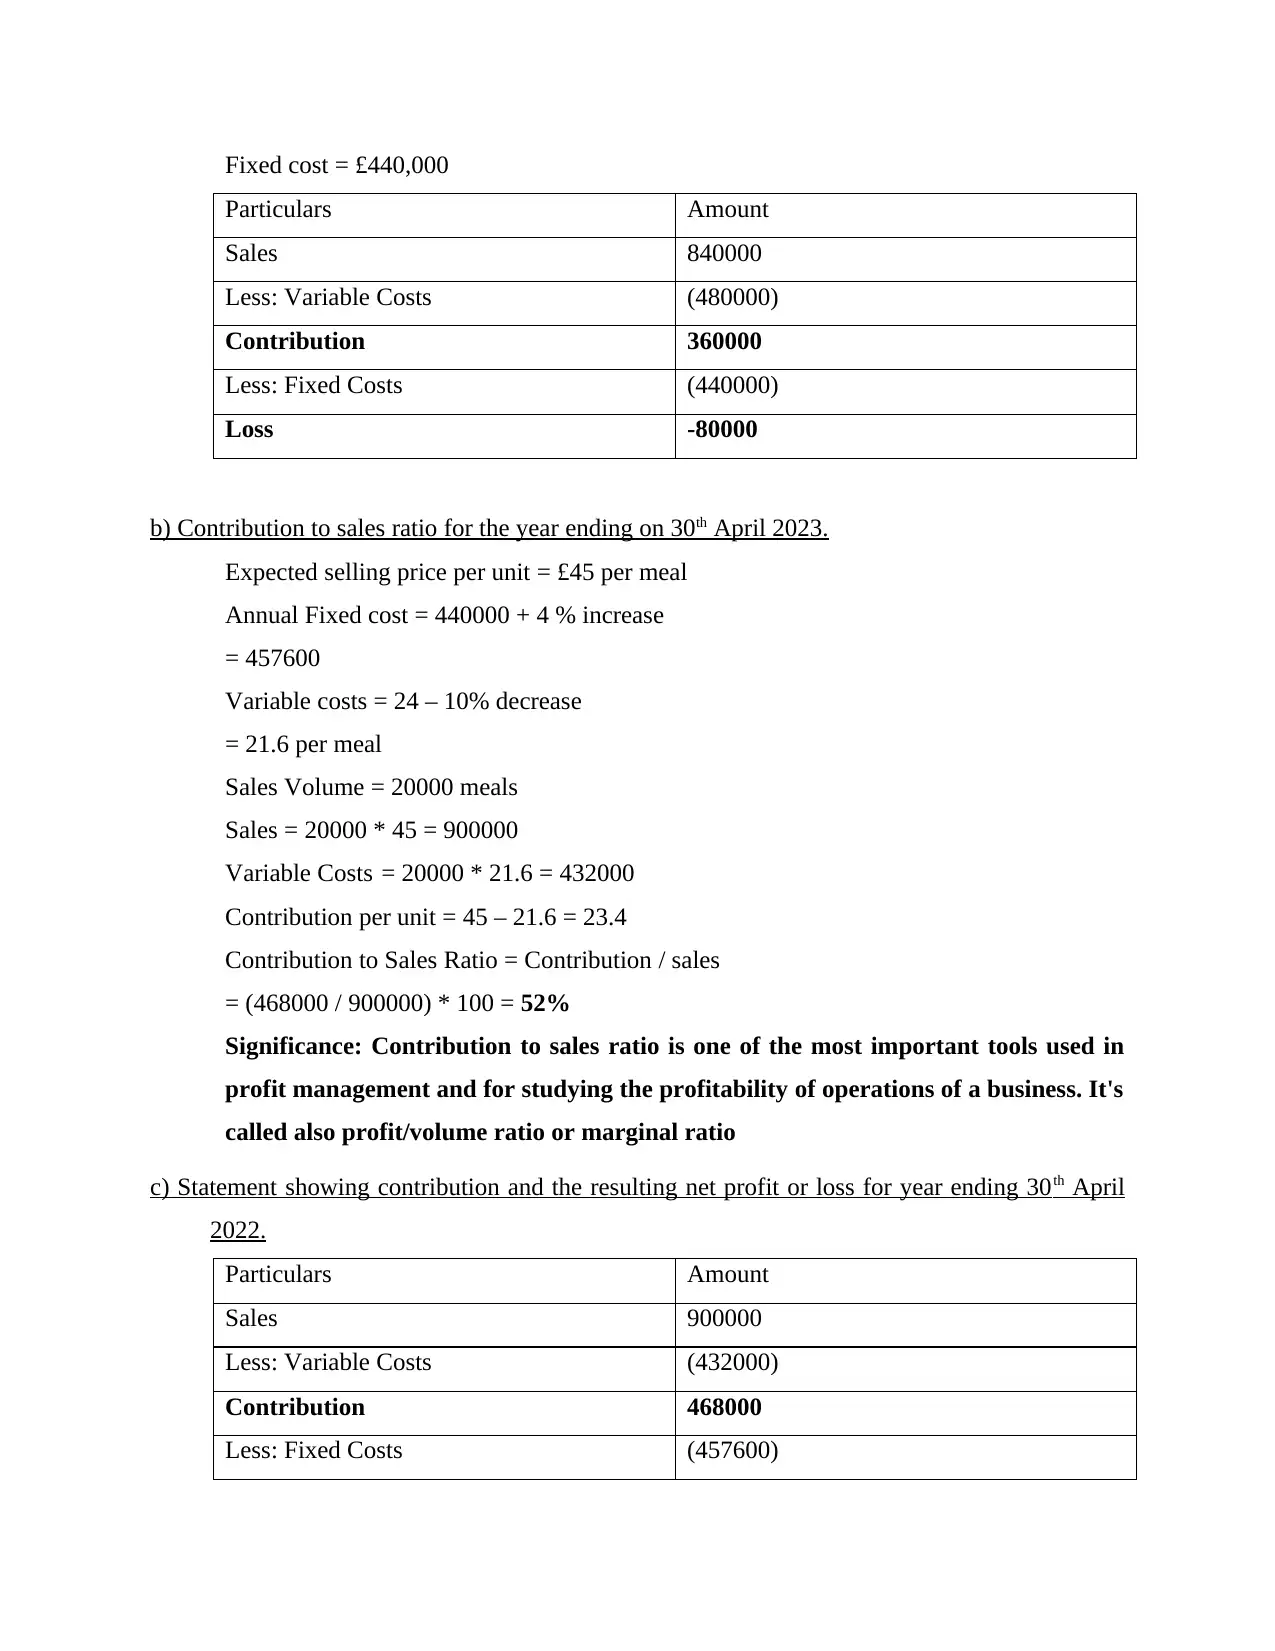
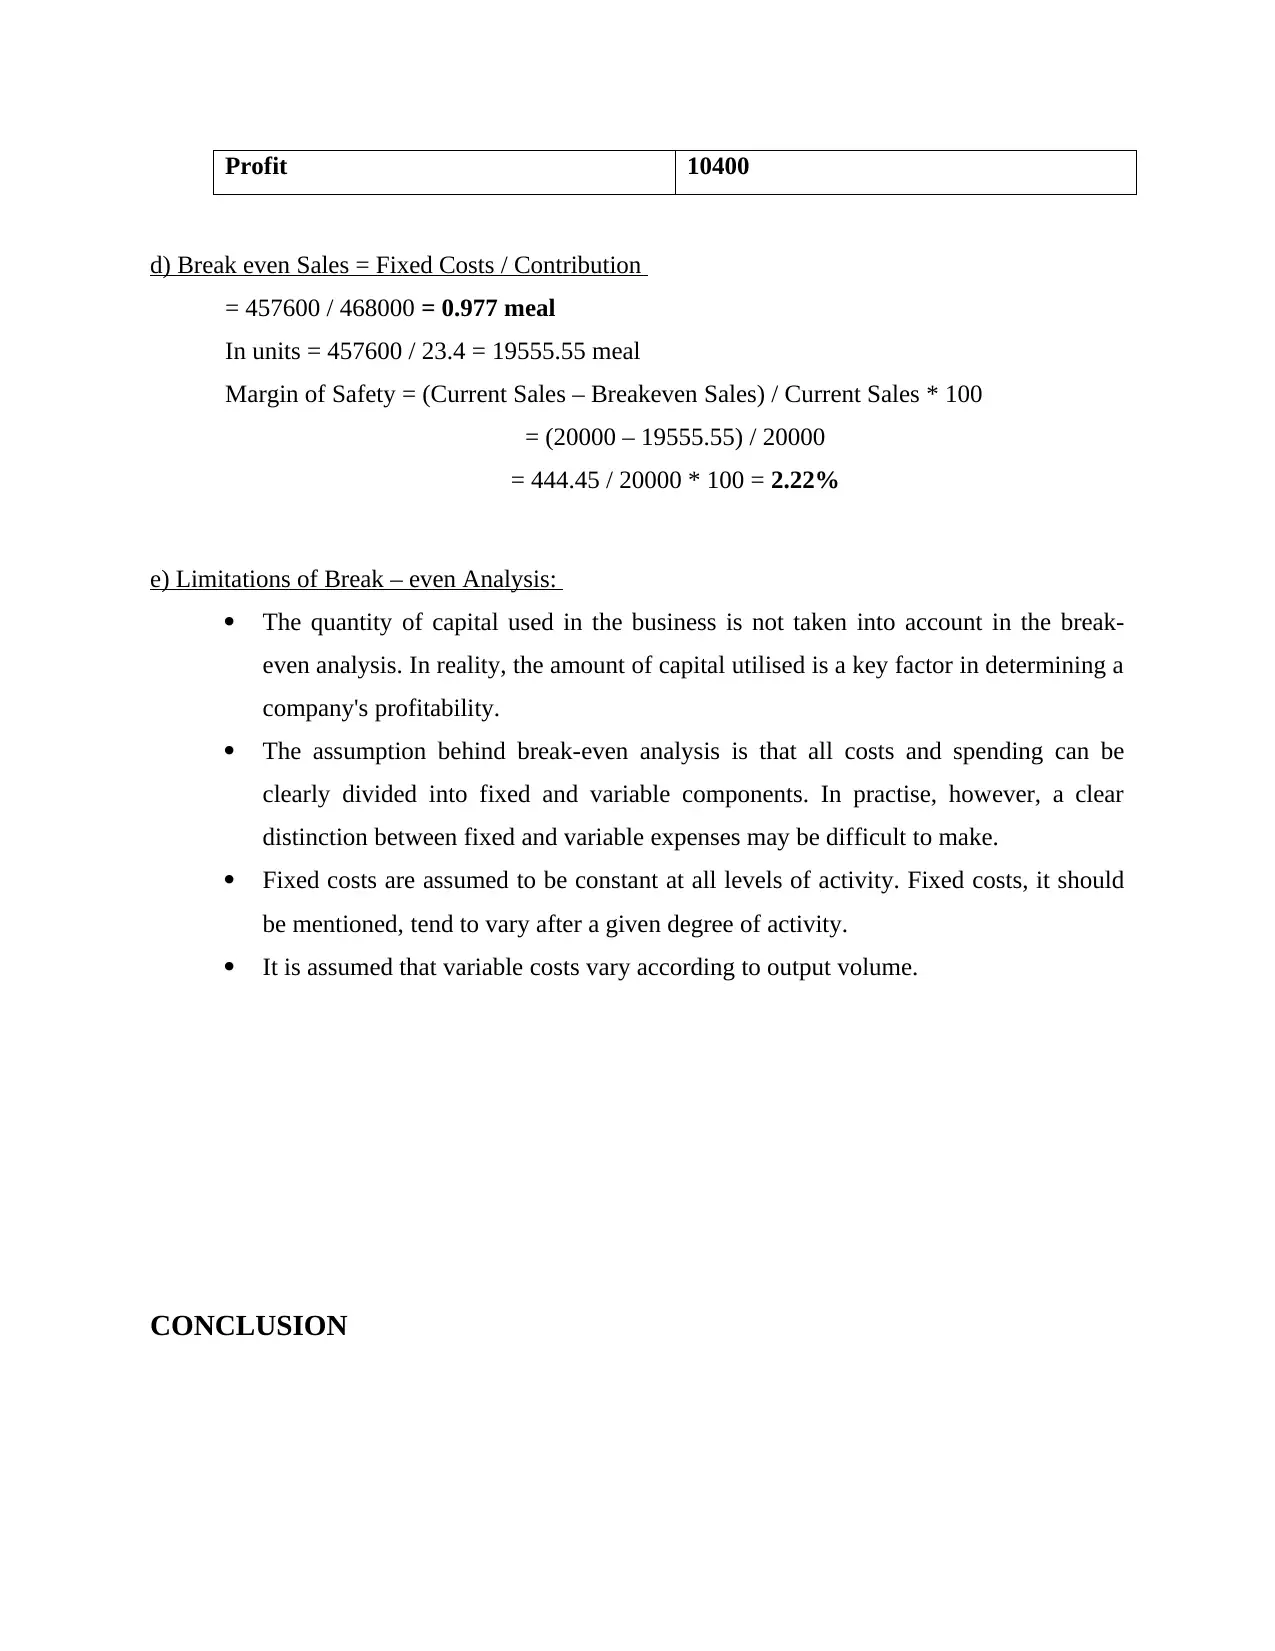
This accountancy assignment solution presents a comprehensive analysis of financial statements, ratio calculations, and break-even analysis. The solution begins with the preparation of an income statement and a statement of financial position. It then delves into ratio analysis, comparing gross profit, net profit, current, quick, inventory holding, receivables, and payables ratios for two years, with comments on the organization's performance. The assignment also includes a profit/loss calculation, contribution to sales ratio, and break-even analysis, followed by a discussion of the limitations of break-even analysis. The document concludes with references and is designed to help students understand financial accounting concepts.
Document Page
ACCOUNTANCY
tabler-icon-diamond-filled.svg

Paraphrase This Document

Need a fresh take? Get an instant paraphrase of this document with our AI Paraphraser
Document Page
INTRODUCTION
TASK
Question 1
a) Income statement for the year ending 30th June 2020
Particulars Amount Amount
Sales
Less: cost of goods sold:
Opening stock
(+) purchases
(-) closing stock
45
500
(50)
1000
(495)
Gross profit 505
Less: Operating expenses
Rates.
(-) Prepaid
40
(4) 36
Insurance
(-) Prepaid
20
(3) 17
General expenses 22
Energy bills
(+) Outstanding
25
2 27
Audit fees
(+) Accrued
13
2 15
Bad debts 1
Director’s remuneration 52
Debenture interest 10
Interest on bank loan 3
Salary and wages 150
Document Page
Depreciation on equipment
@ 25%
20
Depreciation on vehicles
@20 %
40
Total operating cost 393 (393)
Net profit 112
Less: Taxation 22
Net profit after tax 90
(B) Statement of Financial Position as at 30th June 2020
Particulars Amount Amount
Non-current assets
Equipment
Less: Depreciation (20+20)
Vehicles:
Less: Depreciation (45 + 40)
100
(40)
200
(85)
60
115
Question 2: a)
Calculation of ratios:
1. Gross profit
2020: gross profit = gross profit / net sales *100
= 40/100*100
= 40%
2021: gross profit = gross profit / net sales *100
= 43 / 110 *100
= 43%
2. Net profit ratio:
2020: net profit ratio = Net profit / net sales * 100
= 10/ 100*100
Document Page
= 10%
2021: 8 /100 *100
= 8%
3. Current ratio
2020: current ratio = current assets / current liabilities
= 34 / 29
= 1.17:1
2021: Current ratio = current assets / current liabilities
= 32 /26
=1.26:1
4. Quick ratio
2020: Quick ratio = liquid asset / current liabilities
= 24 / 26
= 0.92:1
2021: Quick ratio = liquid asset / current liabilities
= 18 / 26
= 0.69:1
5. Inventory holding period in the day
2020: inventory/cost of goods sold * 365
= 9 / 100 *365
= 32.85
2021: inventory/cost of goods sold * 365
= 12 /110 *365
= 39.81 days.
6. Receivables ratio
2020: sales / average account receivable
= 100/24
= 4.16
2021: sales / average account receivable
= 110 /18
= 6.11
tabler-icon-diamond-filled.svg

Paraphrase This Document

Need a fresh take? Get an instant paraphrase of this document with our AI Paraphraser
Document Page
7. Payables ratio
2020: payable ratio = total purchases / average receivable
= 100/12
= 8.33 days
2021: payable ratio = total purchases / average receivable
= 110/12
= 9.166
b) Comment on the performance of the organisation for the two years with the help of above
computed ratios.
It is being observed from the above computation that the company is performing in a better
manner as Gross profit ratio resulted to increase as compared to performance of previous
year. It is also recorded that the net profit ratio has decreased which is a point to be
considered and for which the business must find ways well in order such that it would be
helpful for them to perform in expected ways and return income which would be adequate
enough to cover losses and minimize risks. Current ratio is observed to increase which
indicates a good performance because net assets have been noticed and counted to rise.
Quick ratio is observed to fall which is also not a good medium to be considered thus
business is advised to focus on liquidity, solvency of the company which would help the
organisation to generate enough funds and earn income as well. Inventory is observed to rise
which indicates that there is a good flow of commodities and services being rendered to be
able to meet customer services. Payable ratio has also increased which indicates that there are
enough funds available with the firm to pay off and cover its short-term debts in a timely and
specified manner.
Ans 4.
a) Profit / loss for the year ending on 30th April 2022.
Sold units = 20000 meals
Selling price per meal = £42
Variable costs Per meal = £ 24
So, sales = 20000 * 42 = 840000
Variable Costs = 20000 * 24 = 400000
Document Page
Fixed cost = £440,000
Particulars Amount
Sales 840000
Less: Variable Costs (480000)
Contribution 360000
Less: Fixed Costs (440000)
Loss -80000
b) Contribution to sales ratio for the year ending on 30th April 2023.
Expected selling price per unit = £45 per meal
Annual Fixed cost = 440000 + 4 % increase
= 457600
Variable costs = 24 – 10% decrease
= 21.6 per meal
Sales Volume = 20000 meals
Sales = 20000 * 45 = 900000
Variable Costs = 20000 * 21.6 = 432000
Contribution per unit = 45 – 21.6 = 23.4
Contribution to Sales Ratio = Contribution / sales
= (468000 / 900000) * 100 = 52%
Significance: Contribution to sales ratio is one of the most important tools used in
profit management and for studying the profitability of operations of a business. It's
called also profit/volume ratio or marginal ratio
c) Statement showing contribution and the resulting net profit or loss for year ending 30th April
2022.
Particulars Amount
Sales 900000
Less: Variable Costs (432000)
Contribution 468000
Less: Fixed Costs (457600)
Document Page
Profit 10400
d) Break even Sales = Fixed Costs / Contribution
= 457600 / 468000 = 0.977 meal
In units = 457600 / 23.4 = 19555.55 meal
Margin of Safety = (Current Sales – Breakeven Sales) / Current Sales * 100
= (20000 – 19555.55) / 20000
= 444.45 / 20000 * 100 = 2.22%
e) Limitations of Break – even Analysis:
The quantity of capital used in the business is not taken into account in the break-
even analysis. In reality, the amount of capital utilised is a key factor in determining a
company's profitability.
The assumption behind break-even analysis is that all costs and spending can be
clearly divided into fixed and variable components. In practise, however, a clear
distinction between fixed and variable expenses may be difficult to make.
Fixed costs are assumed to be constant at all levels of activity. Fixed costs, it should
be mentioned, tend to vary after a given degree of activity.
It is assumed that variable costs vary according to output volume.
CONCLUSION
tabler-icon-diamond-filled.svg

Paraphrase This Document

Need a fresh take? Get an instant paraphrase of this document with our AI Paraphraser
Document Page
REFERENCES
Books and Journals
chevron_up_icon
1 out of 8
circle_padding
hide_on_mobile
zoom_out_icon
[object Object]