Financial Analysis Report: Company Performance Evaluation

Verified

Added on  2023/06/06

|5
|667
|318
Report
AI Summary
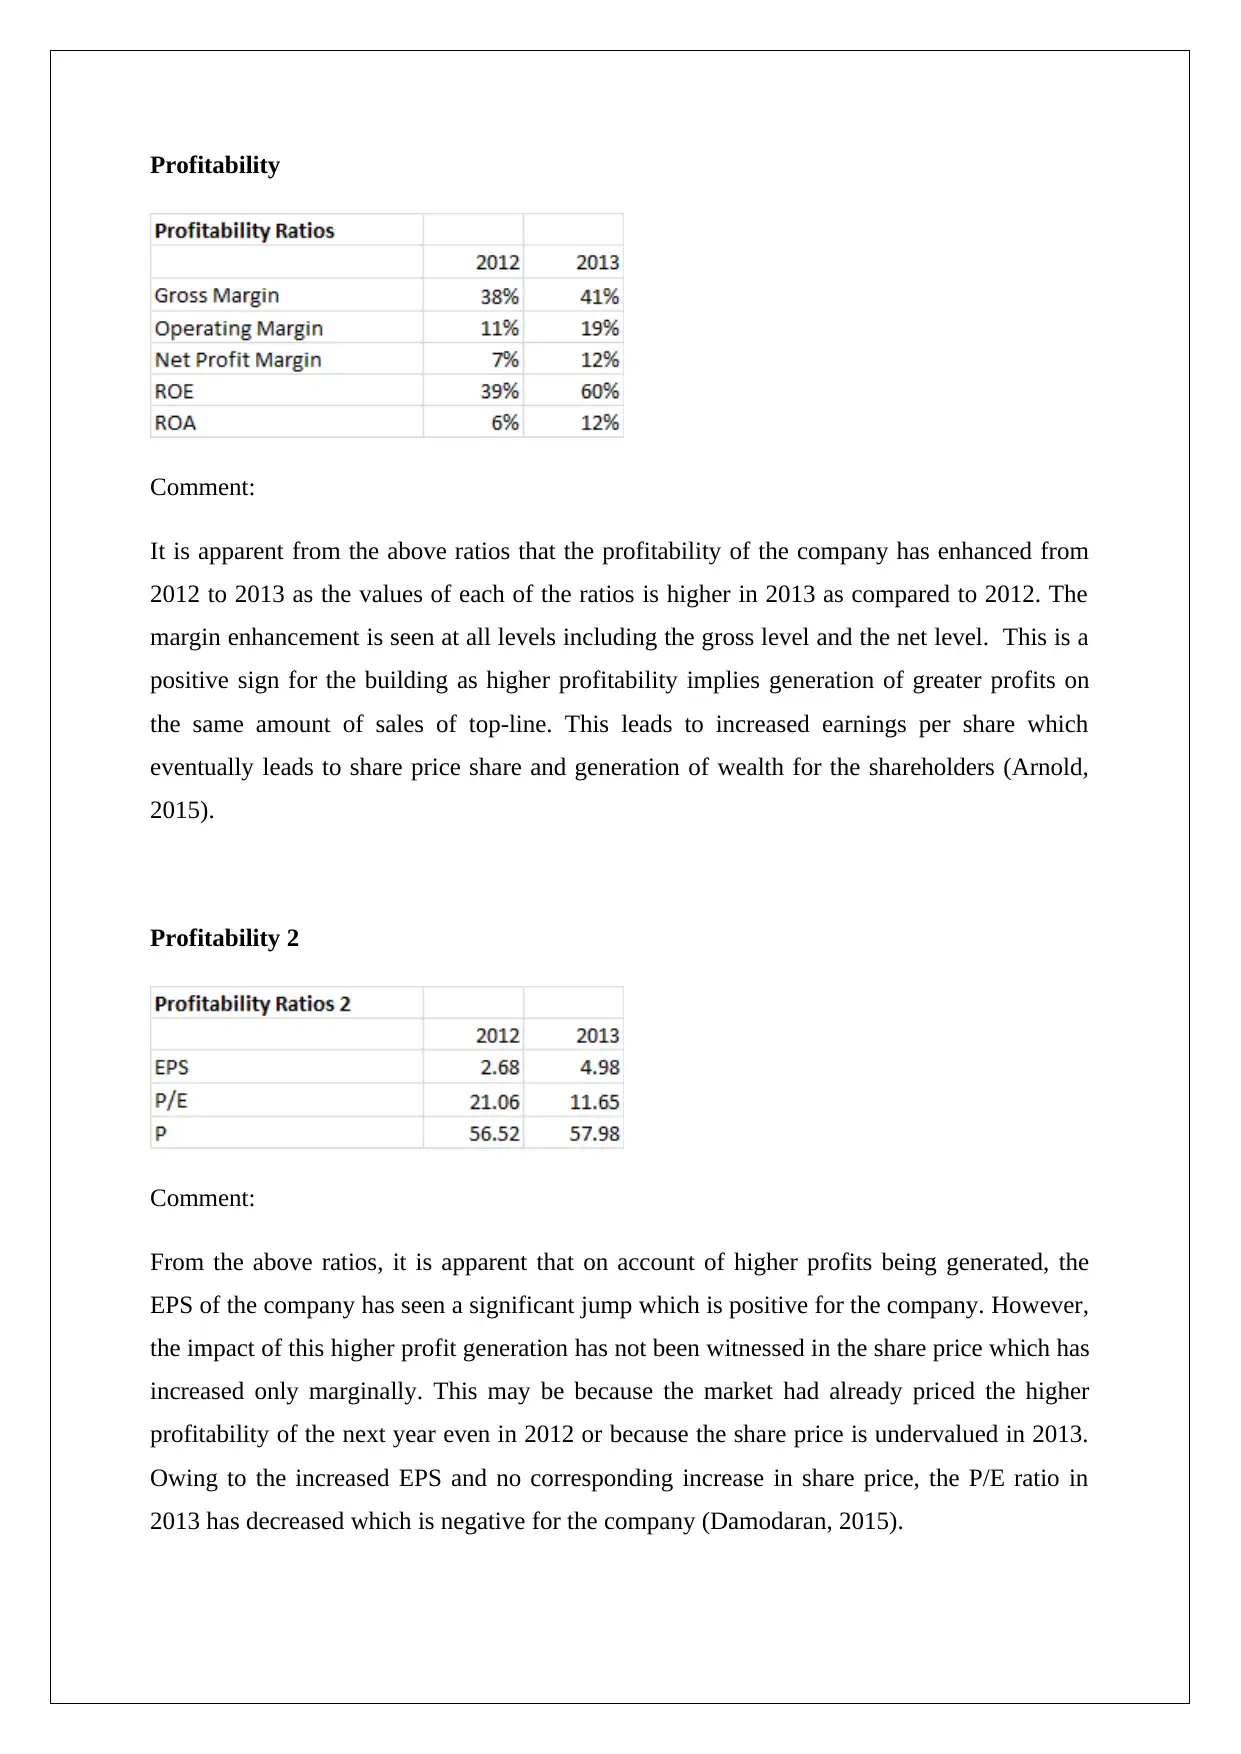
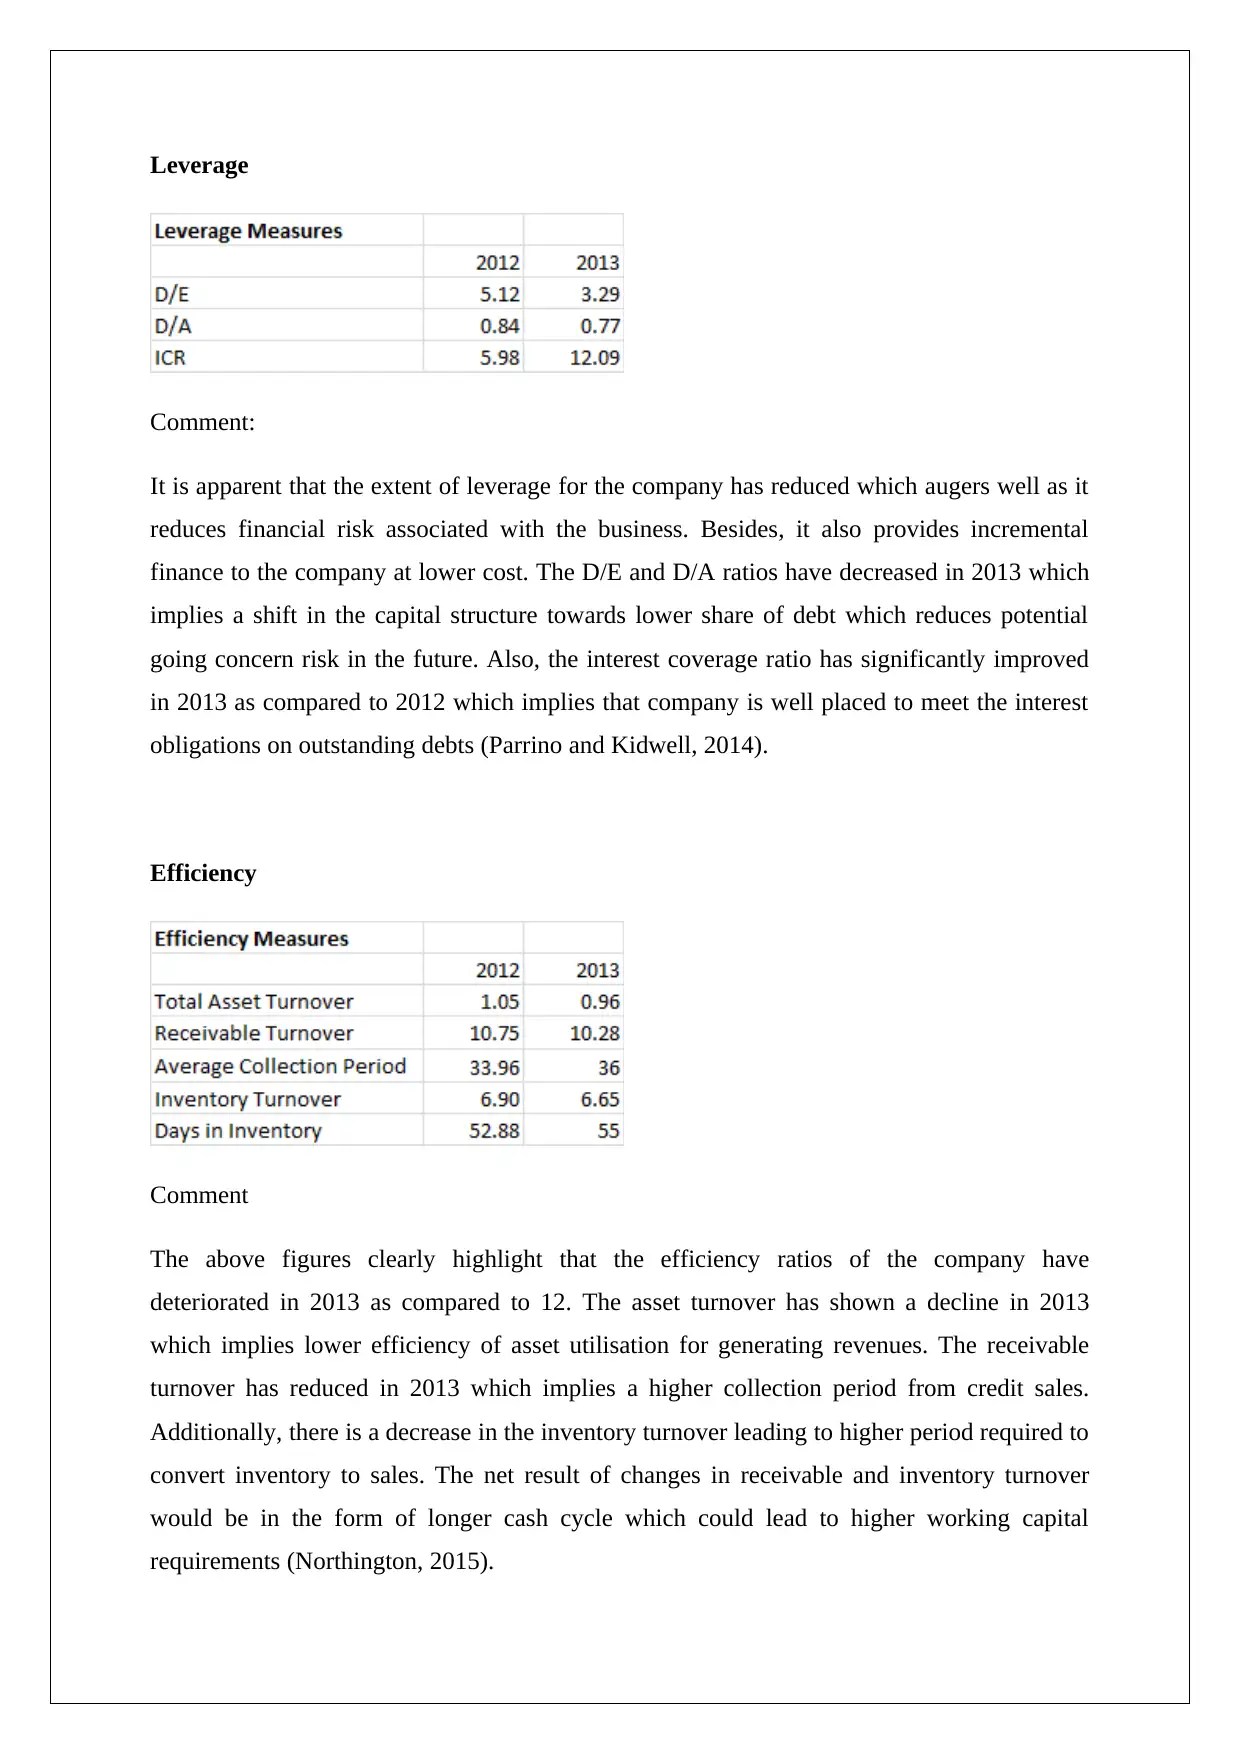
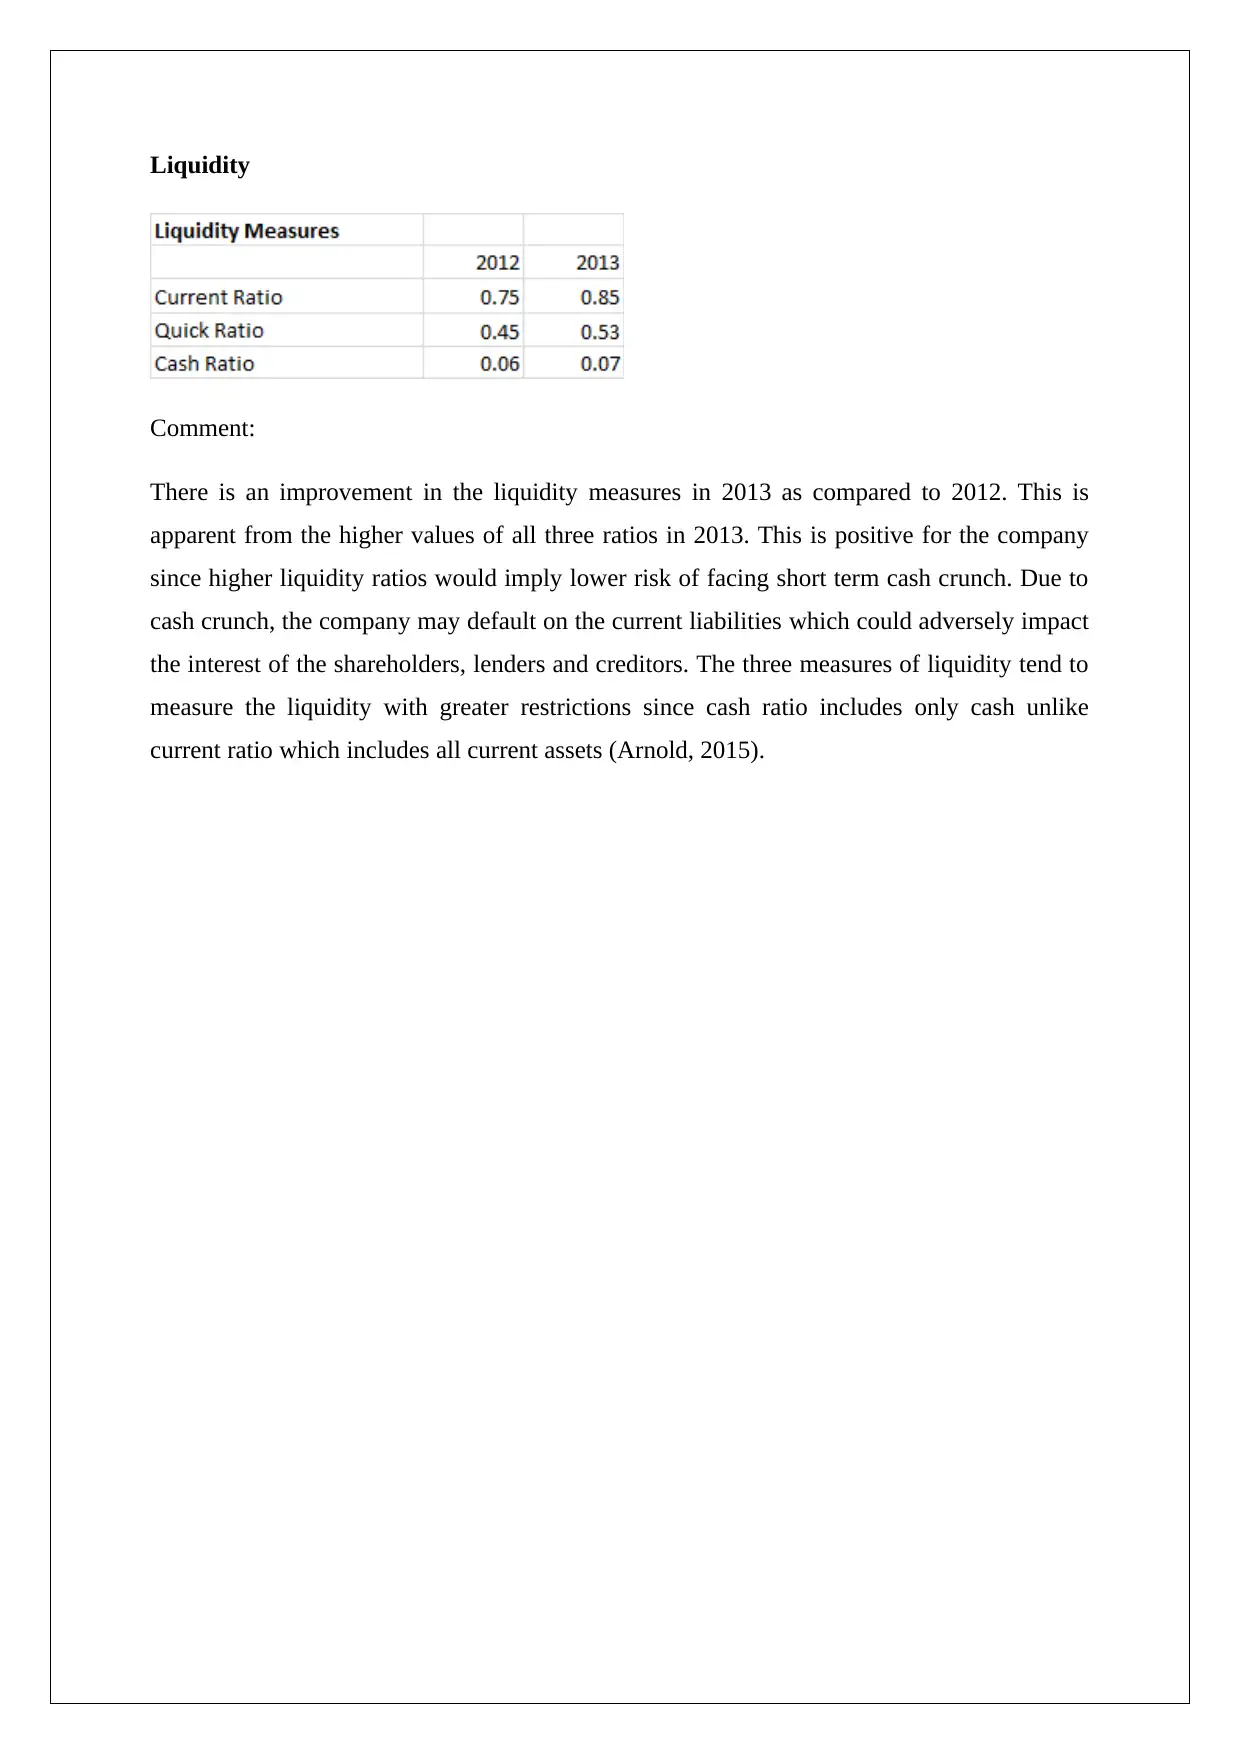
This report presents a financial analysis of a company, evaluating its performance across several key areas. The analysis begins with an assessment of profitability, comparing ratios from 2012 to 2013 to highlight improvements in gross and net margins, and discussing the impact on earnings per share and share price. The report then examines leverage, noting a reduction in the company's debt-to-equity and debt-to-assets ratios, which indicates decreased financial risk and improved interest coverage. Efficiency is analyzed, revealing a decline in asset turnover, receivable turnover, and inventory turnover, which suggests lower efficiency in asset utilization and longer collection and conversion periods. Finally, the report assesses liquidity, indicating an improvement in liquidity measures in 2013 compared to 2012, reducing the risk of short-term cash crunches. The analysis references key financial management texts and provides a comprehensive overview of the company's financial health and performance trends.
Document Page
ACCOUNTING FINANCIAL ANALYSIS
STUDENT ID:
[Pick the date]
tabler-icon-diamond-filled.svg

Paraphrase This Document

Need a fresh take? Get an instant paraphrase of this document with our AI Paraphraser
Document Page
Profitability
Comment:
It is apparent from the above ratios that the profitability of the company has enhanced from
2012 to 2013 as the values of each of the ratios is higher in 2013 as compared to 2012. The
margin enhancement is seen at all levels including the gross level and the net level. This is a
positive sign for the building as higher profitability implies generation of greater profits on
the same amount of sales of top-line. This leads to increased earnings per share which
eventually leads to share price share and generation of wealth for the shareholders (Arnold,
2015).
Profitability 2
Comment:
From the above ratios, it is apparent that on account of higher profits being generated, the
EPS of the company has seen a significant jump which is positive for the company. However,
the impact of this higher profit generation has not been witnessed in the share price which has
increased only marginally. This may be because the market had already priced the higher
profitability of the next year even in 2012 or because the share price is undervalued in 2013.
Owing to the increased EPS and no corresponding increase in share price, the P/E ratio in
2013 has decreased which is negative for the company (Damodaran, 2015).
Document Page
Leverage
Comment:
It is apparent that the extent of leverage for the company has reduced which augers well as it
reduces financial risk associated with the business. Besides, it also provides incremental
finance to the company at lower cost. The D/E and D/A ratios have decreased in 2013 which
implies a shift in the capital structure towards lower share of debt which reduces potential
going concern risk in the future. Also, the interest coverage ratio has significantly improved
in 2013 as compared to 2012 which implies that company is well placed to meet the interest
obligations on outstanding debts (Parrino and Kidwell, 2014).
Efficiency
Comment
The above figures clearly highlight that the efficiency ratios of the company have
deteriorated in 2013 as compared to 12. The asset turnover has shown a decline in 2013
which implies lower efficiency of asset utilisation for generating revenues. The receivable
turnover has reduced in 2013 which implies a higher collection period from credit sales.
Additionally, there is a decrease in the inventory turnover leading to higher period required to
convert inventory to sales. The net result of changes in receivable and inventory turnover
would be in the form of longer cash cycle which could lead to higher working capital
requirements (Northington, 2015).
Document Page
Liquidity
Comment:
There is an improvement in the liquidity measures in 2013 as compared to 2012. This is
apparent from the higher values of all three ratios in 2013. This is positive for the company
since higher liquidity ratios would imply lower risk of facing short term cash crunch. Due to
cash crunch, the company may default on the current liabilities which could adversely impact
the interest of the shareholders, lenders and creditors. The three measures of liquidity tend to
measure the liquidity with greater restrictions since cash ratio includes only cash unlike
current ratio which includes all current assets (Arnold, 2015).
tabler-icon-diamond-filled.svg

Paraphrase This Document

Need a fresh take? Get an instant paraphrase of this document with our AI Paraphraser
Document Page
References
Arnold, G. (2015) Corporate Financial Management. 3rd ed. Sydney: Financial Times
Management.
Damodaran, A. (2015). Applied corporate finance: A user’s manual 3rd ed. New York:
Wiley, John & Sons.
Northington, S. (2015) Finance, 4th ed. New York: Ferguson
Parrino, R. and Kidwell, D. (2014) Fundamentals of Corporate Finance, 3rd ed. London:
Wiley Publications
chevron_up_icon
1 out of 5
circle_padding
hide_on_mobile
zoom_out_icon
[object Object]