Bitmap Plc Financial Report: PGBM12 Accounting & Management Assessment
VerifiedAdded on 2023/04/17
|23
|4322
|184
Report
AI Summary
This report provides a comprehensive financial analysis of Bitmap Plc for the years 2016 and 2017, utilizing ratio analysis to evaluate the company's performance. Key areas of focus include profitability, gearing, liquidity, asset management, and investor potential, with specific ratios such as gross profit margin, return on capital employed, current ratio, quick ratio, and debt-to-equity ratio being analyzed. The report also examines Bitmap Plc's working capital cycle, highlighting the efficiency of asset management policies. Furthermore, it applies capital budgeting investment appraisal techniques to a given scenario, evaluating the payback period for different projects and assessing suitable sources of finance for investment. The assessment concludes with a critical evaluation of the budgeting process and its interlinking with strategic objectives and plans. Desklib offers a range of similar solved assignments and past papers for students.

1
PGBM12 Accounting and Financial Management Assessment January 2019 cohort
PGBM12 Accounting and Financial Management Assessment January 2019 cohort
Paraphrase This Document
Need a fresh take? Get an instant paraphrase of this document with our AI Paraphraser

2
Contents
Part A:..............................................................................................................................................4
Part A.1: Report for board of Bitmap plc........................................................................................4
Introduction......................................................................................................................................4
Ratio Analysis of Bitmap Plc..........................................................................................................4
Profitability Ratios Analysis........................................................................................................4
Gross Profit Ratio.....................................................................................................................4
Return on Capital Employed....................................................................................................5
Liquidity Ratio Analysis..............................................................................................................6
Current Ratio............................................................................................................................6
Quick Ratio...............................................................................................................................6
Gearing Ratio Analysis................................................................................................................7
Debt to equity ratio......................................................................................................................7
Asset utilization ratio analysis.....................................................................................................8
Inventory Turnover Ratio in days............................................................................................8
Asset Turnover ratio.................................................................................................................8
Investor’s potential analysis.........................................................................................................9
Dividend per share....................................................................................................................9
Earnings per share..................................................................................................................10
Conclusion.................................................................................................................................10
Part A.2: Working capital cycle of Bitmap plc..............................................................................10
Part B: Capital budgeting and managing finance..........................................................................12
Part B.1: Application of capital budgeting investment appraisal techniques to the given scenario
.......................................................................................................................................................12
Part B.2: Critical Evaluation of the Key Benefits and Limitations of Different Investment
Appraisal Techniques....................................................................................................................17
a. The Payback Period................................................................................................................17
b. The Discounted Payback Period............................................................................................17
c. The Accounting rate of return................................................................................................18
d. The Net Present Value...........................................................................................................18

3
Part B.3: Evaluation of Suitable Sources of Finance for funding this investment........................18
Part C:............................................................................................................................................20
Part C.1: Budget and its Relation with Strategic Objectives and Strategic Plans.........................20
Part C.2: Critical Evaluation of the Budgeting process and Interlinking of Various Budgets......20
References......................................................................................................................................22
⊘ This is a preview!⊘
Do you want full access?
Subscribe today to unlock all pages.
Trusted by 1+ million students worldwide

4
Part A:
Part A.1: Report for board of Bitmap plc
Introduction
The main purpose of report is to evaluate financial performance of Bitmap Plc for year
2016 and 2017 through use of ratio analysis as the most significant financial tool. The five most
important categories of ratio analysis that are used to evaluate the financial performance of
Bitmap Plc are profitability, gearing, liquidity, asset management and investors potential.
Ratio Analysis of Bitmap Plc
Particulars Bitmap plc
2016 2017
Amount in £000
Current Assets £ 4,150.00 £ 5,160.00
Current Liabilities £ 1,100.00 £ 1,500.00
Inventories £ 1,800.00 £ 2,360.00
Gross Profit £ 9,100.00 £ 12,200.00
Net Revenue/Sales £ 18,000.00 £ 23,000.00
Cost of goods sold £ 8,900.00 £ 10,800.00
Operating Profit Margin £ 5,100.00 £ 6,800.00
Net Profit Margin £ 3,220.00 £ 4,060.00
Debts (ALL) £ 2,000.00 £ 3,500.00
Shareholders’ Equity £ 12,000.00 £ 15,760.00
Total Assets £ 15,500.00 £ 20,360.00
Capital Employed £ 14,400.00 £ 18,860.00
Average Inventory £ 1,800.00 £ 2,080.00
Dividend Payments £ 200.00
£
300.00
Retained profit for the year £ 3,020.00 £ 3,760.00
Number of equity shares 10000 10000
Profitability Ratios Analysis
Gross Profit Ratio
This ratio measures gross profit earns by company on percentage of total sales revenue.
Formula: Gross Profit margin/Net sales or sales revenue (Brigham and Michael, 2013)
Particulars Bitmap plc
Paraphrase This Document
Need a fresh take? Get an instant paraphrase of this document with our AI Paraphraser
5
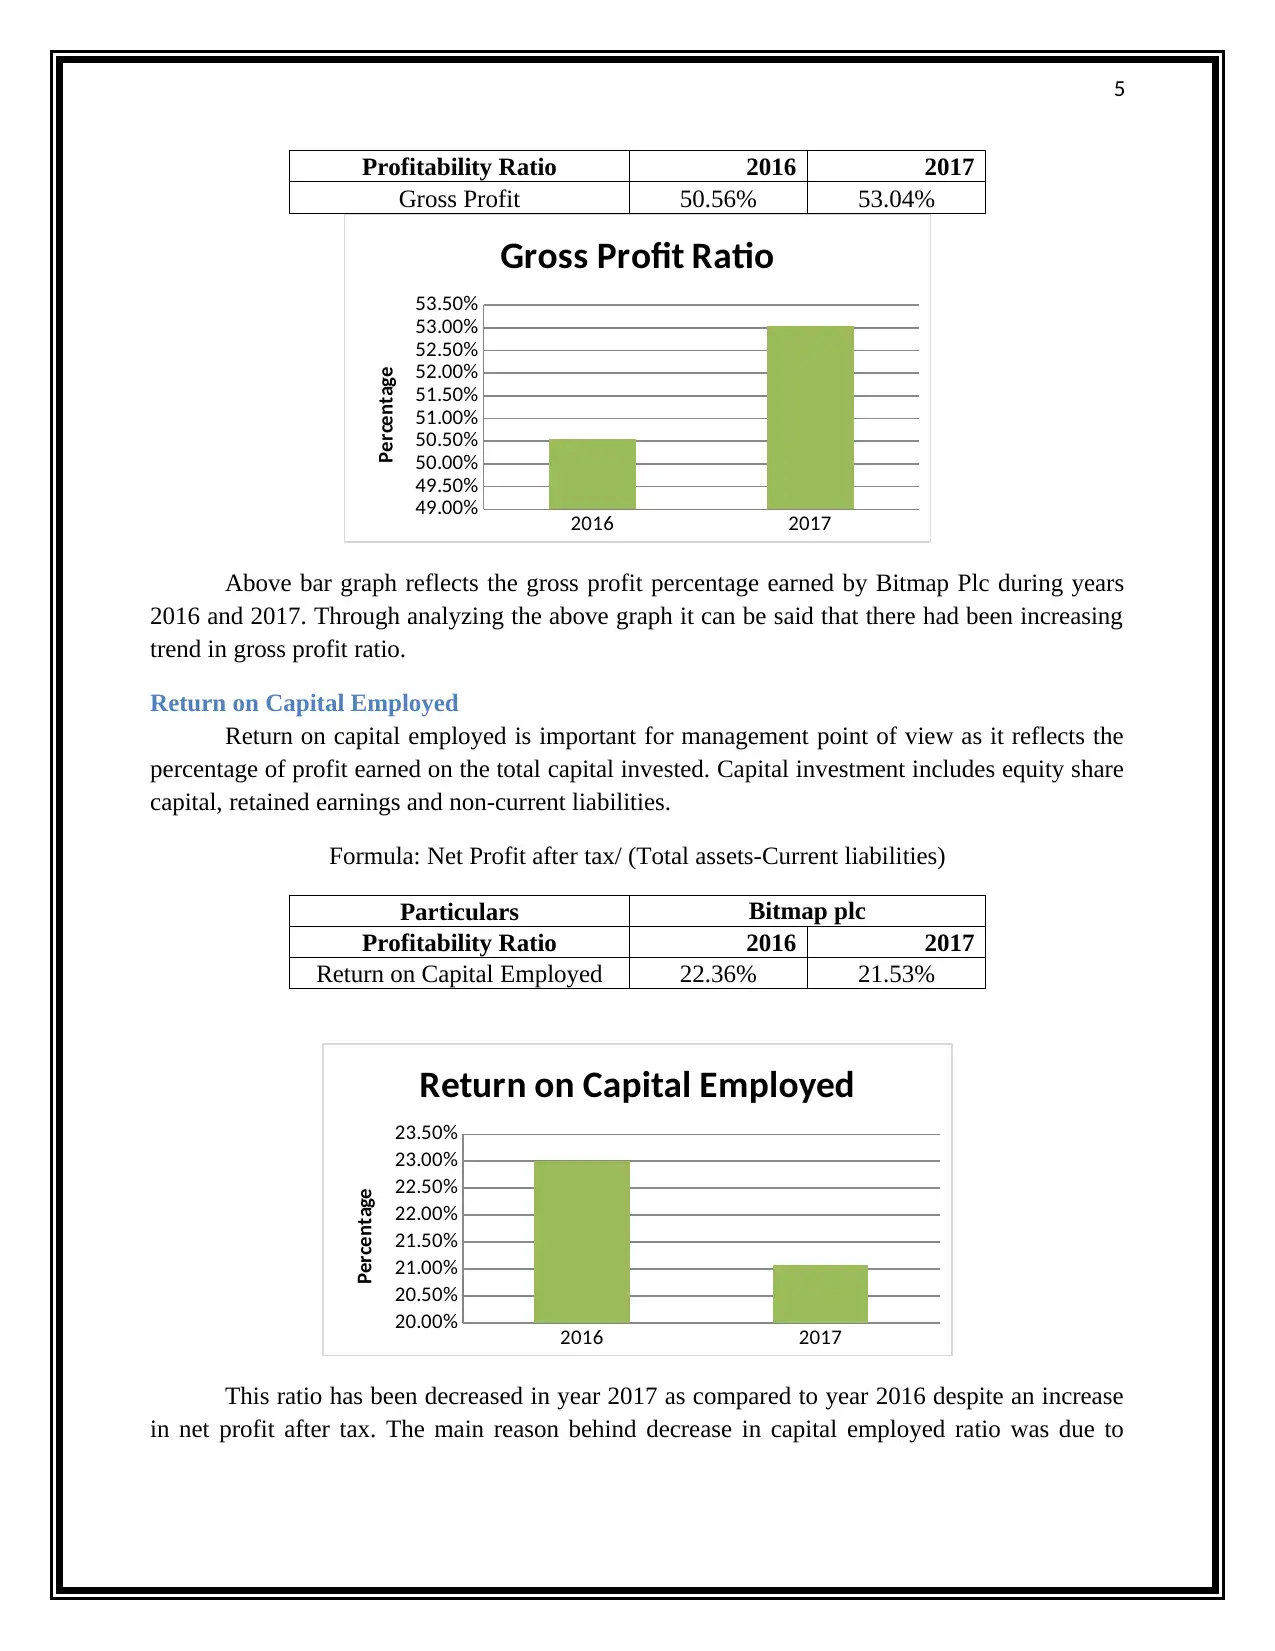
Profitability Ratio 2016 2017
Gross Profit 50.56% 53.04%
2016 2017
49.00%
49.50%
50.00%
50.50%
51.00%
51.50%
52.00%
52.50%
53.00%
53.50%
Gross Profit Ratio
Percentage
Above bar graph reflects the gross profit percentage earned by Bitmap Plc during years
2016 and 2017. Through analyzing the above graph it can be said that there had been increasing
trend in gross profit ratio.
Return on Capital Employed
Return on capital employed is important for management point of view as it reflects the
percentage of profit earned on the total capital invested. Capital investment includes equity share
capital, retained earnings and non-current liabilities.
Formula: Net Profit after tax/ (Total assets-Current liabilities)
Particulars Bitmap plc
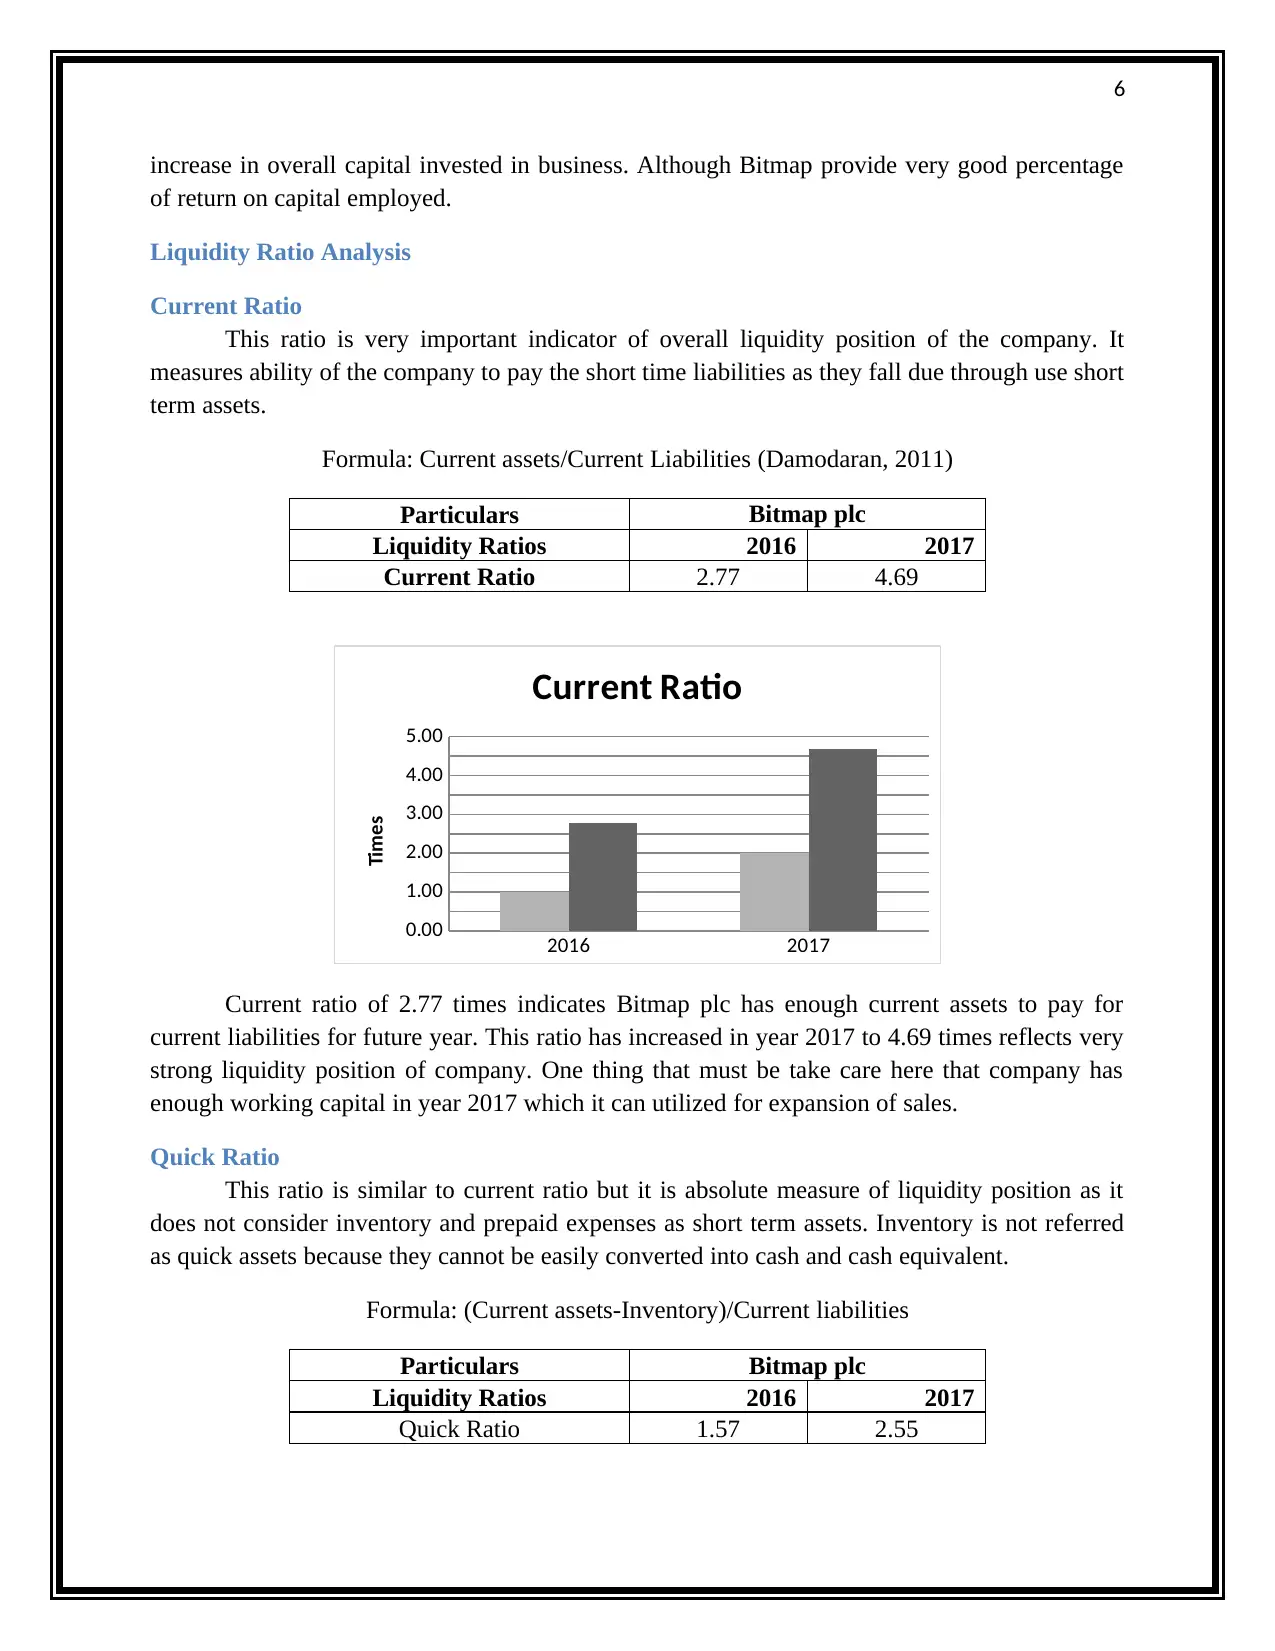
Profitability Ratio 2016 2017
Return on Capital Employed 22.36% 21.53%
2016 2017
20.00%
20.50%
21.00%
21.50%
22.00%
22.50%
23.00%
23.50%
Return on Capital Employed
Percentage
This ratio has been decreased in year 2017 as compared to year 2016 despite an increase
in net profit after tax. The main reason behind decrease in capital employed ratio was due to
Profitability Ratio 2016 2017
Gross Profit 50.56% 53.04%
2016 2017
49.00%
49.50%
50.00%
50.50%
51.00%
51.50%
52.00%
52.50%
53.00%
53.50%
Gross Profit Ratio
Percentage
Above bar graph reflects the gross profit percentage earned by Bitmap Plc during years
2016 and 2017. Through analyzing the above graph it can be said that there had been increasing
trend in gross profit ratio.
Return on Capital Employed
Return on capital employed is important for management point of view as it reflects the
percentage of profit earned on the total capital invested. Capital investment includes equity share
capital, retained earnings and non-current liabilities.
Formula: Net Profit after tax/ (Total assets-Current liabilities)
Particulars Bitmap plc
Profitability Ratio 2016 2017
Return on Capital Employed 22.36% 21.53%
2016 2017
20.00%
20.50%
21.00%
21.50%
22.00%
22.50%
23.00%
23.50%
Return on Capital Employed
Percentage
This ratio has been decreased in year 2017 as compared to year 2016 despite an increase
in net profit after tax. The main reason behind decrease in capital employed ratio was due to
6
increase in overall capital invested in business. Although Bitmap provide very good percentage
of return on capital employed.
Liquidity Ratio Analysis
Current Ratio
This ratio is very important indicator of overall liquidity position of the company. It
measures ability of the company to pay the short time liabilities as they fall due through use short
term assets.
Formula: Current assets/Current Liabilities (Damodaran, 2011)
Particulars Bitmap plc
Liquidity Ratios 2016 2017
Current Ratio 2.77 4.69
2016 2017
0.00
1.00
2.00
3.00
4.00
5.00
Current Ratio
Times
Current ratio of 2.77 times indicates Bitmap plc has enough current assets to pay for
current liabilities for future year. This ratio has increased in year 2017 to 4.69 times reflects very
strong liquidity position of company. One thing that must be take care here that company has
enough working capital in year 2017 which it can utilized for expansion of sales.
Quick Ratio
This ratio is similar to current ratio but it is absolute measure of liquidity position as it
does not consider inventory and prepaid expenses as short term assets. Inventory is not referred
as quick assets because they cannot be easily converted into cash and cash equivalent.
Formula: (Current assets-Inventory)/Current liabilities
Particulars Bitmap plc
Liquidity Ratios 2016 2017
Quick Ratio 1.57 2.55
⊘ This is a preview!⊘
Do you want full access?
Subscribe today to unlock all pages.
Trusted by 1+ million students worldwide

7
2016 2017
0.00
0.50
1.00
1.50
2.00
2.50
3.00
Quick Ratio
Times
Bitmap Plc has quick ratio of 1.57 times in year 2016 and 2.55 in year 2017 that indicates
company has enough short term assets other inventory to pay for current liabilities.
Gearing Ratio Analysis
Debt to equity ratio
Debt to equity ratio is the most important capital structure ratio as it reflects the
proportion of debt over the equity.
Formula: Long term liabilities/Shareholders Equity (Davies and Crawford, 2011)
Particulars Bitmap plc
Gearing Ratio 2016 2017
Debt to Equity Ratio 29.17% 29.19%
2016 2017
29.15%
29.16%
29.17%
29.18%
29.19%
Debt to Equity Ratio
Percentage
Bitmap Plc uses more than 29% of debt capital over the equity capital which balance
capital structure of Bitmap Plc. Company uses balanced nature of capital structure in both the
years under consideration.
2016 2017
0.00
0.50
1.00
1.50
2.00
2.50
3.00
Quick Ratio
Times
Bitmap Plc has quick ratio of 1.57 times in year 2016 and 2.55 in year 2017 that indicates
company has enough short term assets other inventory to pay for current liabilities.
Gearing Ratio Analysis
Debt to equity ratio
Debt to equity ratio is the most important capital structure ratio as it reflects the
proportion of debt over the equity.
Formula: Long term liabilities/Shareholders Equity (Davies and Crawford, 2011)
Particulars Bitmap plc
Gearing Ratio 2016 2017
Debt to Equity Ratio 29.17% 29.19%
2016 2017
29.15%
29.16%
29.17%
29.18%
29.19%
Debt to Equity Ratio
Percentage
Bitmap Plc uses more than 29% of debt capital over the equity capital which balance
capital structure of Bitmap Plc. Company uses balanced nature of capital structure in both the
years under consideration.
Paraphrase This Document
Need a fresh take? Get an instant paraphrase of this document with our AI Paraphraser

8
Asset utilization ratio analysis
Inventory Turnover Ratio in days
This ratio measures the efficiency of management to make use of inventory for earning
maximum sales revenue. It reflects number of days required by company to dispose average
inventory in the market.
Formula: Average Inventory *365 /Cost of goods sold
Particulars Bitmap plc
Asset utilization 2016 2017
Inventory Turnover Ratio in
days 73.82 70.30
2016 2017
68.00
69.00
70.00
71.00
72.00
73.00
74.00
75.00
Inventory Turnover Ratio
In Days
Bitmap Plc requires 74 days in year 2016 to convert inventory into cost of goods sold and
it has been improved as in year 2017 company requires 70days dispose of average inventory
during the year.
Asset Turnover ratio
This ratio measures the management efficiency to utilize the assets to earn the sales
revenue.
Formula: Sales revenue/Average total assets (Krantz, 2016)
Particulars Bitmap plc
Asset utilization 2016 2017
Asset Turnover ratio 1.16 1.13

9
2016 2017
1.11
1.12
1.13
1.14
1.15
1.16
1.17
Asset turnover ratio
Times
From the above graph it can be concluded that management at Bitmap Plc has been able
to earn 1.16 times of sales in year 2016 and 1.13 times in year 2017 through use of total assets. It
can be said that there is need to improve the efficiency through utilizing more assets to earn the
sales.
Investor’s potential analysis
Dividend per share
It refers to amount of earning that is received by investors in form of dividend for
investing in company’s share.
Formula: Total dividend paid/Number of shares
Particulars Bitmap plc
Investors potential 2016 2017
Dividend Per share
£
0.02
£
0.03
2016 2017
£-
£0.01
£0.02
£0.03
£0.04
Dividend Per Share
In Pound
2016 2017
1.11
1.12
1.13
1.14
1.15
1.16
1.17
Asset turnover ratio
Times
From the above graph it can be concluded that management at Bitmap Plc has been able
to earn 1.16 times of sales in year 2016 and 1.13 times in year 2017 through use of total assets. It
can be said that there is need to improve the efficiency through utilizing more assets to earn the
sales.
Investor’s potential analysis
Dividend per share
It refers to amount of earning that is received by investors in form of dividend for
investing in company’s share.
Formula: Total dividend paid/Number of shares
Particulars Bitmap plc
Investors potential 2016 2017
Dividend Per share
£
0.02
£
0.03
2016 2017
£-
£0.01
£0.02
£0.03
£0.04
Dividend Per Share
In Pound
⊘ This is a preview!⊘
Do you want full access?
Subscribe today to unlock all pages.
Trusted by 1+ million students worldwide

10
Dividend per share has been very low as compared to earnings per share earned by
Bitmap in the respective years. However dividend per share has increased in current year that
reflects growth of the company in terms of revenue and profit.
Earnings per share
This ratio measures amount of earnings per share earned by company after bearing all the
expenses including preference dividend.
Formula: Net profit available for equity shareholder’s /Number of shares (Moles and Kidwekk,
2011)
Particulars Bitmap plc
Market Ratio 2016 2017
Earnings per share
£
0.32
£
0.41
2016 2017
£-
£0.05
£0.10
£0.15
£0.20
£0.25
£0.30
£0.35
£0.40
£0.45
Earning Per Share
In Pounds
Earnings per share of Bitmap Plc have improved from £0.32 in year 2016 to £0.41 in year
2017 reflecting an improved profitability performance in year 2017.
Conclusion
Overall financial performance of Bitmap Plc has been improved in year 2017 as
compared to year 2016 but it is recommended to the management of company to pay more
attention to asset management policies of the company.
Part A.2: Working capital cycle of Bitmap plc
Working capital cycle is also known as operating cycle (Cash cycle) of a company and it
is used to measure the average time required to turn the inventory into cash. It means working
capital cycle will provide information on how much time company takes to complete one
complete cycle of business process. It includes purchasing of inventory, inventory sell time,
collection of money from customers and again using the earned cash into purchase of inventory.
Paraphrase This Document
Need a fresh take? Get an instant paraphrase of this document with our AI Paraphraser

11
Formula to calculate the working capital cycle period is as follows:
Days inventory outstanding (DIO) + Days sales outstanding (DSO) – Days payable
outstanding (DPO)
Bitmap plc
Financial Item 2016 2017
Amount in £000
Opening Inventory £ 1,700.00 £ 1,800.00
Closing Inventory £ 1,800.00 £ 2,360.00
Average inventory £ 1,750.00 £ 2,080.00
Cost of goods sold £ 8,900.00 £ 10,800.00
Opening Account Receivable £ 1,600.00 £ 1,600.00
Closing Account Receivable £ 1,600.00 £ 2,300.00
Average Account Receivable £ 1,600.00 £ 1,950.00
Credit Sales (All Sales) £ 18,000.00 £ 23,000.00
Opening Account Payable £ 1,500.00 £ 1,500.00
Closing Account Payable £ 1,500.00 £ 1,100.00
Average Account Payable £ 1,500.00 £ 1,300.00
Bitmap plc
Working Capital Cycle in days
Ratios Formula 2016 2017
Days inventory outstanding
(DIO)
Average Inventory *365 /Cost
of goods sold 71.77 70.30
Days sales outstanding (DSO)
Average account Receivable
*365 /Net Credit Sales 32.44 30.95
Days payable outstanding (DPO)
Average accounts
payable*365/Cost of goods
sold 61.52 43.94
Working Capital Cycle In days 42.70 57.31
(Phillips, P.P. and Stawarski, 2016)
As per above calculation of working capital cycle of Bitmap Plc it can be said that asset
management policy at Bitmap Plc was not efficient as company has taken 43 days to convert
inventory into cash in year 2016 and 57 days in year 2017. It means company has taken more
days to convert inventory into cash. In year 2017, company has paid more early to suppliers as in
year 2016 which indicates company requires more cash for working capital purpose. It is advised
to company to strictly follow its asset management policies.

12
Part B: Capital budgeting and managing finance
Part B.1: Application of capital budgeting investment appraisal techniques to the given
scenario
Given Data
Years Particulars Project A Project B
Machine A Machine B
Year 0 Initial Investment -£ 500,000.00 -£ 500,000.00
Year 1 Cash Inflow £ 300,000.00 £ 20,000.00
Year 2 Cash Inflow £ 250,000.00 £ 50,000.00
Year 3 Cash Inflow £ 200,000.00 £ 150,000.00
Year 4 Cash Inflow £ 150,000.00 £ 200,000.00
Year 5 Cash Inflow £ 50,000.00 £ 250,000.00
Year 6 Cash Inflow £ 20,000.00 £ 300,000.00
Year 6 Residual Value £ 50,000.00 £ 50,000.00
Method 1 Payback Method
For Even cash inflows For Uneven Cash Inflows
Initial Investment A+ B/C
Cash Inflow per Period
Where:
A is the last period with a negative cumulative cash flow;
B is the absolute value of cumulative cash flow at the end of the period A;
C is the total cash flow during the period after A
(Reilly and Brown, 2011)
Cumulative Cash Flows of Machine A
Years Machine A Cumulative
Year 0 -£ 500,000.00 -£ 500,000.00
Year 1 £ 300,000.00 -£ 200,000.00
Year 2 £ 250,000.00 £ 50,000.00
Year 3 £ 200,000.00 £ 250,000.00
Year 4 £ 150,000.00 £ 400,000.00
Year 5 £ 50,000.00 £ 450,000.00
Year 6 £ 20,000.00 £ 470,000.00
Cumulative Cash Flows of Machine B
Years Machine B Cumulative
Year 0 -£ 500,000.00 -£ 500,000.00
Year 1 £ 20,000.00 -£ 480,000.00
⊘ This is a preview!⊘
Do you want full access?
Subscribe today to unlock all pages.
Trusted by 1+ million students worldwide
1 out of 23
Related Documents


Your All-in-One AI-Powered Toolkit for Academic Success.
+13062052269
info@desklib.com
Available 24*7 on WhatsApp / Email
![[object Object]](/_next/static/media/star-bottom.7253800d.svg)
Unlock your academic potential
Copyright © 2020–2026 A2Z Services. All Rights Reserved. Developed and managed by ZUCOL.