Accounting Homework: Accrual Accounting and Ratio Analysis
VerifiedAdded on 2020/04/21
|11
|2132
|495
Homework Assignment
AI Summary
This accounting assignment delves into the principles of accrual accounting and financial statement analysis. It includes solutions to problems related to prepaid insurance, outstanding bills, and depreciation, demonstrating how these elements are reflected in the balance sheet, profit and loss statement, and cash flow statement. The assignment also provides a comprehensive interpretation of financial ratios, including profitability, liquidity, efficiency, leverage, and shareholder return, based on data from 2011 and 2012. Furthermore, it explores the importance of ratio analysis in evaluating business performance, providing insights into the strengths and weaknesses of a sample company, highlighting trends in sales, return on investment, and the potential impact on future revenue generation.

Running head: ACCOUNTING
Accounting
Name of the Student:
Name of the University:
Authors Note:
Accounting
Name of the Student:
Name of the University:
Authors Note:
Paraphrase This Document
Need a fresh take? Get an instant paraphrase of this document with our AI Paraphraser
1ACCOUNTING
Table of Contents
Accrual Accounting:..................................................................................................................2
P4.10...........................................................................................................................................2
Statement of Comprehensive Income........................................................................................3
P 4.12..........................................................................................................................................3
Interpretation of Financial Statement and Ratio........................................................................3
P 5.6............................................................................................................................................3
Interpretation of ratios................................................................................................................6
P5.12...........................................................................................................................................6
Reference....................................................................................................................................8
2ACCOUNTING
Accrual Accounting:
P4.10
Answer to Question A:
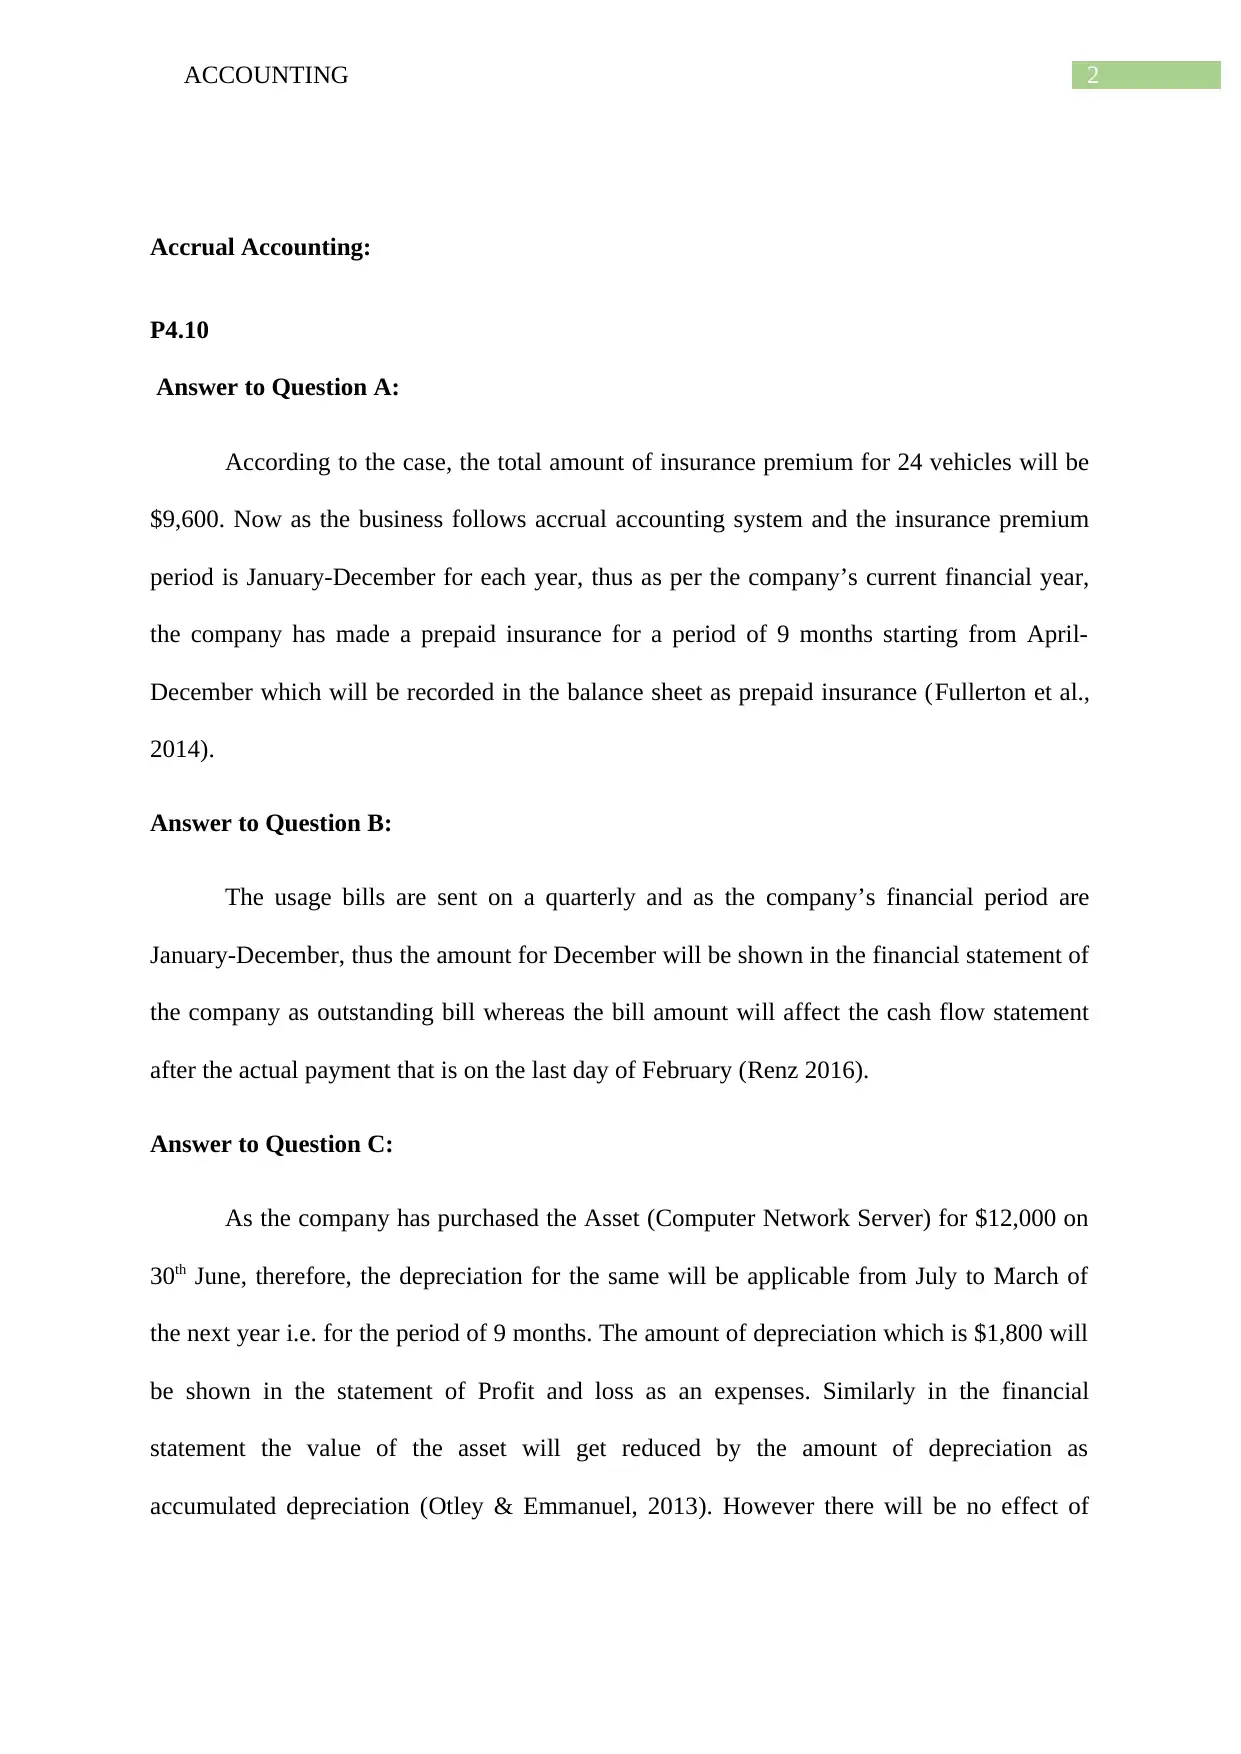
According to the case, the total amount of insurance premium for 24 vehicles will be
$9,600. Now as the business follows accrual accounting system and the insurance premium
period is January-December for each year, thus as per the company’s current financial year,
the company has made a prepaid insurance for a period of 9 months starting from April-
December which will be recorded in the balance sheet as prepaid insurance (Fullerton et al.,
2014).
Answer to Question B:
The usage bills are sent on a quarterly and as the company’s financial period are
January-December, thus the amount for December will be shown in the financial statement of
the company as outstanding bill whereas the bill amount will affect the cash flow statement
after the actual payment that is on the last day of February (Renz 2016).
Answer to Question C:
As the company has purchased the Asset (Computer Network Server) for $12,000 on
30th June, therefore, the depreciation for the same will be applicable from July to March of
the next year i.e. for the period of 9 months. The amount of depreciation which is $1,800 will
be shown in the statement of Profit and loss as an expenses. Similarly in the financial
statement the value of the asset will get reduced by the amount of depreciation as
accumulated depreciation (Otley & Emmanuel, 2013). However there will be no effect of
Accrual Accounting:
P4.10
Answer to Question A:
According to the case, the total amount of insurance premium for 24 vehicles will be
$9,600. Now as the business follows accrual accounting system and the insurance premium
period is January-December for each year, thus as per the company’s current financial year,
the company has made a prepaid insurance for a period of 9 months starting from April-
December which will be recorded in the balance sheet as prepaid insurance (Fullerton et al.,
2014).
Answer to Question B:
The usage bills are sent on a quarterly and as the company’s financial period are
January-December, thus the amount for December will be shown in the financial statement of
the company as outstanding bill whereas the bill amount will affect the cash flow statement
after the actual payment that is on the last day of February (Renz 2016).
Answer to Question C:
As the company has purchased the Asset (Computer Network Server) for $12,000 on
30th June, therefore, the depreciation for the same will be applicable from July to March of
the next year i.e. for the period of 9 months. The amount of depreciation which is $1,800 will
be shown in the statement of Profit and loss as an expenses. Similarly in the financial
statement the value of the asset will get reduced by the amount of depreciation as
accumulated depreciation (Otley & Emmanuel, 2013). However there will be no effect of
⊘ This is a preview!⊘
Do you want full access?
Subscribe today to unlock all pages.
Trusted by 1+ million students worldwide
3ACCOUNTING
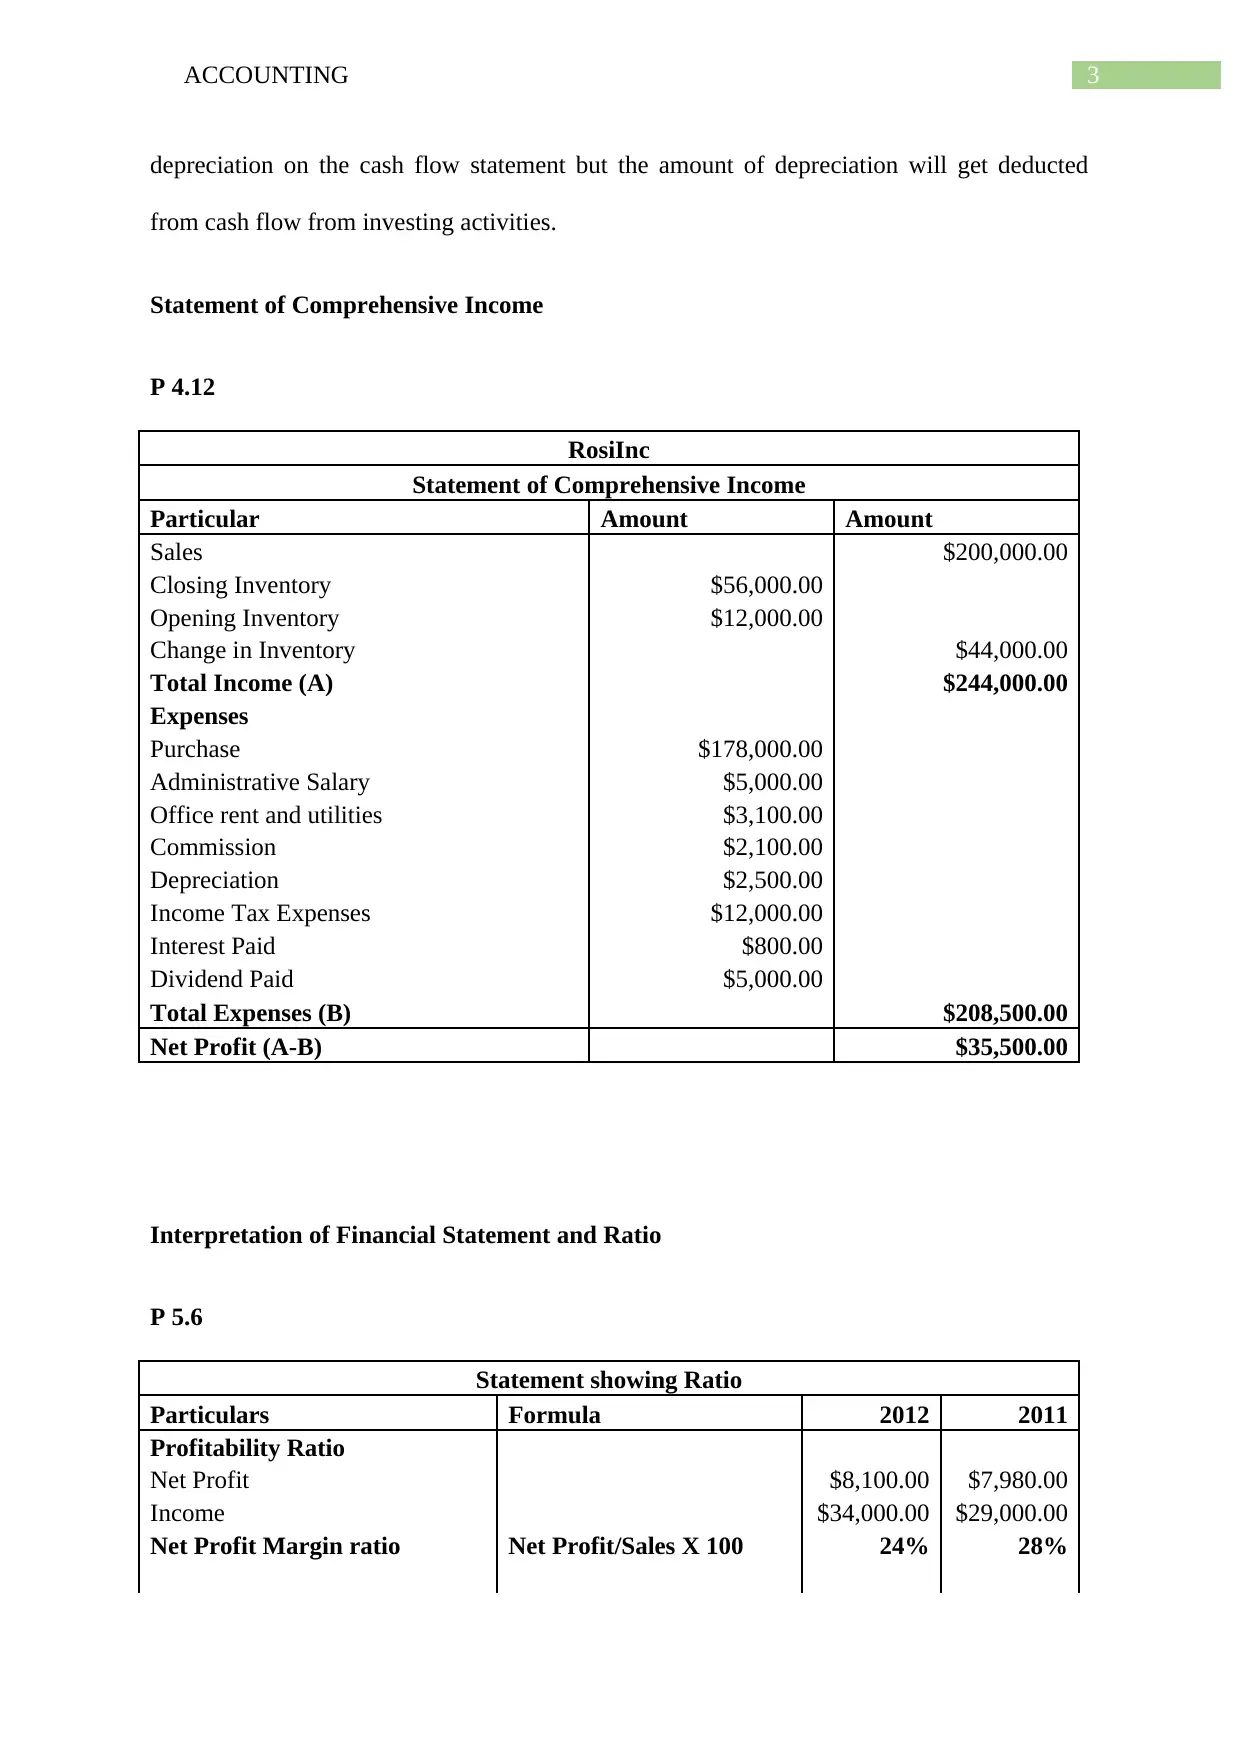
depreciation on the cash flow statement but the amount of depreciation will get deducted
from cash flow from investing activities.
Statement of Comprehensive Income
P 4.12
RosiInc
Statement of Comprehensive Income
Particular Amount Amount
Sales $200,000.00
Closing Inventory $56,000.00
Opening Inventory $12,000.00
Change in Inventory $44,000.00
Total Income (A) $244,000.00
Expenses
Purchase $178,000.00
Administrative Salary $5,000.00
Office rent and utilities $3,100.00
Commission $2,100.00
Depreciation $2,500.00
Income Tax Expenses $12,000.00
Interest Paid $800.00
Dividend Paid $5,000.00
Total Expenses (B) $208,500.00
Net Profit (A-B) $35,500.00
Interpretation of Financial Statement and Ratio
P 5.6
Statement showing Ratio
Particulars Formula 2012 2011
Profitability Ratio
Net Profit $8,100.00 $7,980.00
Income $34,000.00 $29,000.00
Net Profit Margin ratio Net Profit/Sales X 100 24% 28%
Paraphrase This Document
Need a fresh take? Get an instant paraphrase of this document with our AI Paraphraser
4ACCOUNTING
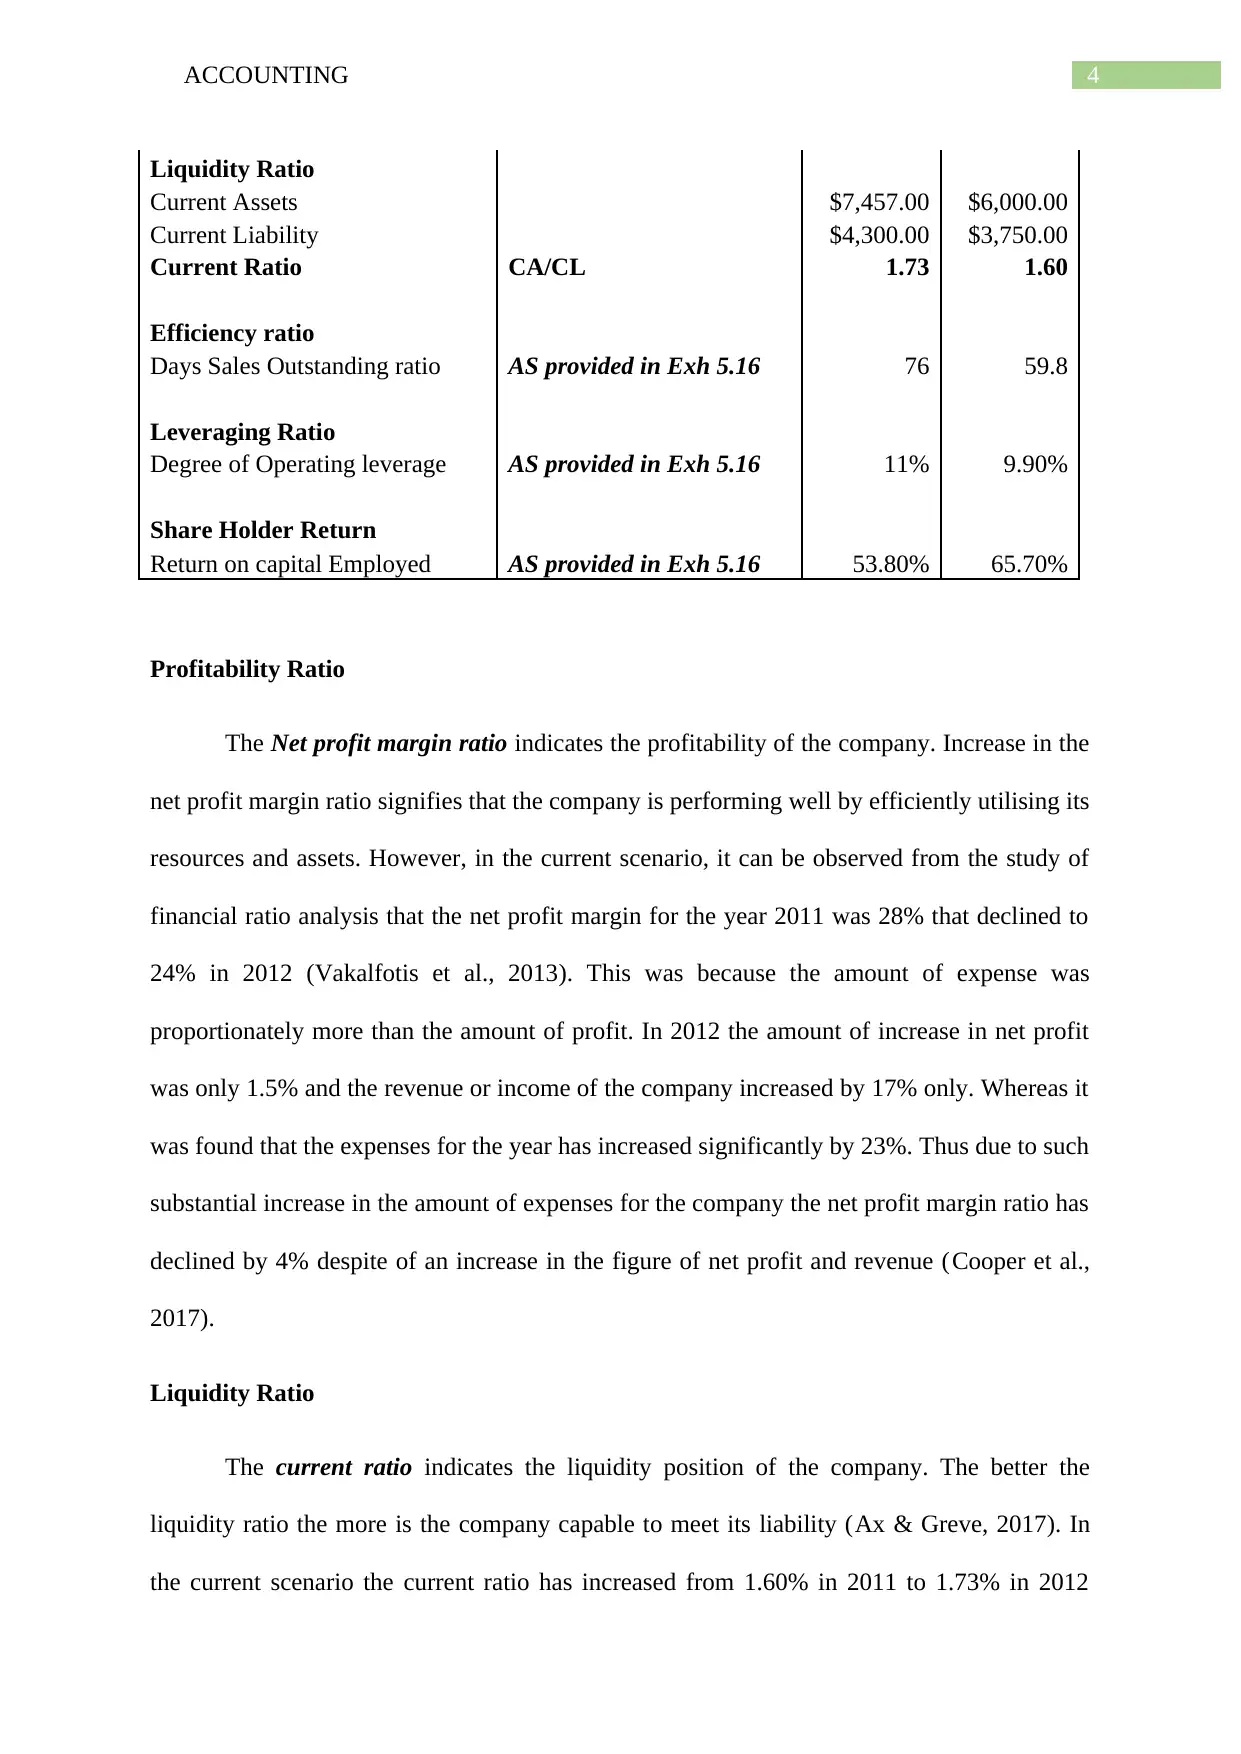
Liquidity Ratio
Current Assets $7,457.00 $6,000.00
Current Liability $4,300.00 $3,750.00
Current Ratio CA/CL 1.73 1.60
Efficiency ratio
Days Sales Outstanding ratio AS provided in Exh 5.16 76 59.8
Leveraging Ratio
Degree of Operating leverage AS provided in Exh 5.16 11% 9.90%
Share Holder Return
Return on capital Employed AS provided in Exh 5.16 53.80% 65.70%
Profitability Ratio
The Net profit margin ratio indicates the profitability of the company. Increase in the
net profit margin ratio signifies that the company is performing well by efficiently utilising its
resources and assets. However, in the current scenario, it can be observed from the study of
financial ratio analysis that the net profit margin for the year 2011 was 28% that declined to
24% in 2012 (Vakalfotis et al., 2013). This was because the amount of expense was
proportionately more than the amount of profit. In 2012 the amount of increase in net profit
was only 1.5% and the revenue or income of the company increased by 17% only. Whereas it
was found that the expenses for the year has increased significantly by 23%. Thus due to such
substantial increase in the amount of expenses for the company the net profit margin ratio has
declined by 4% despite of an increase in the figure of net profit and revenue (Cooper et al.,
2017).
Liquidity Ratio
The current ratio indicates the liquidity position of the company. The better the
liquidity ratio the more is the company capable to meet its liability (Ax & Greve, 2017). In
the current scenario the current ratio has increased from 1.60% in 2011 to 1.73% in 2012
Liquidity Ratio
Current Assets $7,457.00 $6,000.00
Current Liability $4,300.00 $3,750.00
Current Ratio CA/CL 1.73 1.60
Efficiency ratio
Days Sales Outstanding ratio AS provided in Exh 5.16 76 59.8
Leveraging Ratio
Degree of Operating leverage AS provided in Exh 5.16 11% 9.90%
Share Holder Return
Return on capital Employed AS provided in Exh 5.16 53.80% 65.70%
Profitability Ratio
The Net profit margin ratio indicates the profitability of the company. Increase in the
net profit margin ratio signifies that the company is performing well by efficiently utilising its
resources and assets. However, in the current scenario, it can be observed from the study of
financial ratio analysis that the net profit margin for the year 2011 was 28% that declined to
24% in 2012 (Vakalfotis et al., 2013). This was because the amount of expense was
proportionately more than the amount of profit. In 2012 the amount of increase in net profit
was only 1.5% and the revenue or income of the company increased by 17% only. Whereas it
was found that the expenses for the year has increased significantly by 23%. Thus due to such
substantial increase in the amount of expenses for the company the net profit margin ratio has
declined by 4% despite of an increase in the figure of net profit and revenue (Cooper et al.,
2017).
Liquidity Ratio
The current ratio indicates the liquidity position of the company. The better the
liquidity ratio the more is the company capable to meet its liability (Ax & Greve, 2017). In
the current scenario the current ratio has increased from 1.60% in 2011 to 1.73% in 2012
5ACCOUNTING
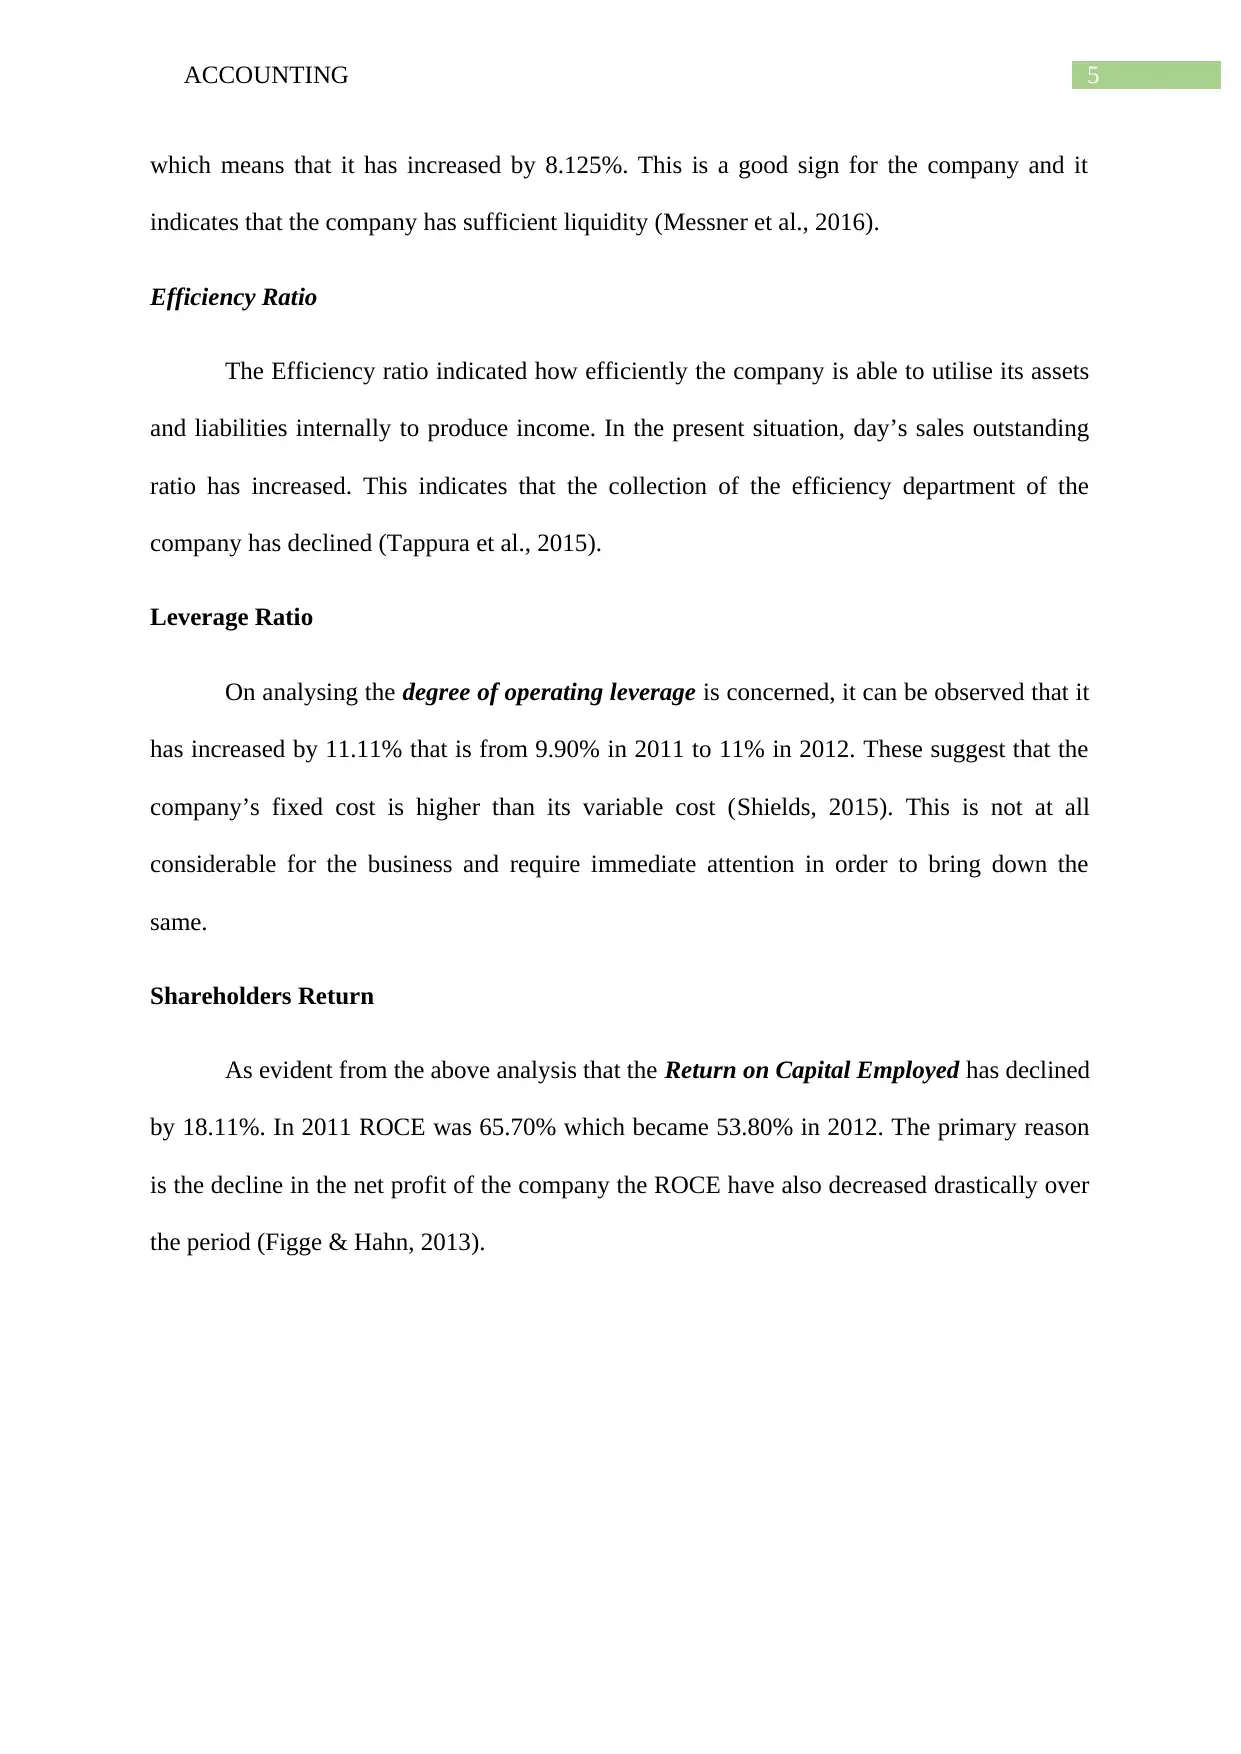
which means that it has increased by 8.125%. This is a good sign for the company and it
indicates that the company has sufficient liquidity (Messner et al., 2016).
Efficiency Ratio
The Efficiency ratio indicated how efficiently the company is able to utilise its assets
and liabilities internally to produce income. In the present situation, day’s sales outstanding
ratio has increased. This indicates that the collection of the efficiency department of the
company has declined (Tappura et al., 2015).
Leverage Ratio
On analysing the degree of operating leverage is concerned, it can be observed that it
has increased by 11.11% that is from 9.90% in 2011 to 11% in 2012. These suggest that the
company’s fixed cost is higher than its variable cost (Shields, 2015). This is not at all
considerable for the business and require immediate attention in order to bring down the
same.
Shareholders Return
As evident from the above analysis that the Return on Capital Employed has declined
by 18.11%. In 2011 ROCE was 65.70% which became 53.80% in 2012. The primary reason
is the decline in the net profit of the company the ROCE have also decreased drastically over
the period (Figge & Hahn, 2013).
⊘ This is a preview!⊘
Do you want full access?
Subscribe today to unlock all pages.
Trusted by 1+ million students worldwide
6ACCOUNTING
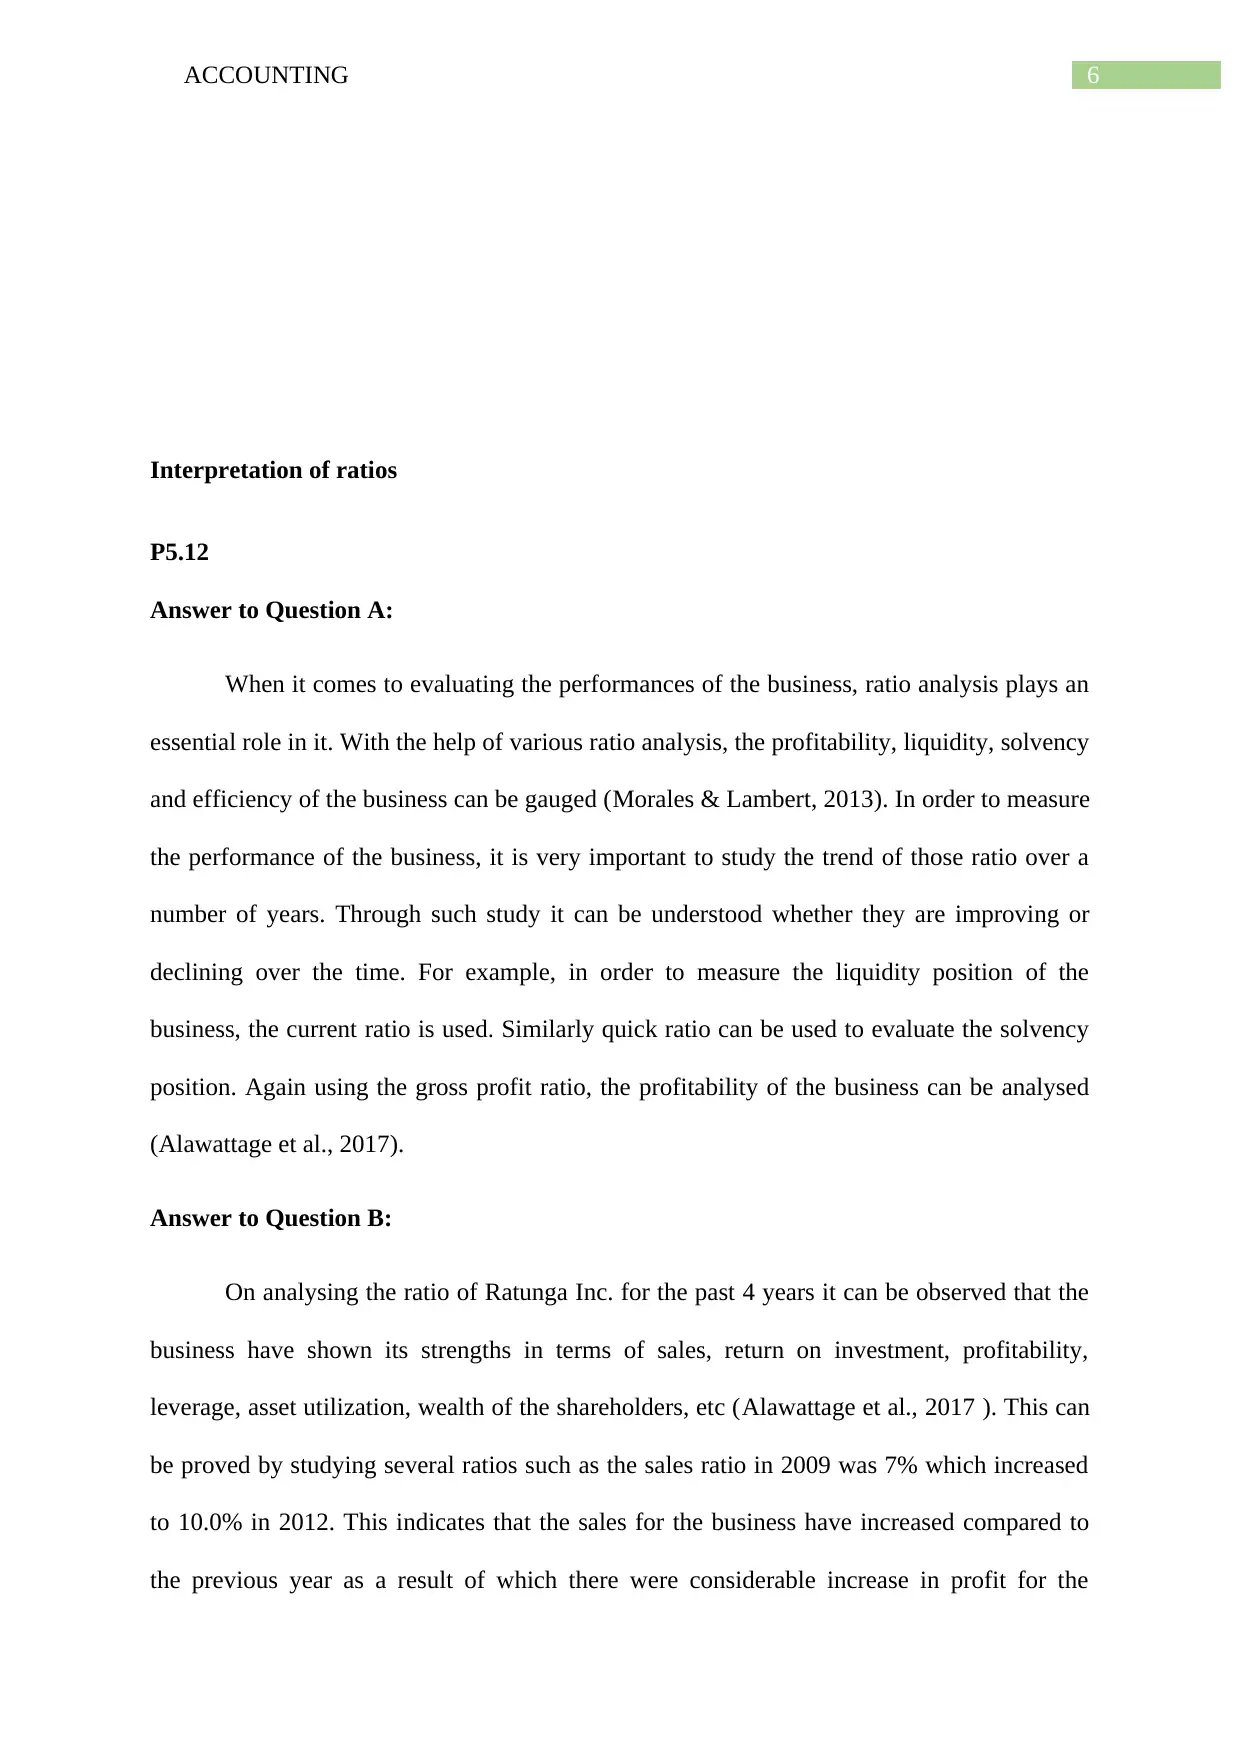
Interpretation of ratios
P5.12
Answer to Question A:
When it comes to evaluating the performances of the business, ratio analysis plays an
essential role in it. With the help of various ratio analysis, the profitability, liquidity, solvency
and efficiency of the business can be gauged (Morales & Lambert, 2013). In order to measure
the performance of the business, it is very important to study the trend of those ratio over a
number of years. Through such study it can be understood whether they are improving or
declining over the time. For example, in order to measure the liquidity position of the
business, the current ratio is used. Similarly quick ratio can be used to evaluate the solvency
position. Again using the gross profit ratio, the profitability of the business can be analysed
(Alawattage et al., 2017).
Answer to Question B:
On analysing the ratio of Ratunga Inc. for the past 4 years it can be observed that the
business have shown its strengths in terms of sales, return on investment, profitability,
leverage, asset utilization, wealth of the shareholders, etc (Alawattage et al., 2017 ). This can
be proved by studying several ratios such as the sales ratio in 2009 was 7% which increased
to 10.0% in 2012. This indicates that the sales for the business have increased compared to
the previous year as a result of which there were considerable increase in profit for the
Paraphrase This Document
Need a fresh take? Get an instant paraphrase of this document with our AI Paraphraser
7ACCOUNTING
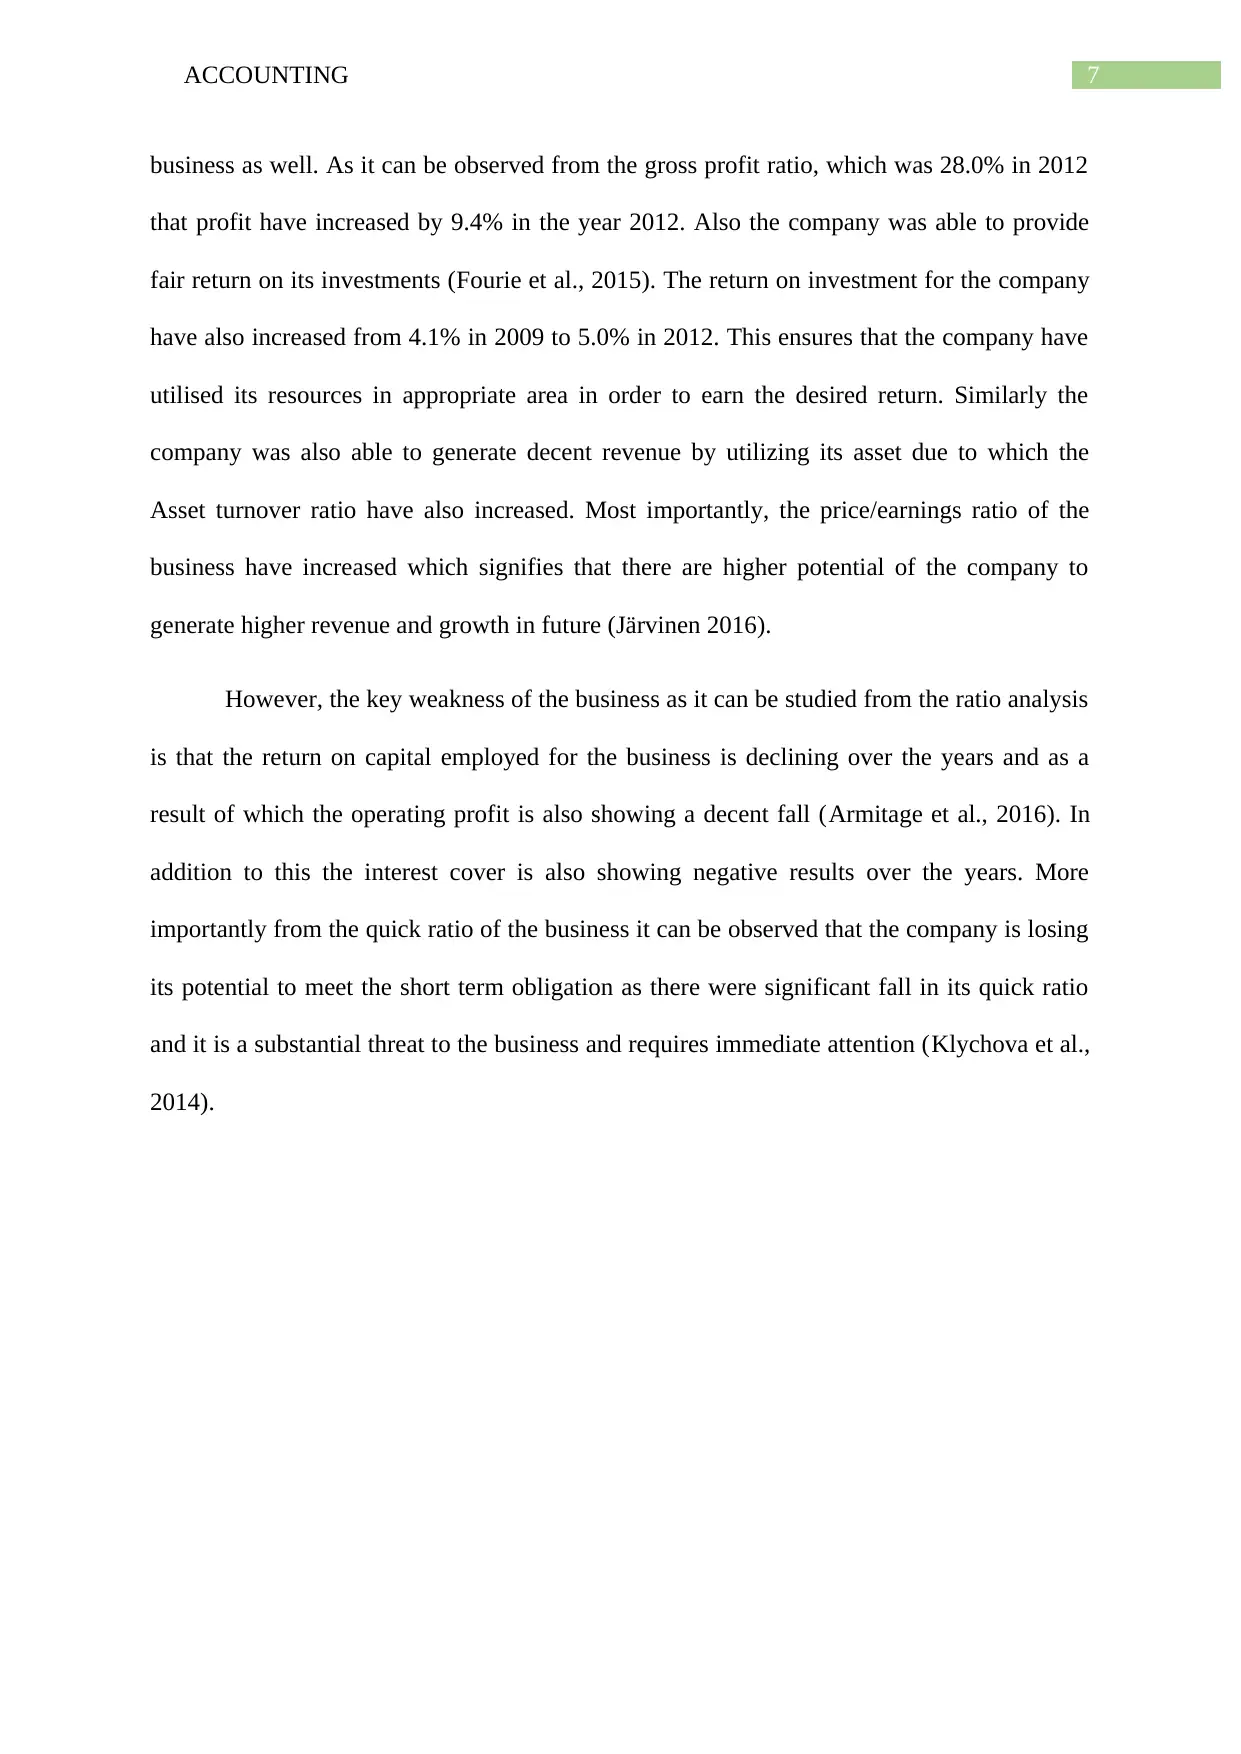
business as well. As it can be observed from the gross profit ratio, which was 28.0% in 2012
that profit have increased by 9.4% in the year 2012. Also the company was able to provide
fair return on its investments (Fourie et al., 2015). The return on investment for the company
have also increased from 4.1% in 2009 to 5.0% in 2012. This ensures that the company have
utilised its resources in appropriate area in order to earn the desired return. Similarly the
company was also able to generate decent revenue by utilizing its asset due to which the
Asset turnover ratio have also increased. Most importantly, the price/earnings ratio of the
business have increased which signifies that there are higher potential of the company to
generate higher revenue and growth in future (Järvinen 2016).
However, the key weakness of the business as it can be studied from the ratio analysis
is that the return on capital employed for the business is declining over the years and as a
result of which the operating profit is also showing a decent fall (Armitage et al., 2016). In
addition to this the interest cover is also showing negative results over the years. More
importantly from the quick ratio of the business it can be observed that the company is losing
its potential to meet the short term obligation as there were significant fall in its quick ratio
and it is a substantial threat to the business and requires immediate attention (Klychova et al.,
2014).
8ACCOUNTING
Reference
Alawattage, C., Wickramasinghe, D., & Uddin, S. (2017). Theorising management
accounting practices in Less Developed Countries. The Routledge Companion to
Performance Management and Control.
Armitage, H. M., Webb, A., & Glynn, J. (2016). The Use of Management Accounting
Techniques by Small and Medium‐Sized Enterprises: A Field Study of Canadian and
Australian Practice. Accounting Perspectives, 15(1), 31-69.
Ax, C., & Greve, J. (2017). Adoption of management accounting innovations: Organizational
culture compatibility and perceived outcomes. Management Accounting Research, 34, 59-74.
Cooper, D. J., Ezzamel, M., & Qu, S. Q. (2017). Popularizing a management accounting idea:
The case of the balanced scorecard. Contemporary Accounting Research.
Figge, F., & Hahn, T. (2013). Value drivers of corporate eco-efficiency: Management
accounting information for the efficient use of environmental resources. Management
Accounting Research, 24(4), 387-400.
Fourie, M. L., Opperman, L., Scott, D., & Kumar, K. (2015). Municipal finance and
accounting. Van Schaik Publishers.
Fullerton, R. R., Kennedy, F. A., & Widener, S. K. (2014). Lean manufacturing and firm
performance: The incremental contribution of lean management accounting
practices. Journal of Operations Management, 32(7), 414-428.
Järvinen, J. T. (2016). Role of management accounting in applying new institutional logics:
A comparative case study in the non-profit sector. Accounting, Auditing & Accountability
Journal, 29(5), 861-886.
⊘ This is a preview!⊘
Do you want full access?
Subscribe today to unlock all pages.
Trusted by 1+ million students worldwide
9ACCOUNTING
Klychova, G. S., Faskhutdinova, М. S., & Sadrieva, E. R. (2014). Budget efficiency for cost
control purposes in management accounting system. Mediterranean journal of social
sciences, 5(24), 79.
Messner, M., Becker, A., Schäffer, U., & Binder, C. (2016). Struggles for legitimacy and
identity: the development of Germanic management accounting research. Research Gate, 1-
38.
Morales, J., & Lambert, C. (2013). Dirty work and the construction of identity. An
ethnographic study of management accounting practices. Accounting, Organizations and
Society, 38(3), 228-244.
Otley, D., & Emmanuel, K. M. C. (2013). Readings in accounting for management control.
Springer.
Renz, D. O. (2016). The Jossey-Bass handbook of nonprofit leadership and management.
John Wiley & Sons.
Shields, M. D. (2015). Established management accounting knowledge. Journal of
Management Accounting Research, 27(1), 123-132.
Tappura, S., Sievänen, M., Heikkilä, J., Jussila, A., & Nenonen, N. (2015). A management
accounting perspective on safety. Safety science, 71, 151-159.
Vakalfotis, N., Ballantine, J., & Wall, A. P. (2013). A literature review on the impact of
Enterprise Systems on management accounting.
Paraphrase This Document
Need a fresh take? Get an instant paraphrase of this document with our AI Paraphraser

10ACCOUNTING
1 out of 11
Related Documents


Your All-in-One AI-Powered Toolkit for Academic Success.
+13062052269
info@desklib.com
Available 24*7 on WhatsApp / Email
![[object Object]](/_next/static/media/star-bottom.7253800d.svg)
Unlock your academic potential
Copyright © 2020–2026 A2Z Services. All Rights Reserved. Developed and managed by ZUCOL.