Applied Accounting and Budgeting Project for Graduate Diploma (DAM561)
VerifiedAdded on 2023/05/29
|11
|2034
|474
Project
AI Summary
This project provides a comprehensive analysis of accounting and budgeting principles, addressing various aspects of financial management. It begins with inventory valuation using FIFO and average methods, followed by a discussion on financial statement compliance with NZ GAAP. The project then delves into flexible budgeting, variance analysis, and the calculation of the cost of capital, including WACC. Furthermore, it includes net present value calculations and explores production and material budgeting. The project utilizes financial data to demonstrate the application of these concepts, offering insights into decision-making and financial planning. Overall, the project is a detailed exploration of key accounting and budgeting topics, providing practical examples and calculations to support the understanding of financial concepts.
Running head: ACCOUNTING AND BUDGETING
Accounting and budgeting
Name of the student
Name of the university
Student ID
Author note
Accounting and budgeting
Name of the student
Name of the university
Student ID
Author note
Paraphrase This Document
Need a fresh take? Get an instant paraphrase of this document with our AI Paraphraser
1ACCOUNTING AND BUDGETING
Table of Contents
Question 1..................................................................................................................................2
a) FIFO method...................................................................................................................2
b) Average method..............................................................................................................2
Question 3..................................................................................................................................4
Question 4..................................................................................................................................5
a) Cost of each source of finnace........................................................................................5
b) Capital structure weights.................................................................................................6
Question 5..................................................................................................................................7
1. Net cash flow...................................................................................................................7
2. Net present value.............................................................................................................7
Question 6..................................................................................................................................8
a) Production budget...........................................................................................................8
b) Material budget...............................................................................................................8
Reference..................................................................................................................................10
2ACCOUNTING AND BUDGETING
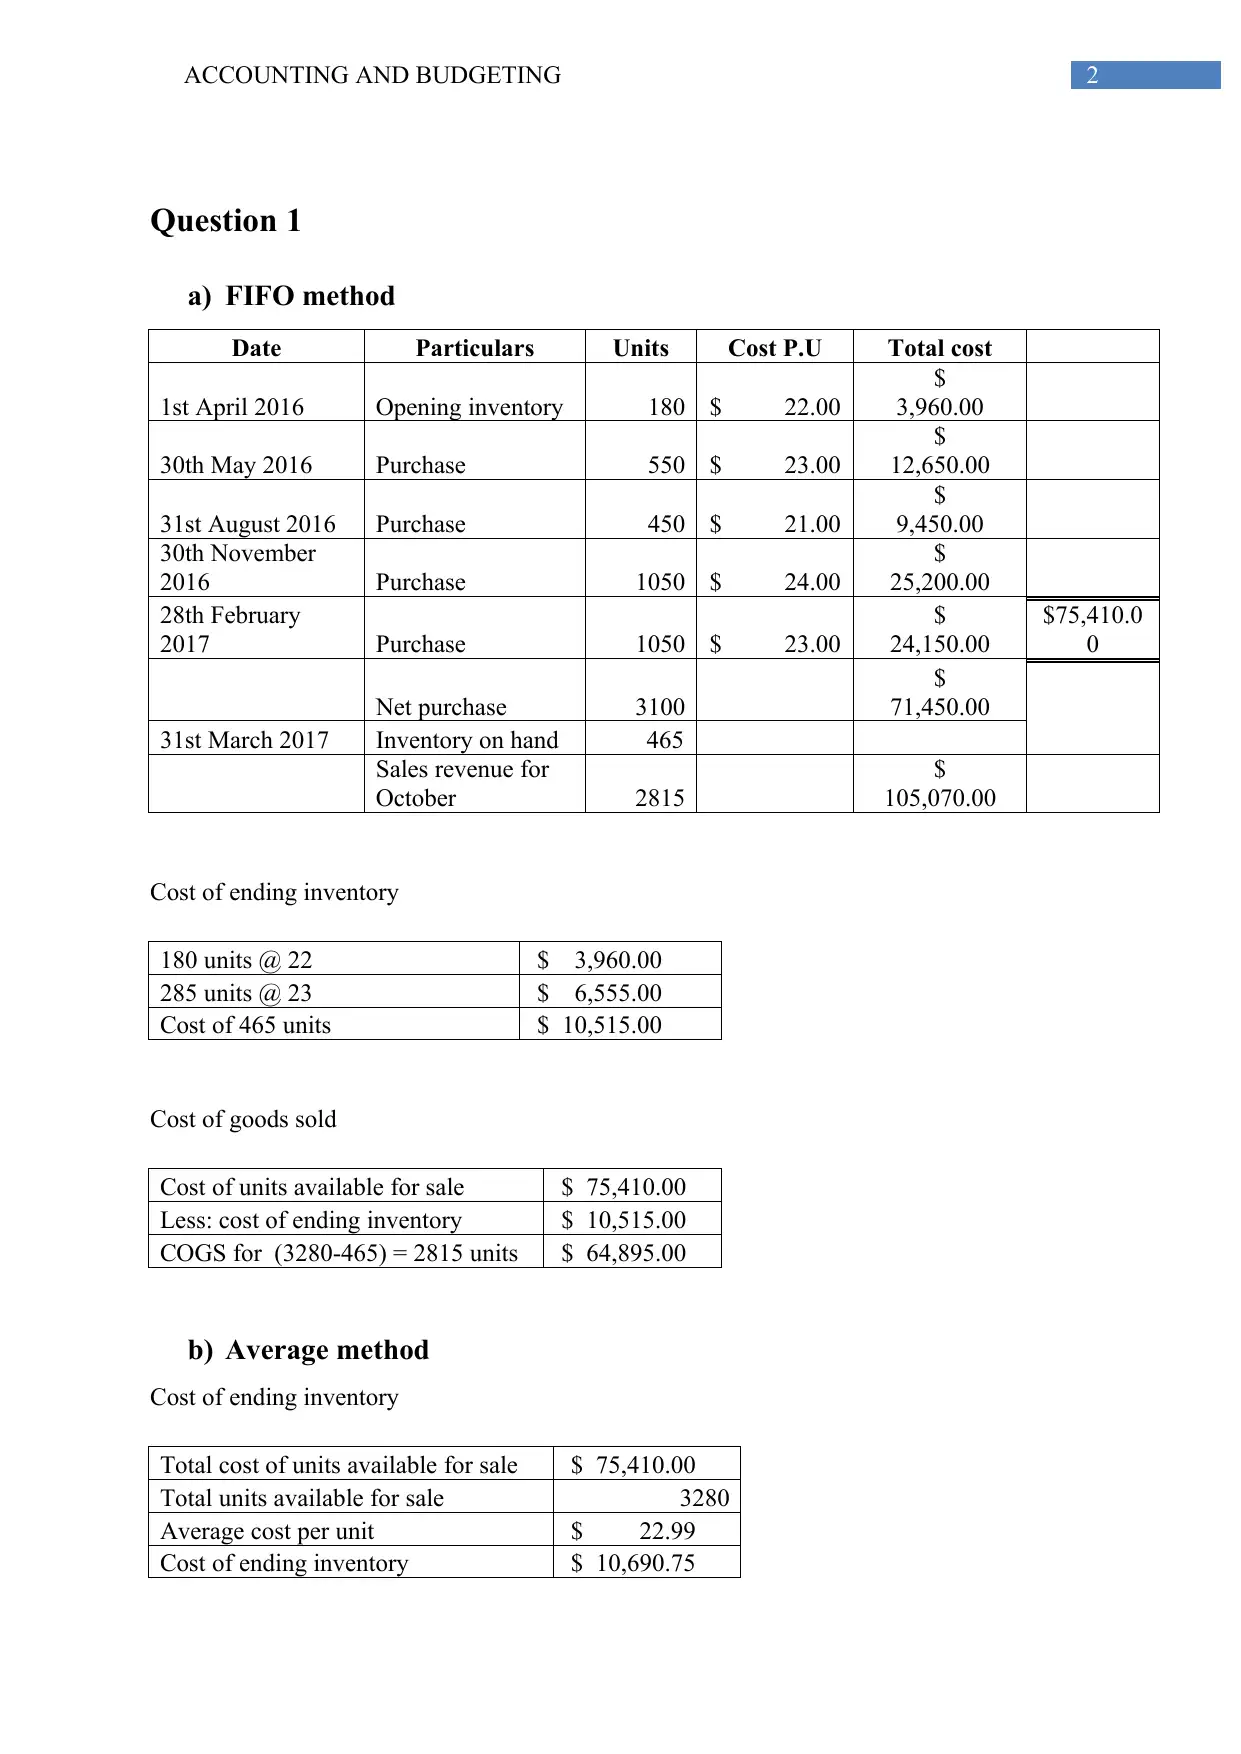
Question 1
a) FIFO method
Date Particulars Units Cost P.U Total cost
1st April 2016 Opening inventory 180 $ 22.00
$
3,960.00
30th May 2016 Purchase 550 $ 23.00
$
12,650.00
31st August 2016 Purchase 450 $ 21.00
$
9,450.00
30th November
2016 Purchase 1050 $ 24.00
$
25,200.00
28th February
2017 Purchase 1050 $ 23.00
$
24,150.00
$75,410.0
0
Net purchase 3100
$
71,450.00
31st March 2017 Inventory on hand 465
Sales revenue for
October 2815
$
105,070.00
Cost of ending inventory
180 units @ 22 $ 3,960.00
285 units @ 23 $ 6,555.00
Cost of 465 units $ 10,515.00
Cost of goods sold
Cost of units available for sale $ 75,410.00
Less: cost of ending inventory $ 10,515.00
COGS for (3280-465) = 2815 units $ 64,895.00
b) Average method
Cost of ending inventory
Total cost of units available for sale $ 75,410.00
Total units available for sale 3280
Average cost per unit $ 22.99
Cost of ending inventory $ 10,690.75
⊘ This is a preview!⊘
Do you want full access?
Subscribe today to unlock all pages.
Trusted by 1+ million students worldwide
3ACCOUNTING AND BUDGETING
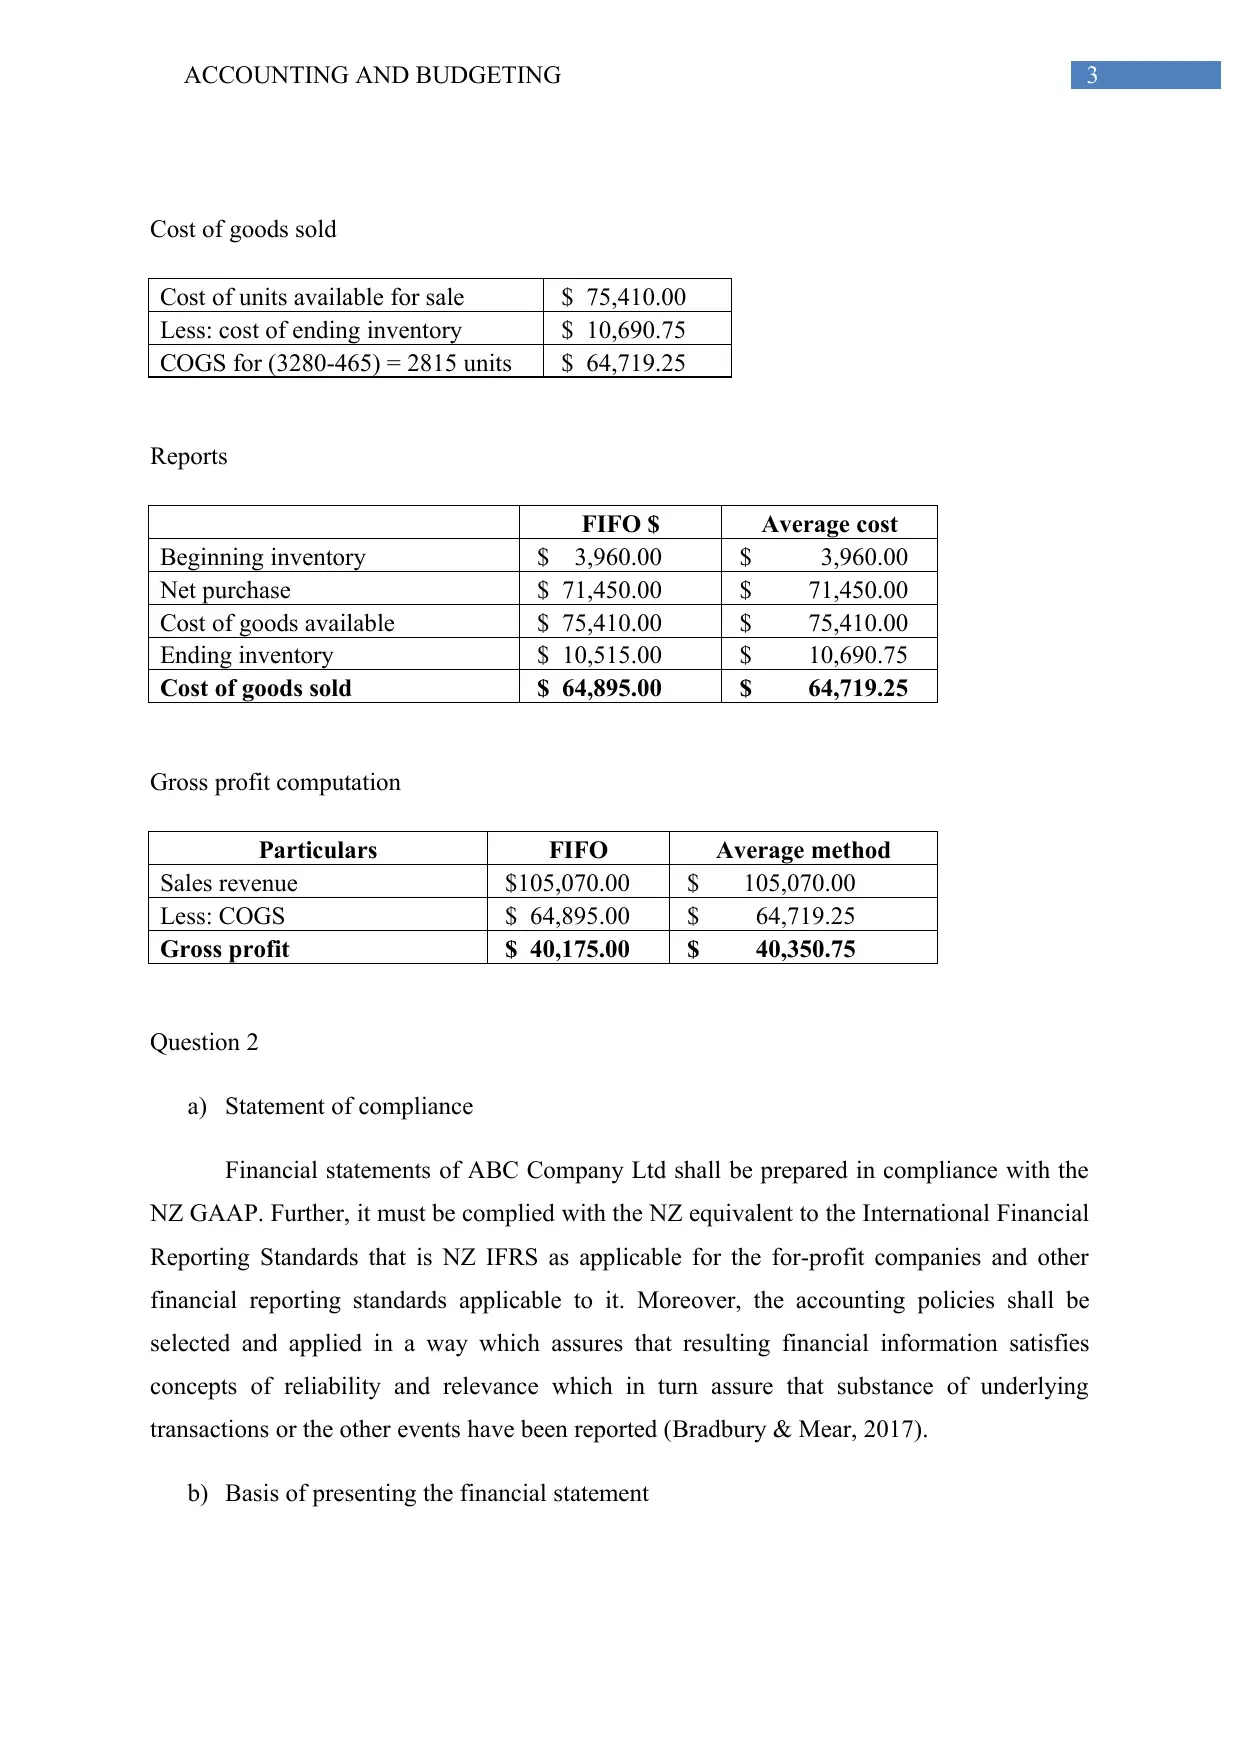
Cost of goods sold
Cost of units available for sale $ 75,410.00
Less: cost of ending inventory $ 10,690.75
COGS for (3280-465) = 2815 units $ 64,719.25
Reports
FIFO $ Average cost
Beginning inventory $ 3,960.00 $ 3,960.00
Net purchase $ 71,450.00 $ 71,450.00
Cost of goods available $ 75,410.00 $ 75,410.00
Ending inventory $ 10,515.00 $ 10,690.75
Cost of goods sold $ 64,895.00 $ 64,719.25
Gross profit computation
Particulars FIFO Average method
Sales revenue $105,070.00 $ 105,070.00
Less: COGS $ 64,895.00 $ 64,719.25
Gross profit $ 40,175.00 $ 40,350.75
Question 2
a) Statement of compliance
Financial statements of ABC Company Ltd shall be prepared in compliance with the
NZ GAAP. Further, it must be complied with the NZ equivalent to the International Financial
Reporting Standards that is NZ IFRS as applicable for the for-profit companies and other
financial reporting standards applicable to it. Moreover, the accounting policies shall be
selected and applied in a way which assures that resulting financial information satisfies
concepts of reliability and relevance which in turn assure that substance of underlying
transactions or the other events have been reported (Bradbury & Mear, 2017).
b) Basis of presenting the financial statement
Paraphrase This Document
Need a fresh take? Get an instant paraphrase of this document with our AI Paraphraser
4ACCOUNTING AND BUDGETING
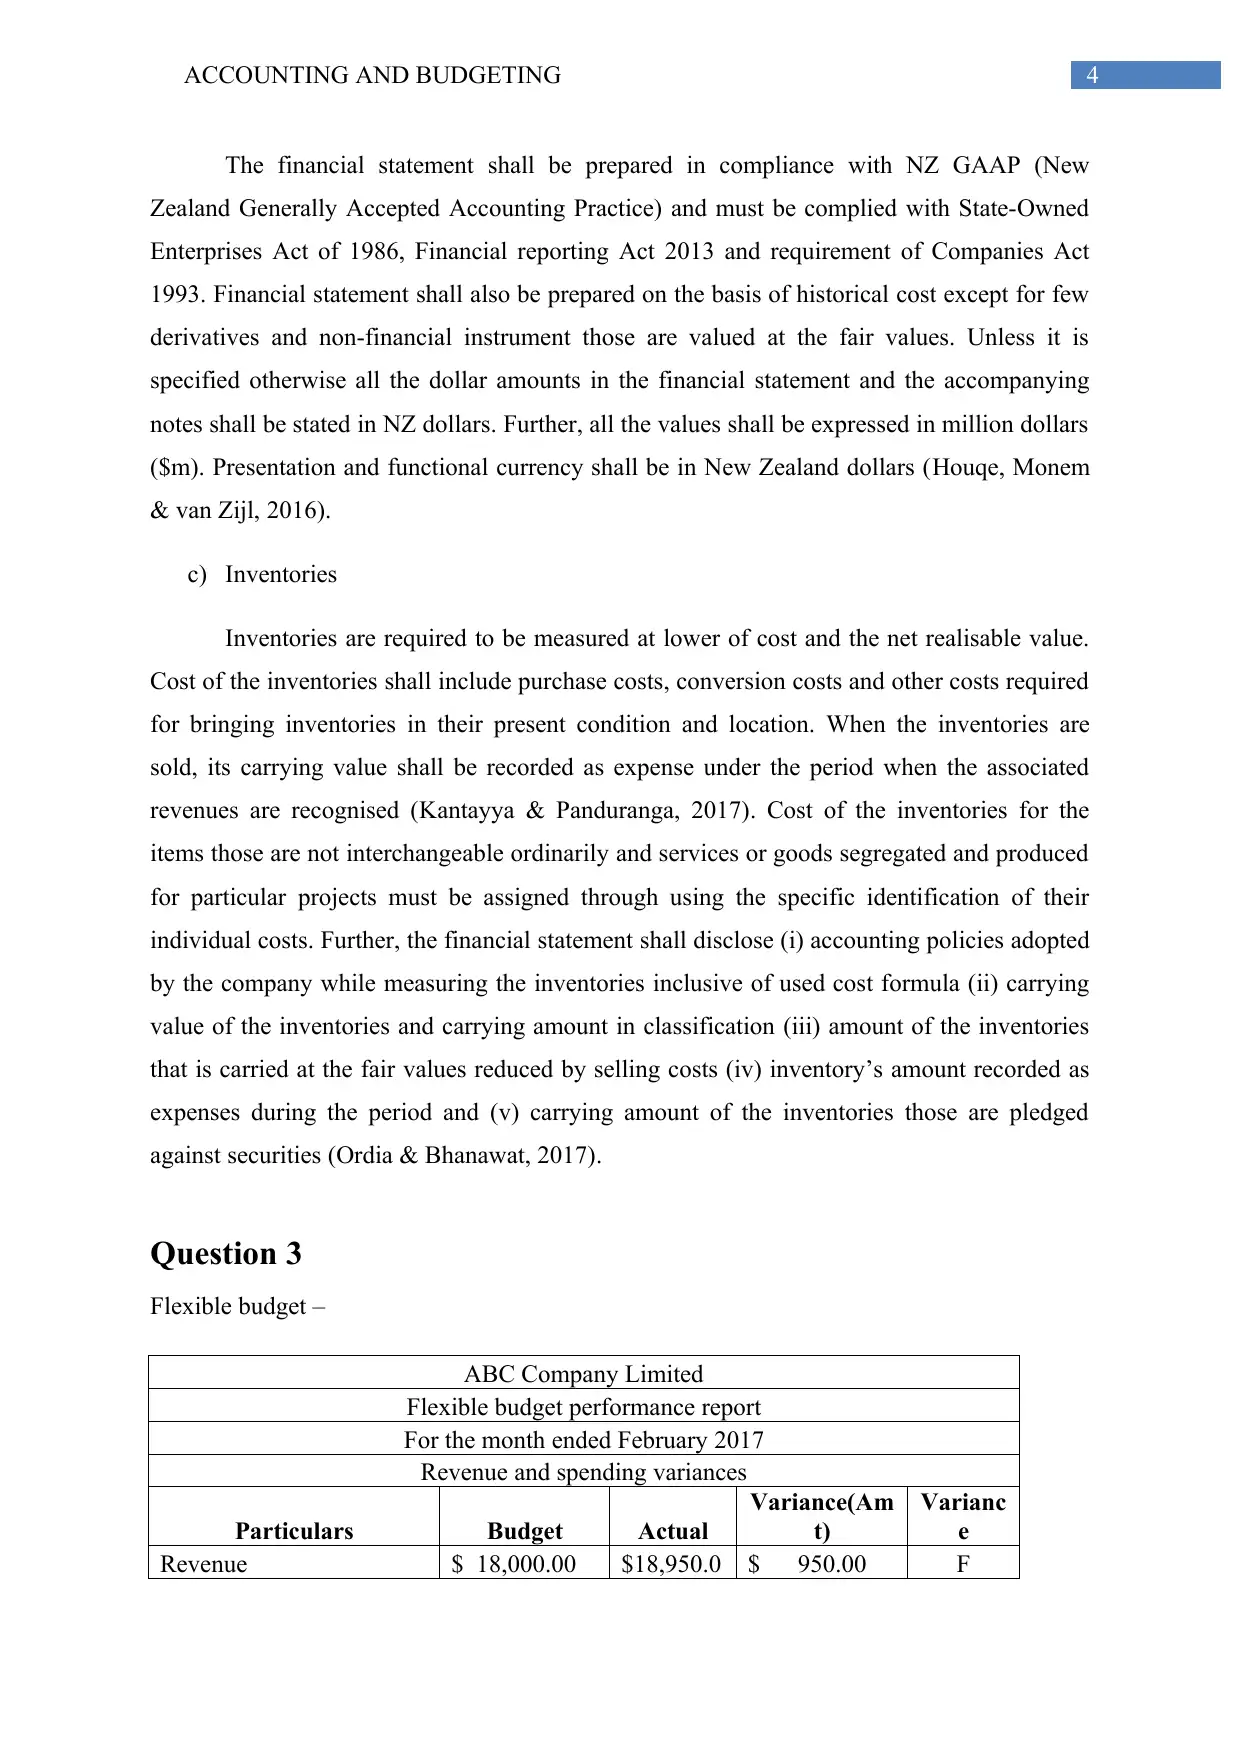
The financial statement shall be prepared in compliance with NZ GAAP (New
Zealand Generally Accepted Accounting Practice) and must be complied with State-Owned
Enterprises Act of 1986, Financial reporting Act 2013 and requirement of Companies Act
1993. Financial statement shall also be prepared on the basis of historical cost except for few
derivatives and non-financial instrument those are valued at the fair values. Unless it is
specified otherwise all the dollar amounts in the financial statement and the accompanying
notes shall be stated in NZ dollars. Further, all the values shall be expressed in million dollars
($m). Presentation and functional currency shall be in New Zealand dollars (Houqe, Monem
& van Zijl, 2016).
c) Inventories
Inventories are required to be measured at lower of cost and the net realisable value.
Cost of the inventories shall include purchase costs, conversion costs and other costs required
for bringing inventories in their present condition and location. When the inventories are
sold, its carrying value shall be recorded as expense under the period when the associated
revenues are recognised (Kantayya & Panduranga, 2017). Cost of the inventories for the
items those are not interchangeable ordinarily and services or goods segregated and produced
for particular projects must be assigned through using the specific identification of their
individual costs. Further, the financial statement shall disclose (i) accounting policies adopted
by the company while measuring the inventories inclusive of used cost formula (ii) carrying
value of the inventories and carrying amount in classification (iii) amount of the inventories
that is carried at the fair values reduced by selling costs (iv) inventory’s amount recorded as
expenses during the period and (v) carrying amount of the inventories those are pledged
against securities (Ordia & Bhanawat, 2017).
Question 3
Flexible budget –
ABC Company Limited
Flexible budget performance report
For the month ended February 2017
Revenue and spending variances
Particulars Budget Actual
Variance(Am
t)
Varianc
e
Revenue $ 18,000.00 $18,950.0 $ 950.00 F
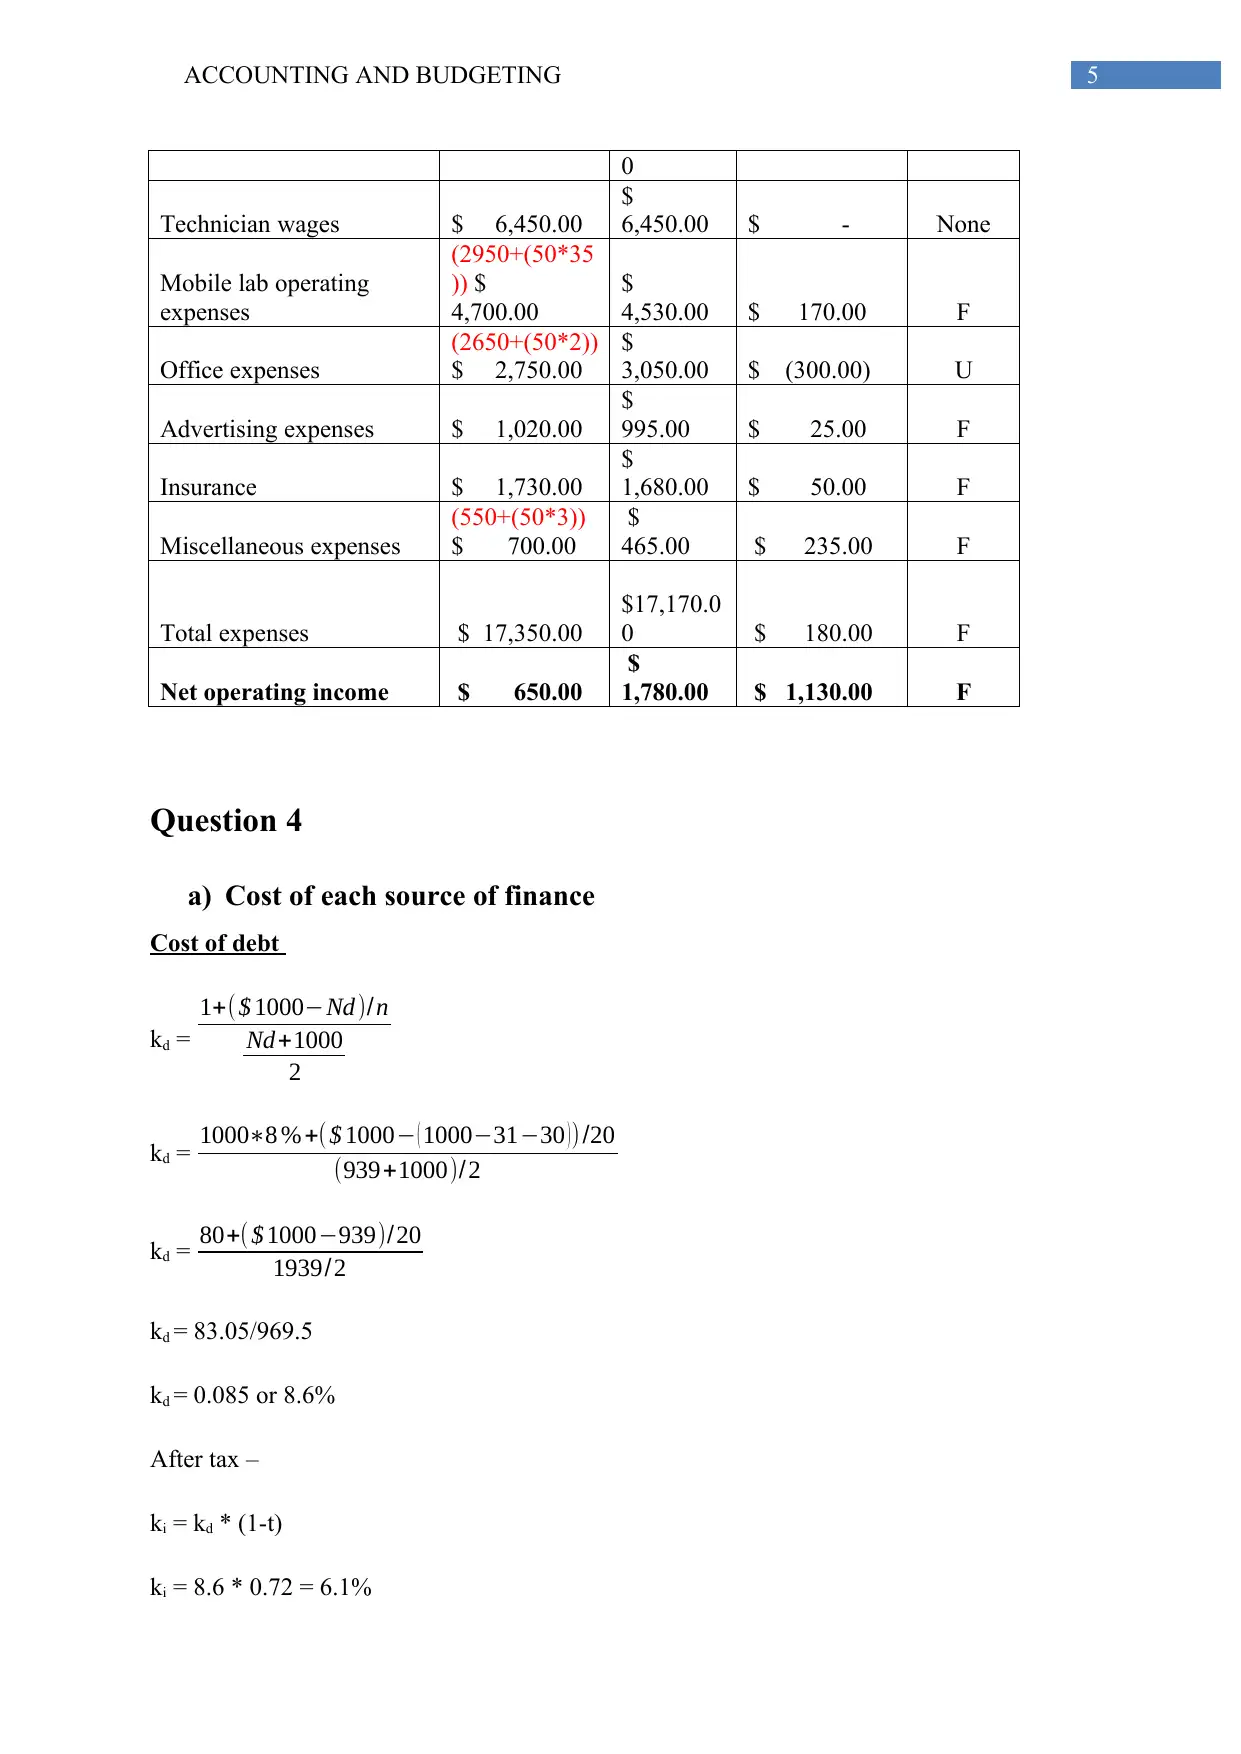
5ACCOUNTING AND BUDGETING
0
Technician wages $ 6,450.00
$
6,450.00 $ - None
Mobile lab operating
expenses
(2950+(50*35
)) $
4,700.00
$
4,530.00 $ 170.00 F
Office expenses
(2650+(50*2))
$ 2,750.00
$
3,050.00 $ (300.00) U
Advertising expenses $ 1,020.00
$
995.00 $ 25.00 F
Insurance $ 1,730.00
$
1,680.00 $ 50.00 F
Miscellaneous expenses
(550+(50*3))
$ 700.00
$
465.00 $ 235.00 F
Total expenses $ 17,350.00
$17,170.0
0 $ 180.00 F
Net operating income $ 650.00
$
1,780.00 $ 1,130.00 F
Question 4
a) Cost of each source of finance
Cost of debt
kd =
1+($ 1000−Nd)/n
Nd+1000
2
kd = 1000∗8 % +( $ 1000− ( 1000−31−30 )) /20
(939+1000)/2
kd = 80+( $ 1000−939)/20
1939/2
kd = 83.05/969.5
kd = 0.085 or 8.6%
After tax –
ki = kd * (1-t)
ki = 8.6 * 0.72 = 6.1%
⊘ This is a preview!⊘
Do you want full access?
Subscribe today to unlock all pages.
Trusted by 1+ million students worldwide
6ACCOUNTING AND BUDGETING
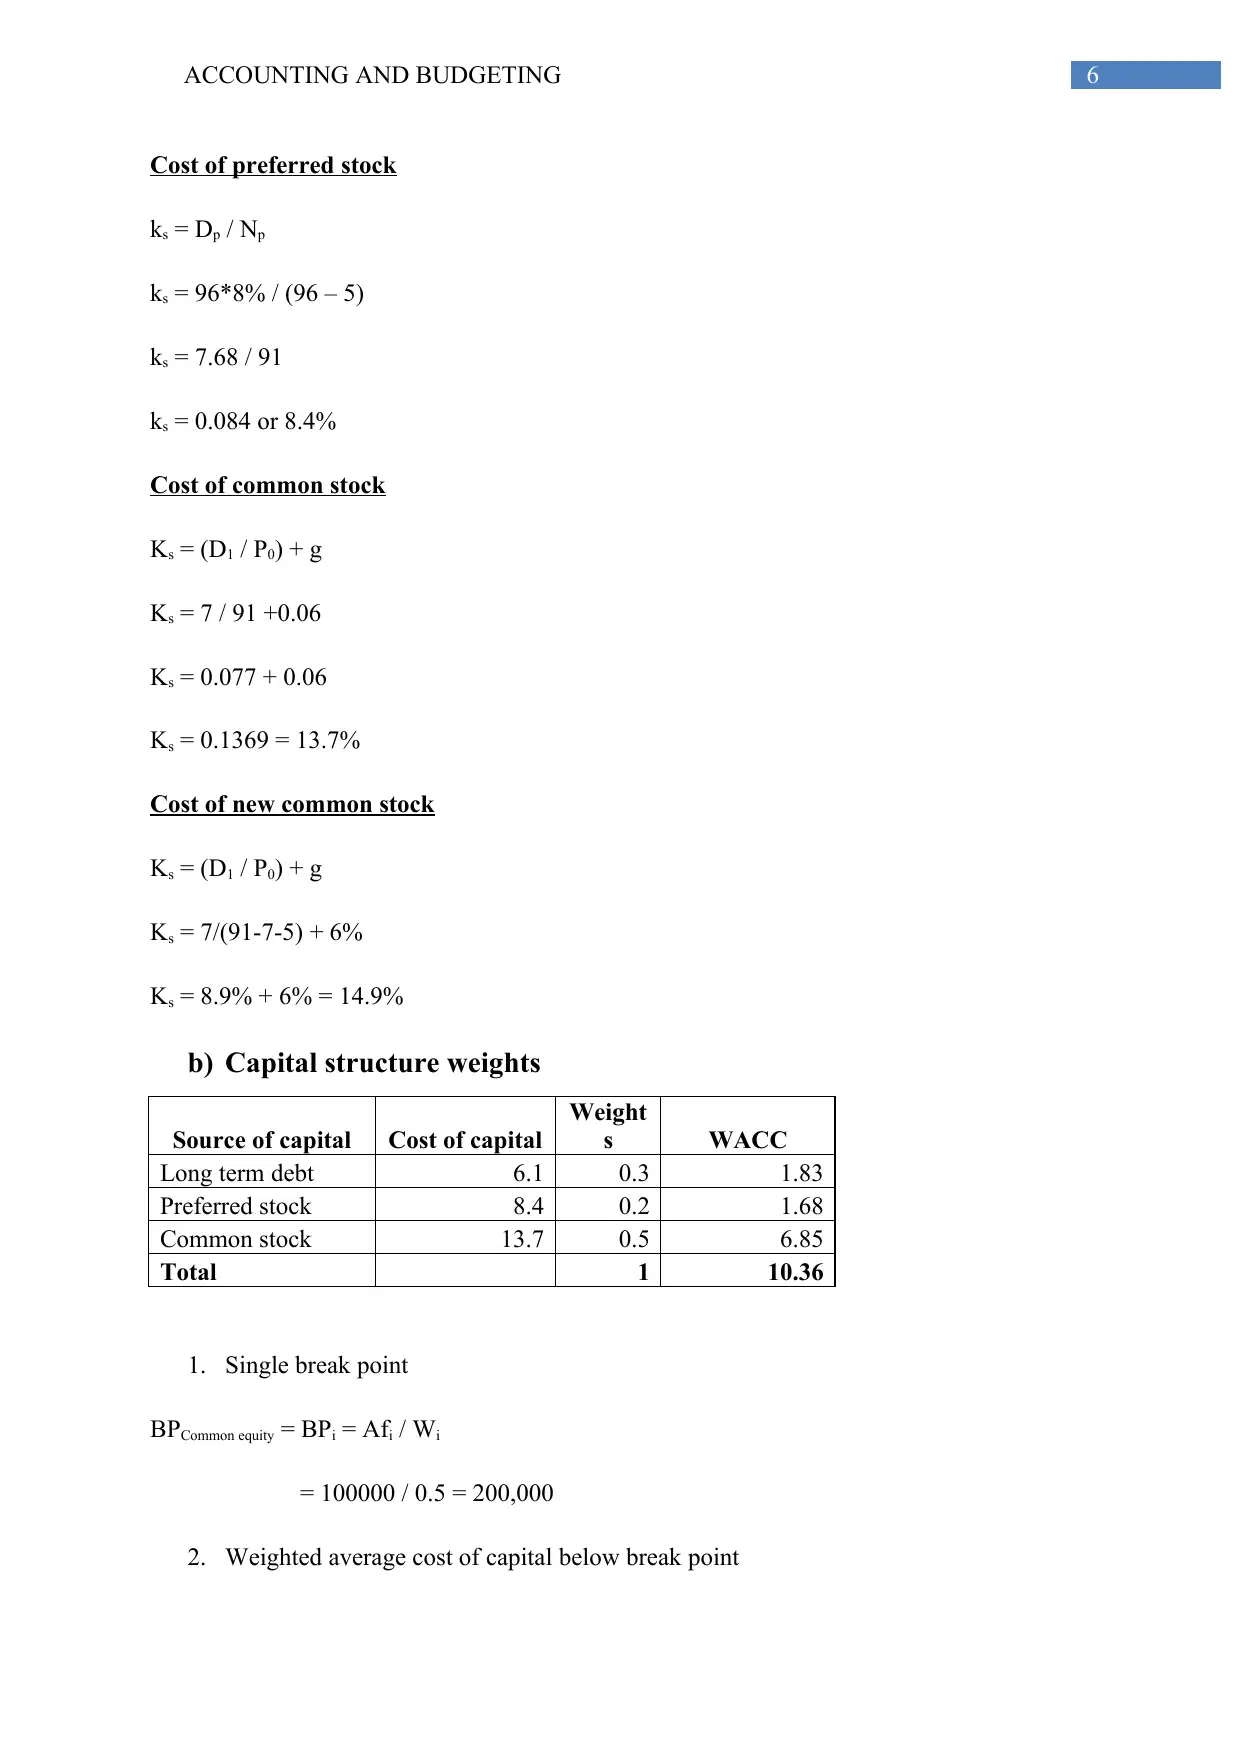
Cost of preferred stock
ks = Dp / Np
ks = 96*8% / (96 – 5)
ks = 7.68 / 91
ks = 0.084 or 8.4%
Cost of common stock
Ks = (D1 / P0) + g
Ks = 7 / 91 +0.06
Ks = 0.077 + 0.06
Ks = 0.1369 = 13.7%
Cost of new common stock
Ks = (D1 / P0) + g
Ks = 7/(91-7-5) + 6%
Ks = 8.9% + 6% = 14.9%
b) Capital structure weights
Source of capital Cost of capital
Weight
s WACC
Long term debt 6.1 0.3 1.83
Preferred stock 8.4 0.2 1.68
Common stock 13.7 0.5 6.85
Total 1 10.36
1. Single break point
BPCommon equity = BPi = Afi / Wi
= 100000 / 0.5 = 200,000
2. Weighted average cost of capital below break point
Paraphrase This Document
Need a fresh take? Get an instant paraphrase of this document with our AI Paraphraser
7ACCOUNTING AND BUDGETING
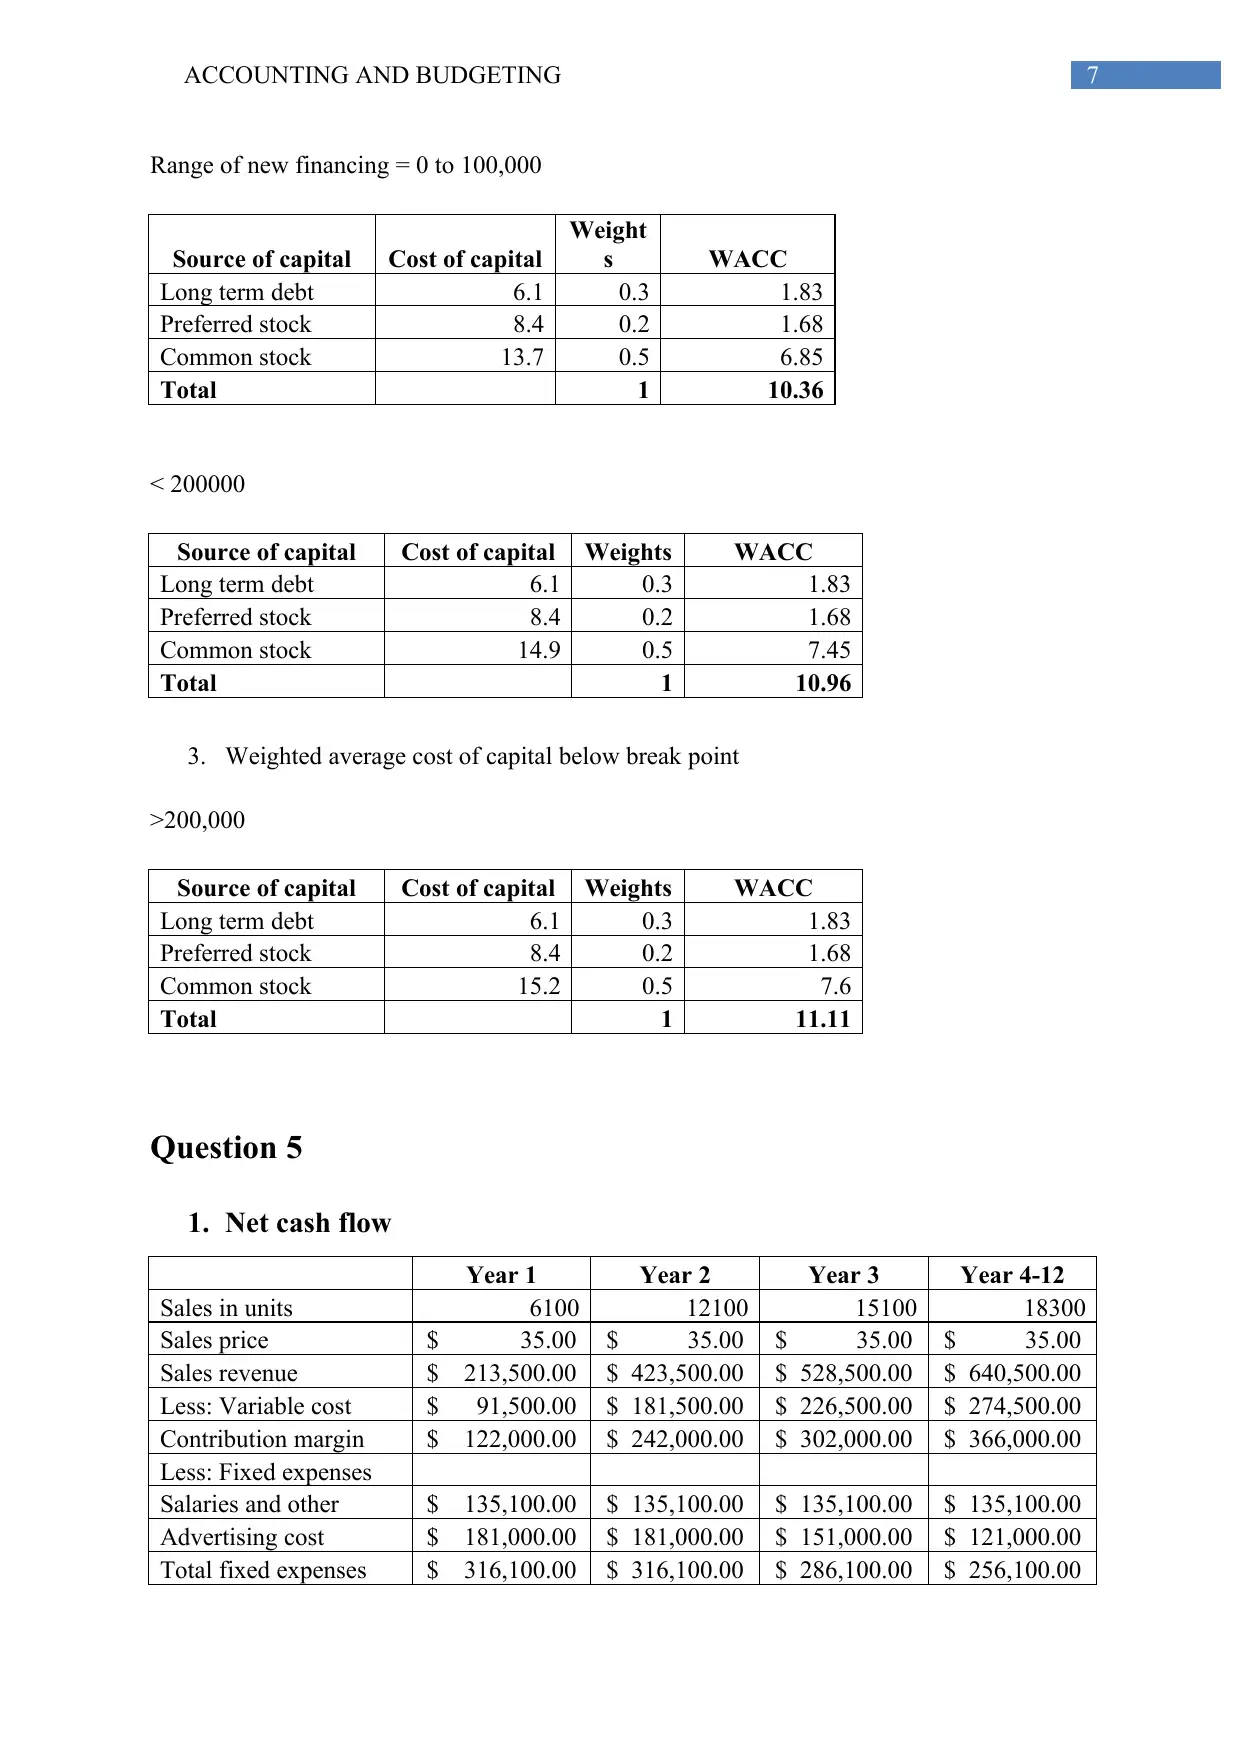
Range of new financing = 0 to 100,000
Source of capital Cost of capital
Weight
s WACC
Long term debt 6.1 0.3 1.83
Preferred stock 8.4 0.2 1.68
Common stock 13.7 0.5 6.85
Total 1 10.36
< 200000
Source of capital Cost of capital Weights WACC
Long term debt 6.1 0.3 1.83
Preferred stock 8.4 0.2 1.68
Common stock 14.9 0.5 7.45
Total 1 10.96
3. Weighted average cost of capital below break point
>200,000
Source of capital Cost of capital Weights WACC
Long term debt 6.1 0.3 1.83
Preferred stock 8.4 0.2 1.68
Common stock 15.2 0.5 7.6
Total 1 11.11
Question 5
1. Net cash flow
Year 1 Year 2 Year 3 Year 4-12
Sales in units 6100 12100 15100 18300
Sales price $ 35.00 $ 35.00 $ 35.00 $ 35.00
Sales revenue $ 213,500.00 $ 423,500.00 $ 528,500.00 $ 640,500.00
Less: Variable cost $ 91,500.00 $ 181,500.00 $ 226,500.00 $ 274,500.00
Contribution margin $ 122,000.00 $ 242,000.00 $ 302,000.00 $ 366,000.00
Less: Fixed expenses
Salaries and other $ 135,100.00 $ 135,100.00 $ 135,100.00 $ 135,100.00
Advertising cost $ 181,000.00 $ 181,000.00 $ 151,000.00 $ 121,000.00
Total fixed expenses $ 316,100.00 $ 316,100.00 $ 286,100.00 $ 256,100.00
8ACCOUNTING AND BUDGETING
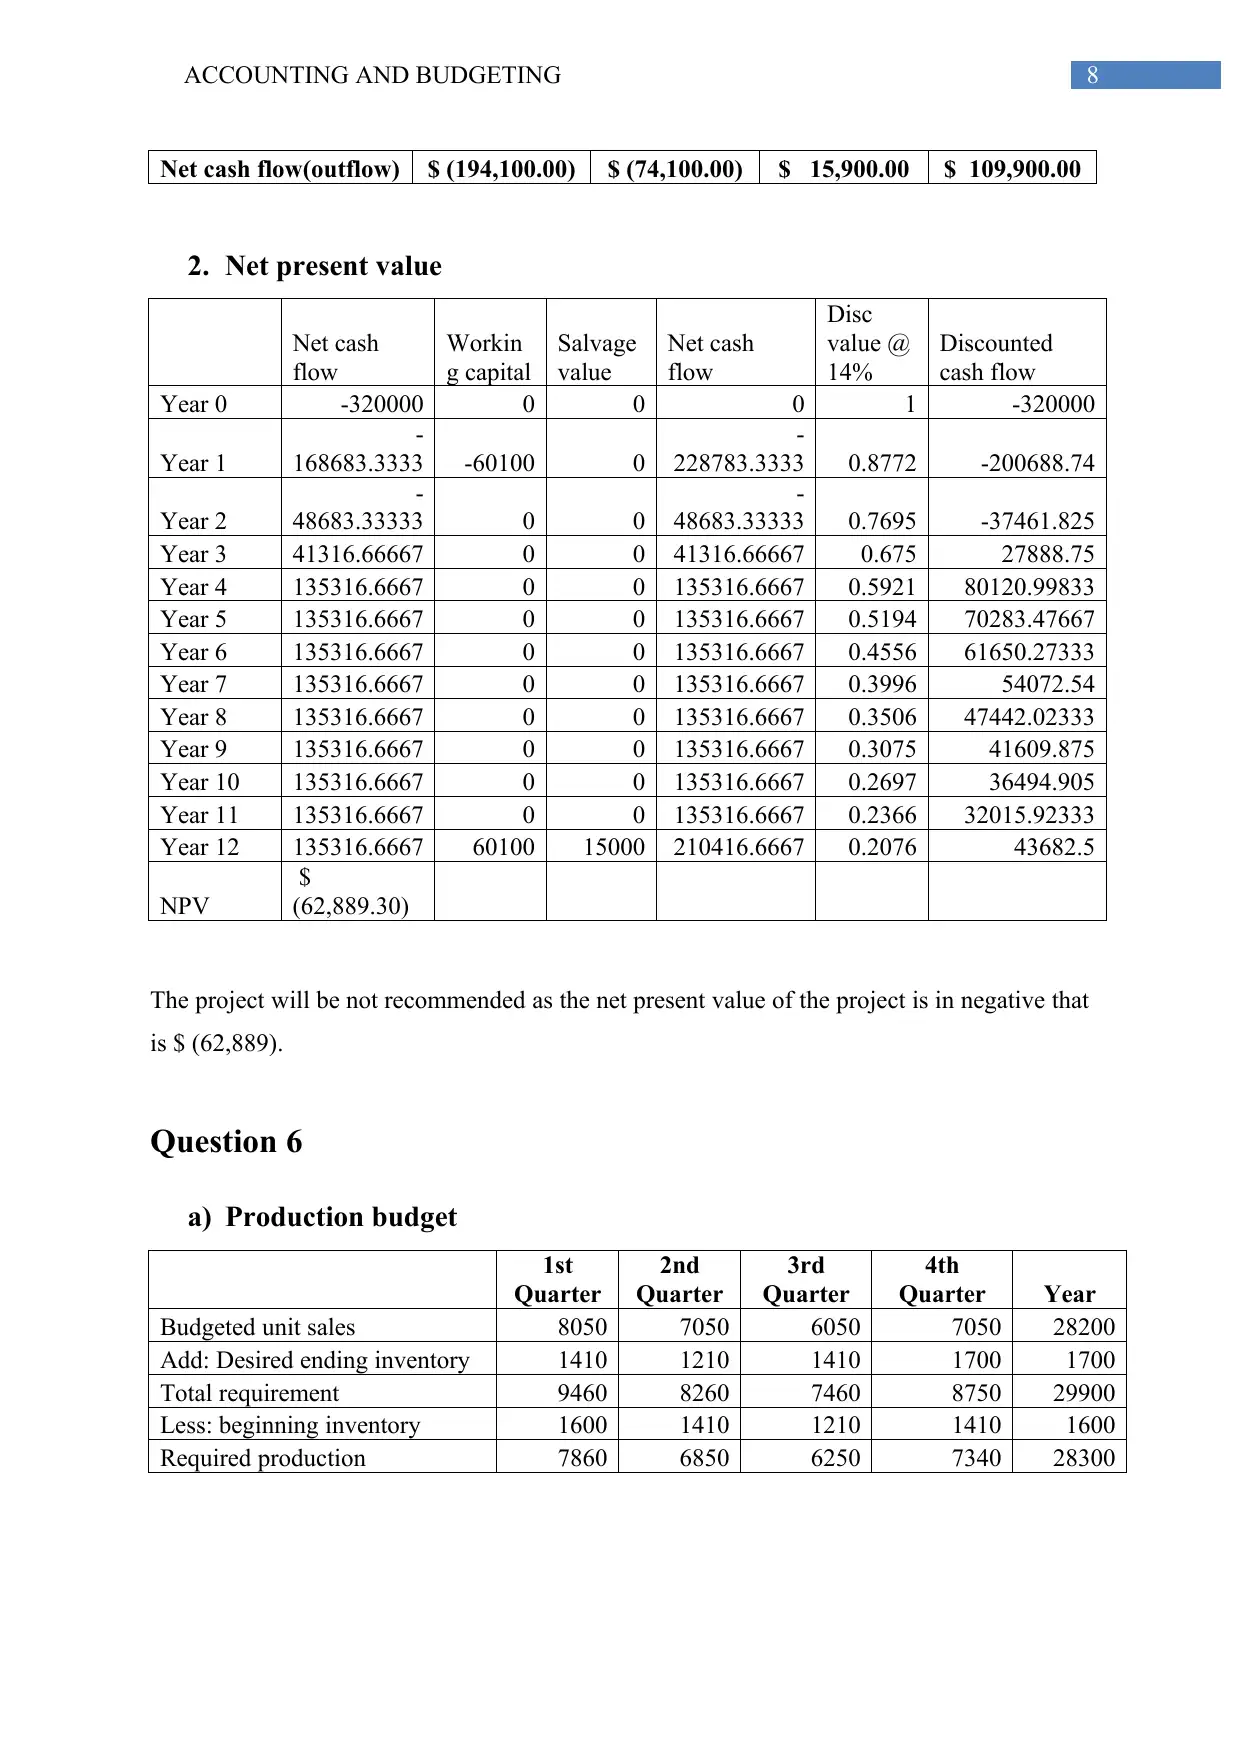
Net cash flow(outflow) $ (194,100.00) $ (74,100.00) $ 15,900.00 $ 109,900.00
2. Net present value
Net cash
flow
Workin
g capital
Salvage
value
Net cash
flow
Disc
value @
14%
Discounted
cash flow
Year 0 -320000 0 0 0 1 -320000
Year 1
-
168683.3333 -60100 0
-
228783.3333 0.8772 -200688.74
Year 2
-
48683.33333 0 0
-
48683.33333 0.7695 -37461.825
Year 3 41316.66667 0 0 41316.66667 0.675 27888.75
Year 4 135316.6667 0 0 135316.6667 0.5921 80120.99833
Year 5 135316.6667 0 0 135316.6667 0.5194 70283.47667
Year 6 135316.6667 0 0 135316.6667 0.4556 61650.27333
Year 7 135316.6667 0 0 135316.6667 0.3996 54072.54
Year 8 135316.6667 0 0 135316.6667 0.3506 47442.02333
Year 9 135316.6667 0 0 135316.6667 0.3075 41609.875
Year 10 135316.6667 0 0 135316.6667 0.2697 36494.905
Year 11 135316.6667 0 0 135316.6667 0.2366 32015.92333
Year 12 135316.6667 60100 15000 210416.6667 0.2076 43682.5
NPV
$
(62,889.30)
The project will be not recommended as the net present value of the project is in negative that
is $ (62,889).
Question 6
a) Production budget
1st
Quarter
2nd
Quarter
3rd
Quarter
4th
Quarter Year
Budgeted unit sales 8050 7050 6050 7050 28200
Add: Desired ending inventory 1410 1210 1410 1700 1700
Total requirement 9460 8260 7460 8750 29900
Less: beginning inventory 1600 1410 1210 1410 1600
Required production 7860 6850 6250 7340 28300
⊘ This is a preview!⊘
Do you want full access?
Subscribe today to unlock all pages.
Trusted by 1+ million students worldwide
9ACCOUNTING AND BUDGETING
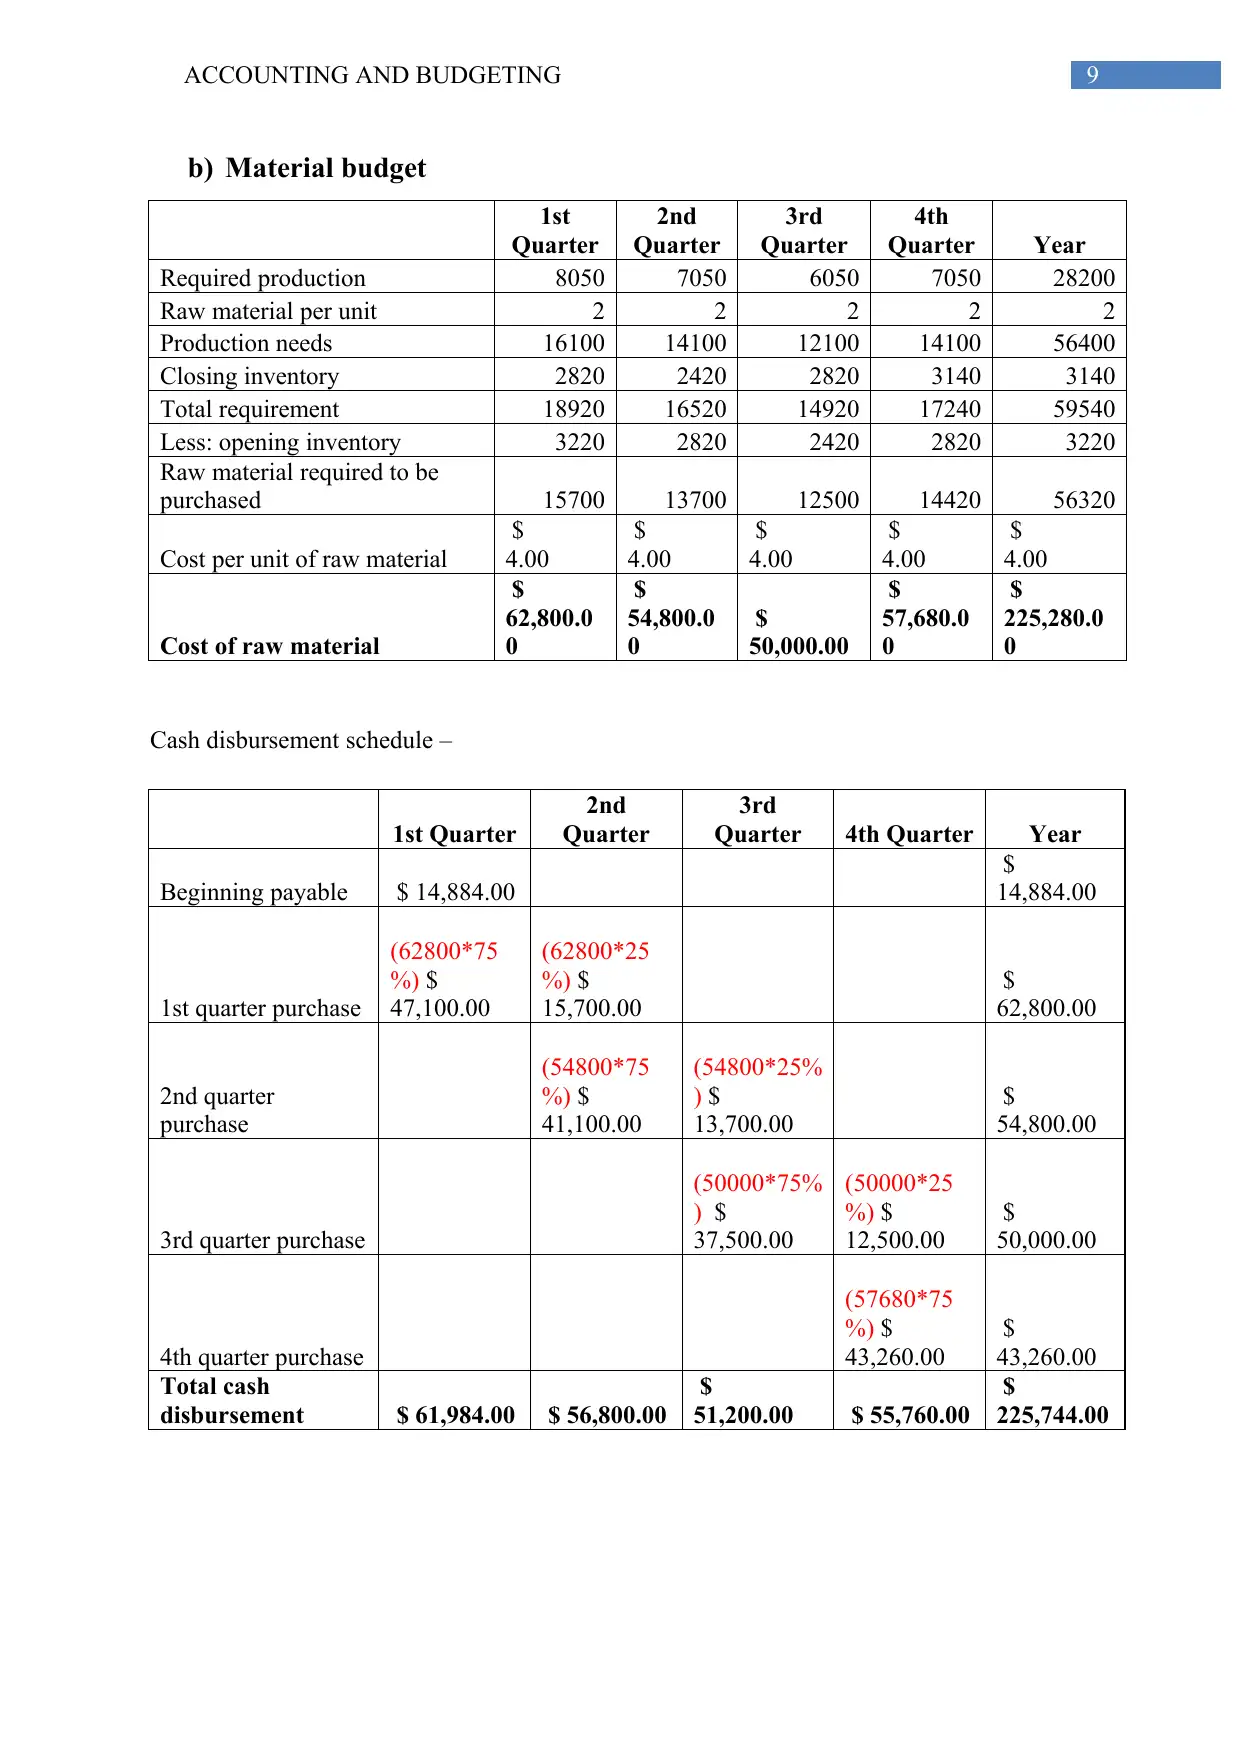
b) Material budget
1st
Quarter
2nd
Quarter
3rd
Quarter
4th
Quarter Year
Required production 8050 7050 6050 7050 28200
Raw material per unit 2 2 2 2 2
Production needs 16100 14100 12100 14100 56400
Closing inventory 2820 2420 2820 3140 3140
Total requirement 18920 16520 14920 17240 59540
Less: opening inventory 3220 2820 2420 2820 3220
Raw material required to be
purchased 15700 13700 12500 14420 56320
Cost per unit of raw material
$
4.00
$
4.00
$
4.00
$
4.00
$
4.00
Cost of raw material
$
62,800.0
0
$
54,800.0
0
$
50,000.00
$
57,680.0
0
$
225,280.0
0
Cash disbursement schedule –
1st Quarter
2nd
Quarter
3rd
Quarter 4th Quarter Year
Beginning payable $ 14,884.00
$
14,884.00
1st quarter purchase
(62800*75
%) $
47,100.00
(62800*25
%) $
15,700.00
$
62,800.00
2nd quarter
purchase
(54800*75
%) $
41,100.00
(54800*25%
) $
13,700.00
$
54,800.00
3rd quarter purchase
(50000*75%
) $
37,500.00
(50000*25
%) $
12,500.00
$
50,000.00
4th quarter purchase
(57680*75
%) $
43,260.00
$
43,260.00
Total cash
disbursement $ 61,984.00 $ 56,800.00
$
51,200.00 $ 55,760.00
$
225,744.00
Paraphrase This Document
Need a fresh take? Get an instant paraphrase of this document with our AI Paraphraser
10ACCOUNTING AND BUDGETING
Reference
Bradbury, M. E., & Mear, K. M. (2017). Interpreting the Impact of IFRS
Adoption. Australian Accounting Review, 27(2), 214-219.
Houqe, M. N., Monem, R. M., & van Zijl, T. (2016). The economic consequences of IFRS
adoption: evidence from New Zealand. Journal of International Accounting, Auditing
and Taxation, 27, 40-48.
Kantayya, R., & Panduranga, V. (2017). A Comparative Study of Balance Sheets Prepared
under Indian GAAP and IFRS with Special Reference to Select IT
Companies. Europe, 44, 29.
Ordia, S., & Bhanawat, S. S. (2017). The Impact of Adoption of IFRS on Shareholders'
Wealth: A Study of Select Indian Companies. IUP Journal of Accounting Research &
Audit Practices, 16(2), 7.
1 out of 11
Related Documents


Your All-in-One AI-Powered Toolkit for Academic Success.
+13062052269
info@desklib.com
Available 24*7 on WhatsApp / Email
![[object Object]](/_next/static/media/star-bottom.7253800d.svg)
Unlock your academic potential
Copyright © 2020–2026 A2Z Services. All Rights Reserved. Developed and managed by ZUCOL.