7111AFE Accounting: Competitor Analysis of Wesfarmers and Woolworths
VerifiedAdded on 2022/10/15
|16
|3103
|18
Report
AI Summary
This report presents a competitor analysis of Wesfarmers Group, focusing on its financial position and performance relative to Woolworths Group. The analysis includes a comparison of their business lines and a detailed ratio analysis examining liquidity, efficiency, profitability, stability, and investment. The report also analyzes the consolidated financial position of Wesfarmers for the 2018 financial year, including depreciation methods, impairment of assets, and key financial figures from the income statement and balance sheet. Common size and trend analyses are conducted, and key financial ratios for both Wesfarmers and Woolworths are calculated and interpreted to assess their competitive positions, providing insights into their liquidity, solvency, profitability, efficiency, and investment ratios. The conclusion summarizes the key findings, highlighting Woolworth's stronger profitability and Wesfarmers' better liquidity, solvency, and efficiency.
1
7111AFE Accounting
Trimester 2, 2019 Group Assignment
7111AFE Accounting
Trimester 2, 2019 Group Assignment
Paraphrase This Document
Need a fresh take? Get an instant paraphrase of this document with our AI Paraphraser
2
Contents
Introduction......................................................................................................................................3
Part A: Motivation...........................................................................................................................3
Part B: Analysis Report...................................................................................................................3
B1: Consolidated Financial Position 2018 for Wesfarmers.........................................................3
B2: Income Statement for Wesfarmers for 2018.........................................................................5
B3: Financial Statement Analysis................................................................................................6
B4: Financial analysis for Wesfarmers and its competitor Woolworth.....................................11
Conclusion.....................................................................................................................................12
References......................................................................................................................................13
Appendix........................................................................................................................................14
3
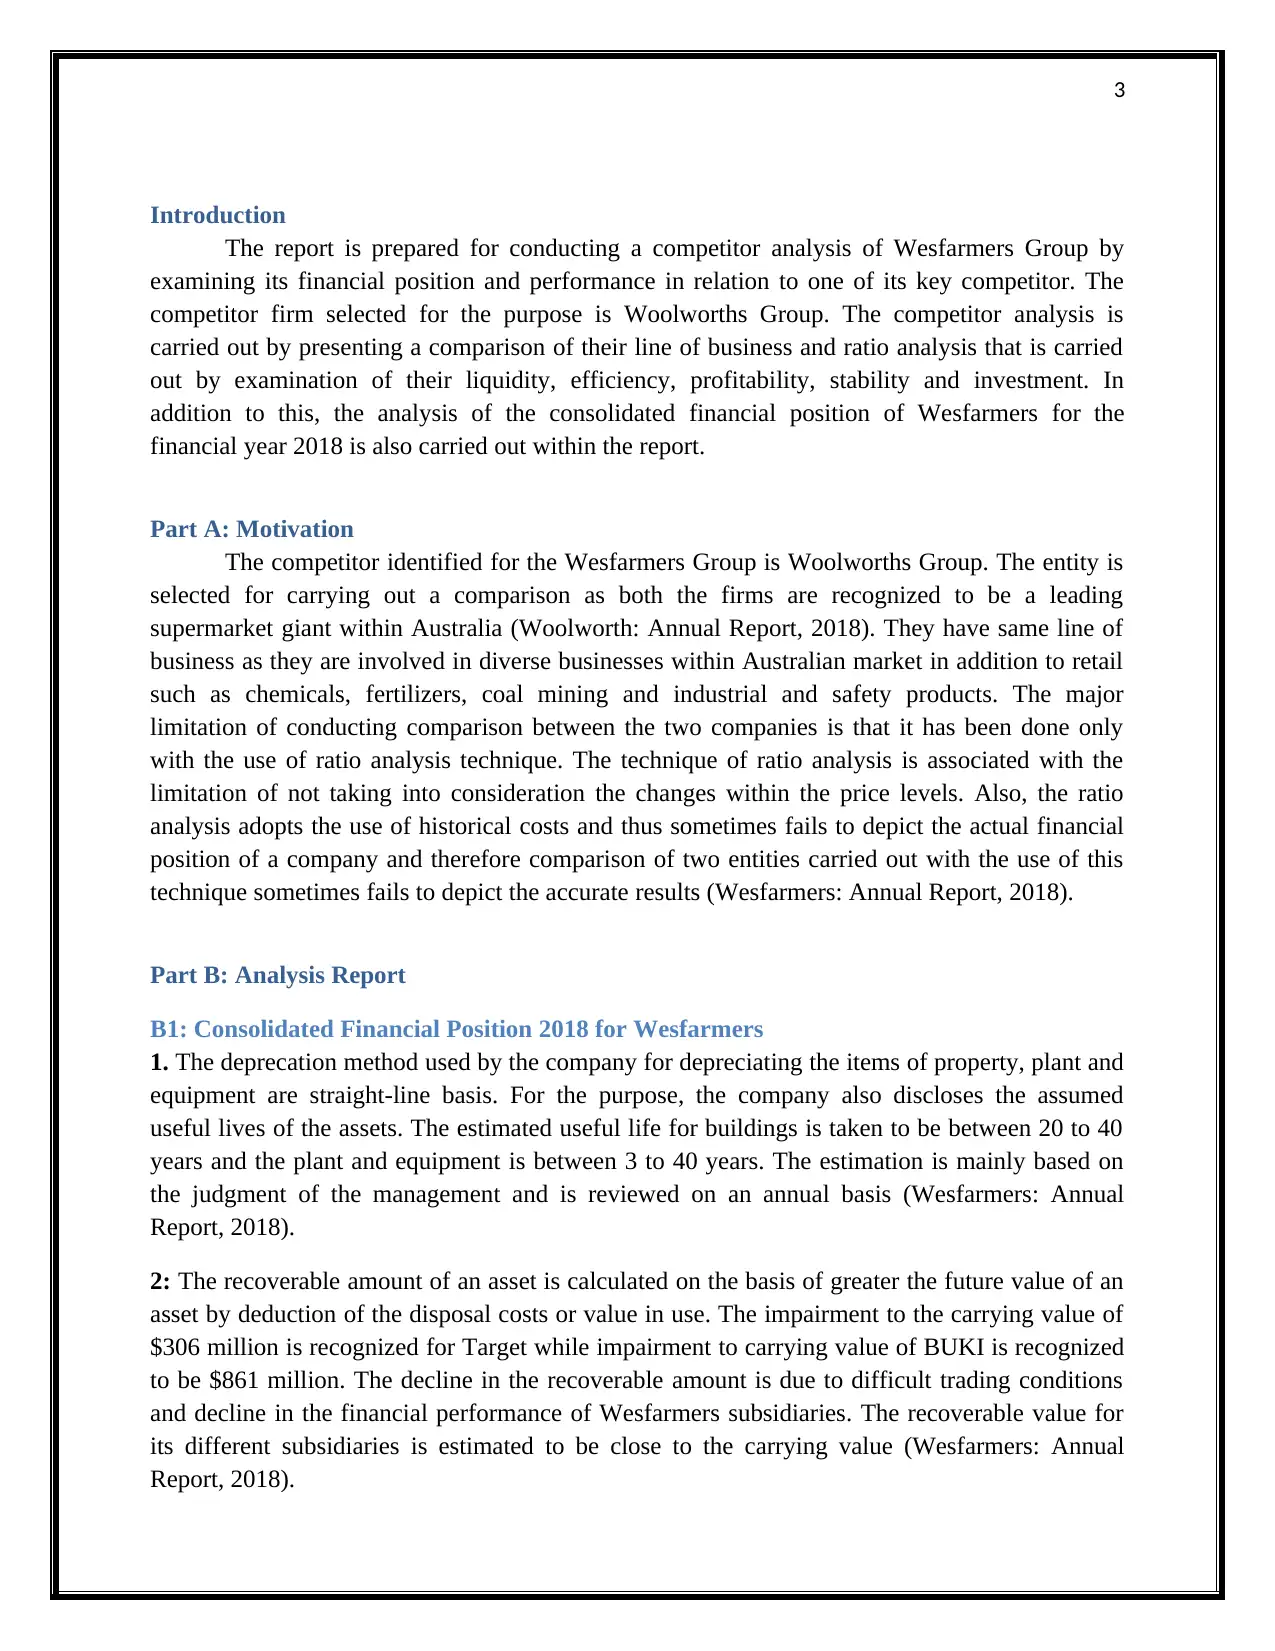
Introduction
The report is prepared for conducting a competitor analysis of Wesfarmers Group by
examining its financial position and performance in relation to one of its key competitor. The
competitor firm selected for the purpose is Woolworths Group. The competitor analysis is
carried out by presenting a comparison of their line of business and ratio analysis that is carried
out by examination of their liquidity, efficiency, profitability, stability and investment. In
addition to this, the analysis of the consolidated financial position of Wesfarmers for the
financial year 2018 is also carried out within the report.
Part A: Motivation
The competitor identified for the Wesfarmers Group is Woolworths Group. The entity is
selected for carrying out a comparison as both the firms are recognized to be a leading
supermarket giant within Australia (Woolworth: Annual Report, 2018). They have same line of
business as they are involved in diverse businesses within Australian market in addition to retail
such as chemicals, fertilizers, coal mining and industrial and safety products. The major
limitation of conducting comparison between the two companies is that it has been done only
with the use of ratio analysis technique. The technique of ratio analysis is associated with the
limitation of not taking into consideration the changes within the price levels. Also, the ratio
analysis adopts the use of historical costs and thus sometimes fails to depict the actual financial
position of a company and therefore comparison of two entities carried out with the use of this
technique sometimes fails to depict the accurate results (Wesfarmers: Annual Report, 2018).
Part B: Analysis Report
B1: Consolidated Financial Position 2018 for Wesfarmers
1. The deprecation method used by the company for depreciating the items of property, plant and
equipment are straight-line basis. For the purpose, the company also discloses the assumed
useful lives of the assets. The estimated useful life for buildings is taken to be between 20 to 40
years and the plant and equipment is between 3 to 40 years. The estimation is mainly based on
the judgment of the management and is reviewed on an annual basis (Wesfarmers: Annual
Report, 2018).
2: The recoverable amount of an asset is calculated on the basis of greater the future value of an
asset by deduction of the disposal costs or value in use. The impairment to the carrying value of
$306 million is recognized for Target while impairment to carrying value of BUKI is recognized
to be $861 million. The decline in the recoverable amount is due to difficult trading conditions
and decline in the financial performance of Wesfarmers subsidiaries. The recoverable value for
its different subsidiaries is estimated to be close to the carrying value (Wesfarmers: Annual
Report, 2018).
⊘ This is a preview!⊘
Do you want full access?
Subscribe today to unlock all pages.
Trusted by 1+ million students worldwide
4
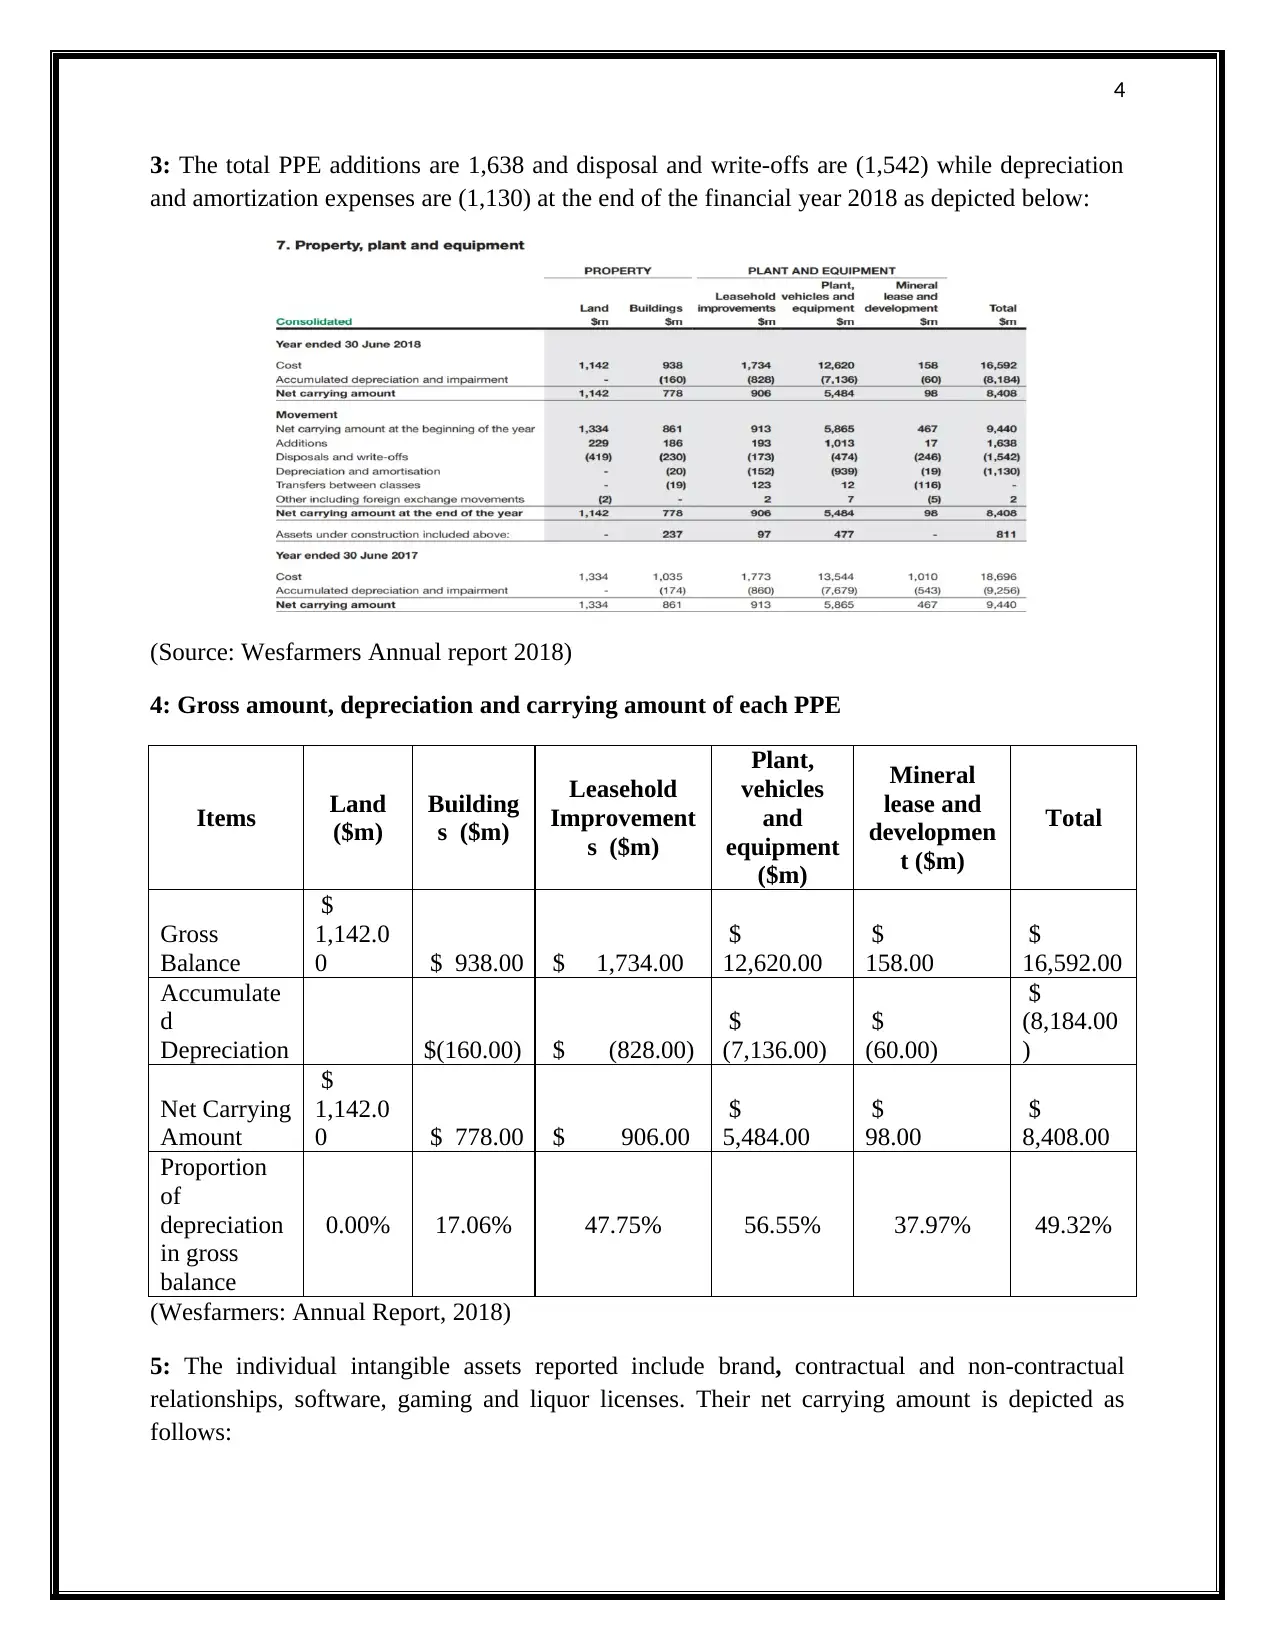
3: The total PPE additions are 1,638 and disposal and write-offs are (1,542) while depreciation
and amortization expenses are (1,130) at the end of the financial year 2018 as depicted below:
(Source: Wesfarmers Annual report 2018)
4: Gross amount, depreciation and carrying amount of each PPE
Items Land
($m)
Building
s ($m)
Leasehold
Improvement
s ($m)
Plant,
vehicles
and
equipment
($m)
Mineral
lease and
developmen
t ($m)
Total
Gross
Balance
$
1,142.0
0 $ 938.00 $ 1,734.00
$
12,620.00
$
158.00
$
16,592.00
Accumulate
d
Depreciation $(160.00) $ (828.00)
$
(7,136.00)
$
(60.00)
$
(8,184.00
)
Net Carrying
Amount
$
1,142.0
0 $ 778.00 $ 906.00
$
5,484.00
$
98.00
$
8,408.00
Proportion
of
depreciation
in gross
balance
0.00% 17.06% 47.75% 56.55% 37.97% 49.32%
(Wesfarmers: Annual Report, 2018)
5: The individual intangible assets reported include brand, contractual and non-contractual
relationships, software, gaming and liquor licenses. Their net carrying amount is depicted as
follows:
Paraphrase This Document
Need a fresh take? Get an instant paraphrase of this document with our AI Paraphraser
5
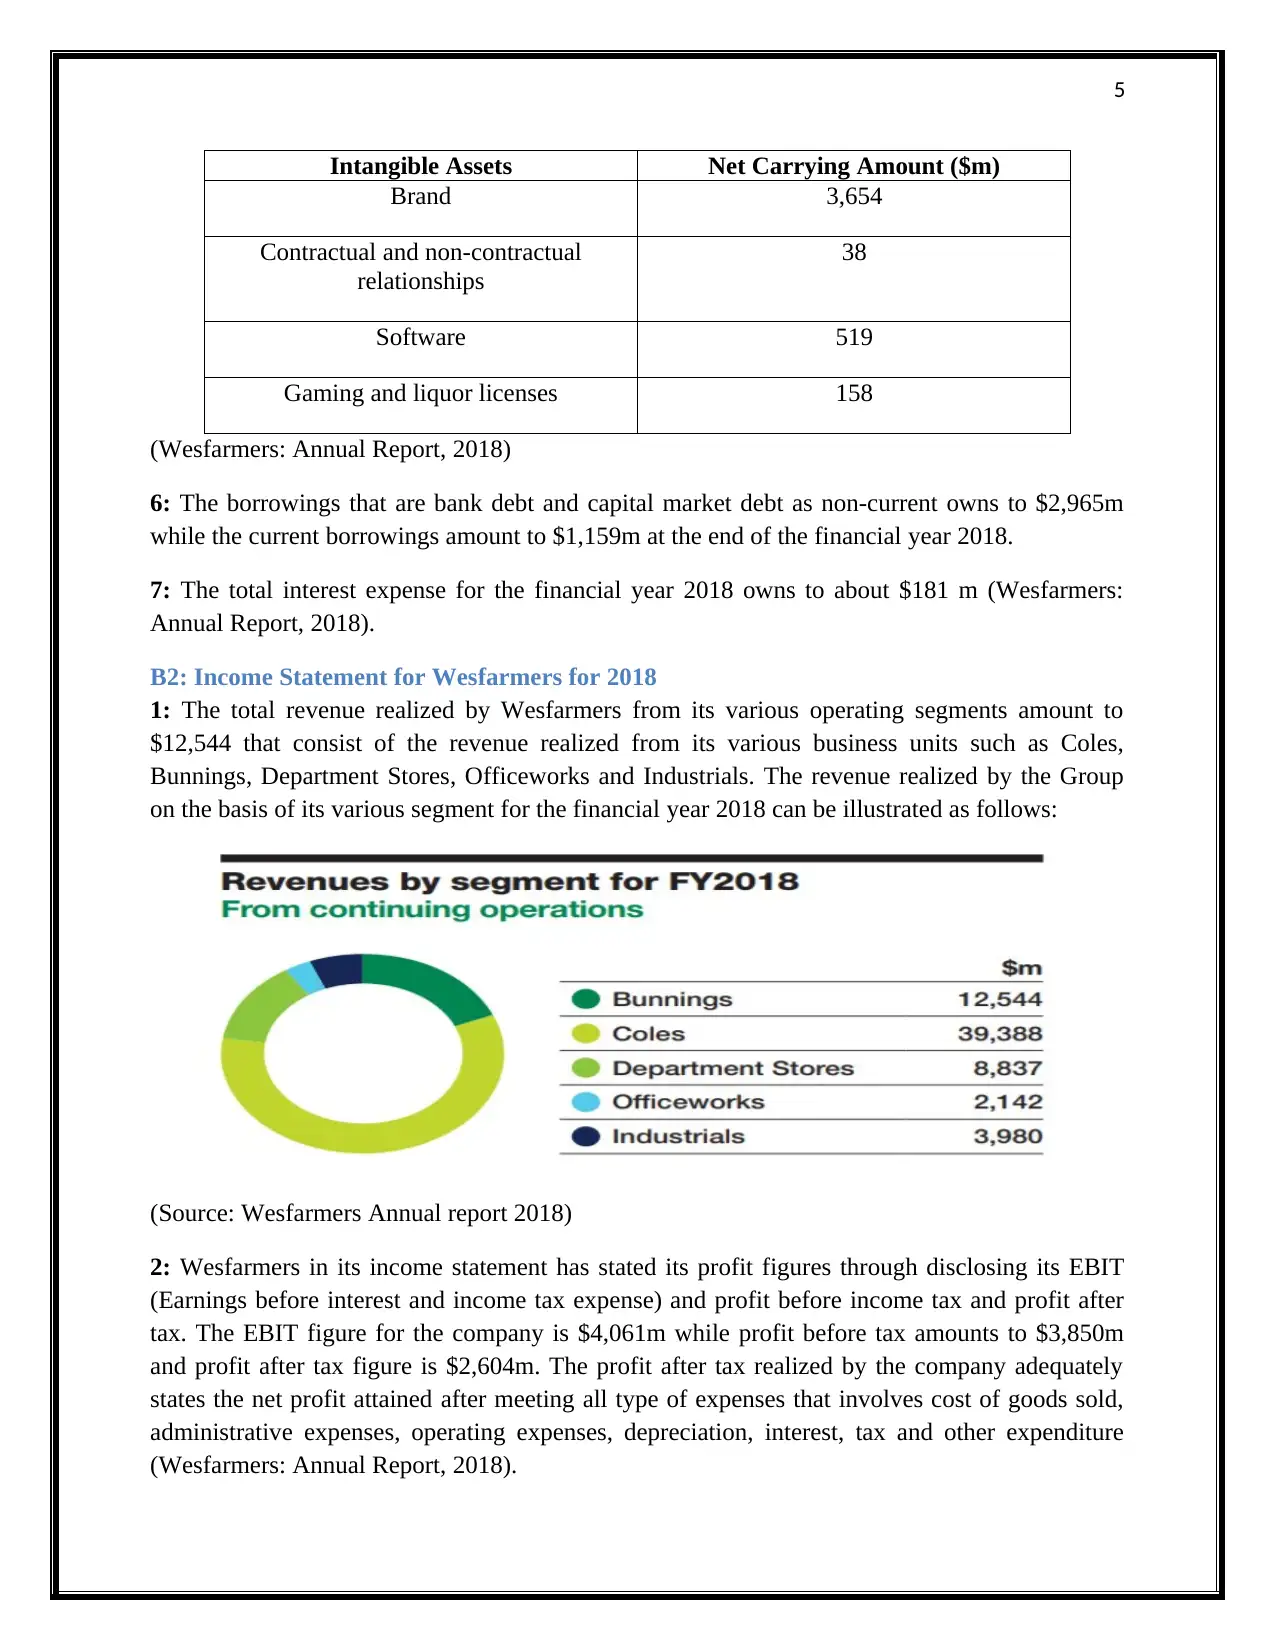
Intangible Assets Net Carrying Amount ($m)
Brand 3,654
Contractual and non-contractual
relationships
38
Software 519
Gaming and liquor licenses 158
(Wesfarmers: Annual Report, 2018)
6: The borrowings that are bank debt and capital market debt as non-current owns to $2,965m
while the current borrowings amount to $1,159m at the end of the financial year 2018.
7: The total interest expense for the financial year 2018 owns to about $181 m (Wesfarmers:
Annual Report, 2018).
B2: Income Statement for Wesfarmers for 2018
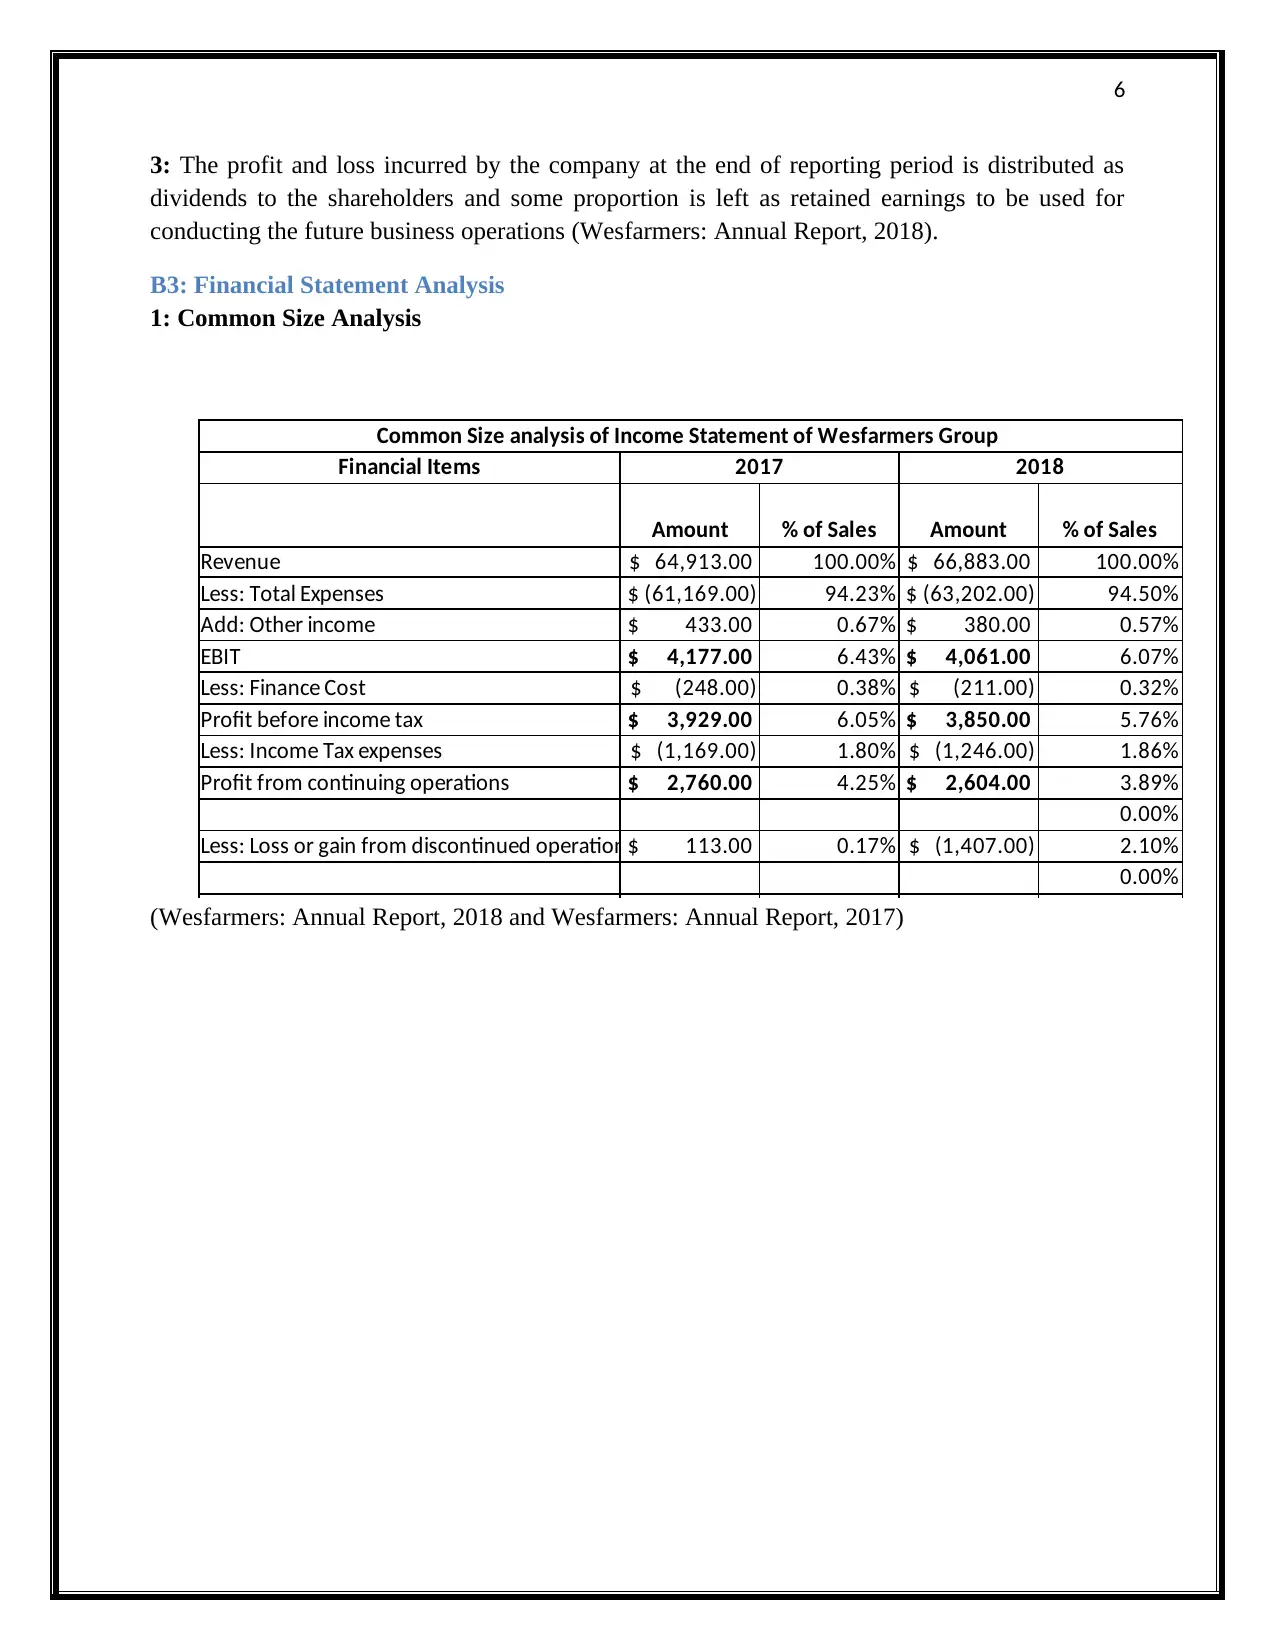
1: The total revenue realized by Wesfarmers from its various operating segments amount to
$12,544 that consist of the revenue realized from its various business units such as Coles,
Bunnings, Department Stores, Officeworks and Industrials. The revenue realized by the Group
on the basis of its various segment for the financial year 2018 can be illustrated as follows:
(Source: Wesfarmers Annual report 2018)
2: Wesfarmers in its income statement has stated its profit figures through disclosing its EBIT
(Earnings before interest and income tax expense) and profit before income tax and profit after
tax. The EBIT figure for the company is $4,061m while profit before tax amounts to $3,850m
and profit after tax figure is $2,604m. The profit after tax realized by the company adequately
states the net profit attained after meeting all type of expenses that involves cost of goods sold,
administrative expenses, operating expenses, depreciation, interest, tax and other expenditure
(Wesfarmers: Annual Report, 2018).
Intangible Assets Net Carrying Amount ($m)
Brand 3,654
Contractual and non-contractual
relationships
38
Software 519
Gaming and liquor licenses 158
(Wesfarmers: Annual Report, 2018)
6: The borrowings that are bank debt and capital market debt as non-current owns to $2,965m
while the current borrowings amount to $1,159m at the end of the financial year 2018.
7: The total interest expense for the financial year 2018 owns to about $181 m (Wesfarmers:
Annual Report, 2018).
B2: Income Statement for Wesfarmers for 2018
1: The total revenue realized by Wesfarmers from its various operating segments amount to
$12,544 that consist of the revenue realized from its various business units such as Coles,
Bunnings, Department Stores, Officeworks and Industrials. The revenue realized by the Group
on the basis of its various segment for the financial year 2018 can be illustrated as follows:
(Source: Wesfarmers Annual report 2018)
2: Wesfarmers in its income statement has stated its profit figures through disclosing its EBIT
(Earnings before interest and income tax expense) and profit before income tax and profit after
tax. The EBIT figure for the company is $4,061m while profit before tax amounts to $3,850m
and profit after tax figure is $2,604m. The profit after tax realized by the company adequately
states the net profit attained after meeting all type of expenses that involves cost of goods sold,
administrative expenses, operating expenses, depreciation, interest, tax and other expenditure
(Wesfarmers: Annual Report, 2018).
6
3: The profit and loss incurred by the company at the end of reporting period is distributed as
dividends to the shareholders and some proportion is left as retained earnings to be used for
conducting the future business operations (Wesfarmers: Annual Report, 2018).
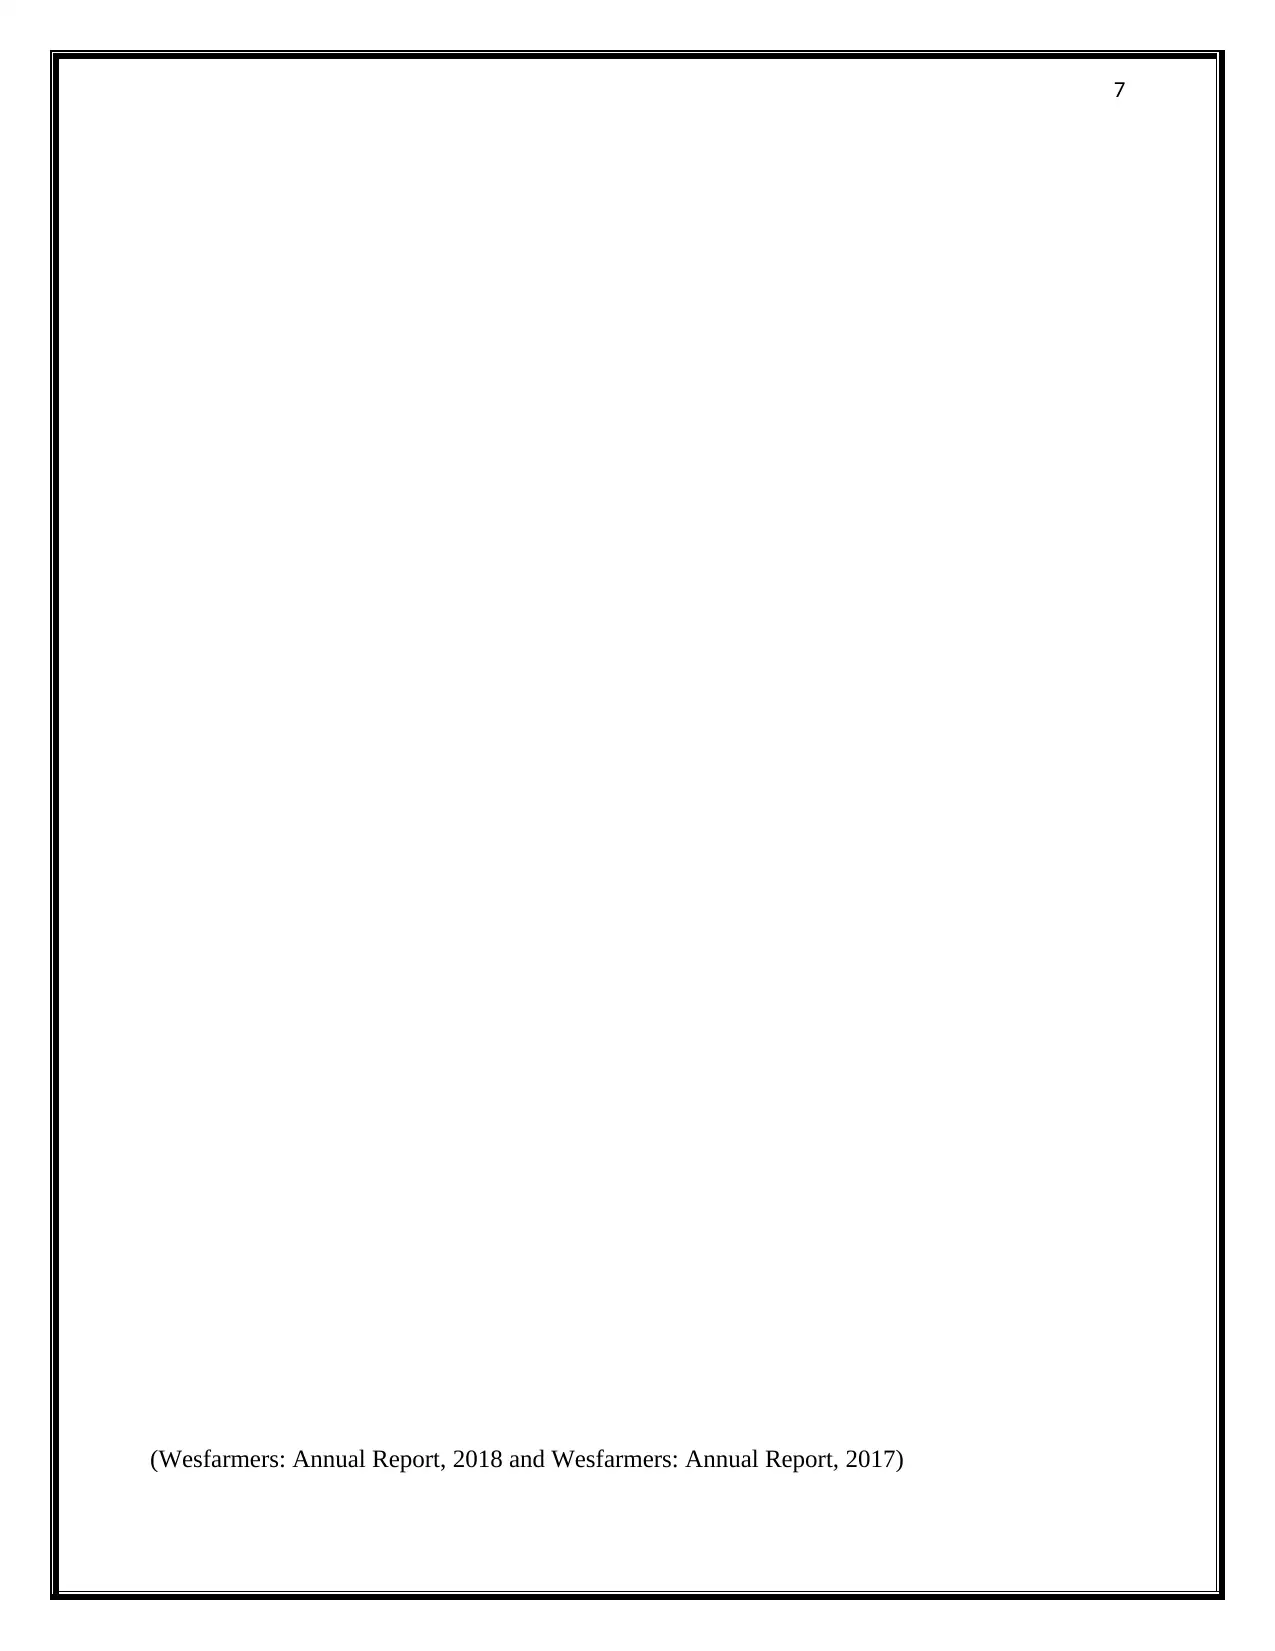
B3: Financial Statement Analysis
1: Common Size Analysis
Common Size analysis of Income Statement of Wesfarmers Group
Financial Items 2017 2018
Amount % of Sales Amount % of Sales
Revenue $ 64,913.00 100.00% $ 66,883.00 100.00%
Less: Total Expenses $ (61,169.00) 94.23% $ (63,202.00) 94.50%
Add: Other income $ 433.00 0.67% $ 380.00 0.57%
EBIT $ 4,177.00 6.43% $ 4,061.00 6.07%
Less: Finance Cost $ (248.00) 0.38% $ (211.00) 0.32%
Profit before income tax $ 3,929.00 6.05% $ 3,850.00 5.76%
Less: Income Tax expenses $ (1,169.00) 1.80% $ (1,246.00) 1.86%
Profit from continuing operations $ 2,760.00 4.25% $ 2,604.00 3.89%
0.00%
Less: Loss or gain from discontinued operation $ 113.00 0.17% $ (1,407.00) 2.10%
0.00%
(Wesfarmers: Annual Report, 2018 and Wesfarmers: Annual Report, 2017)
3: The profit and loss incurred by the company at the end of reporting period is distributed as
dividends to the shareholders and some proportion is left as retained earnings to be used for
conducting the future business operations (Wesfarmers: Annual Report, 2018).
B3: Financial Statement Analysis
1: Common Size Analysis
Common Size analysis of Income Statement of Wesfarmers Group
Financial Items 2017 2018
Amount % of Sales Amount % of Sales
Revenue $ 64,913.00 100.00% $ 66,883.00 100.00%
Less: Total Expenses $ (61,169.00) 94.23% $ (63,202.00) 94.50%
Add: Other income $ 433.00 0.67% $ 380.00 0.57%
EBIT $ 4,177.00 6.43% $ 4,061.00 6.07%
Less: Finance Cost $ (248.00) 0.38% $ (211.00) 0.32%
Profit before income tax $ 3,929.00 6.05% $ 3,850.00 5.76%
Less: Income Tax expenses $ (1,169.00) 1.80% $ (1,246.00) 1.86%
Profit from continuing operations $ 2,760.00 4.25% $ 2,604.00 3.89%
0.00%
Less: Loss or gain from discontinued operation $ 113.00 0.17% $ (1,407.00) 2.10%
0.00%
(Wesfarmers: Annual Report, 2018 and Wesfarmers: Annual Report, 2017)
⊘ This is a preview!⊘
Do you want full access?
Subscribe today to unlock all pages.
Trusted by 1+ million students worldwide
7
(Wesfarmers: Annual Report, 2018 and Wesfarmers: Annual Report, 2017)
(Wesfarmers: Annual Report, 2018 and Wesfarmers: Annual Report, 2017)
Paraphrase This Document
Need a fresh take? Get an instant paraphrase of this document with our AI Paraphraser
8
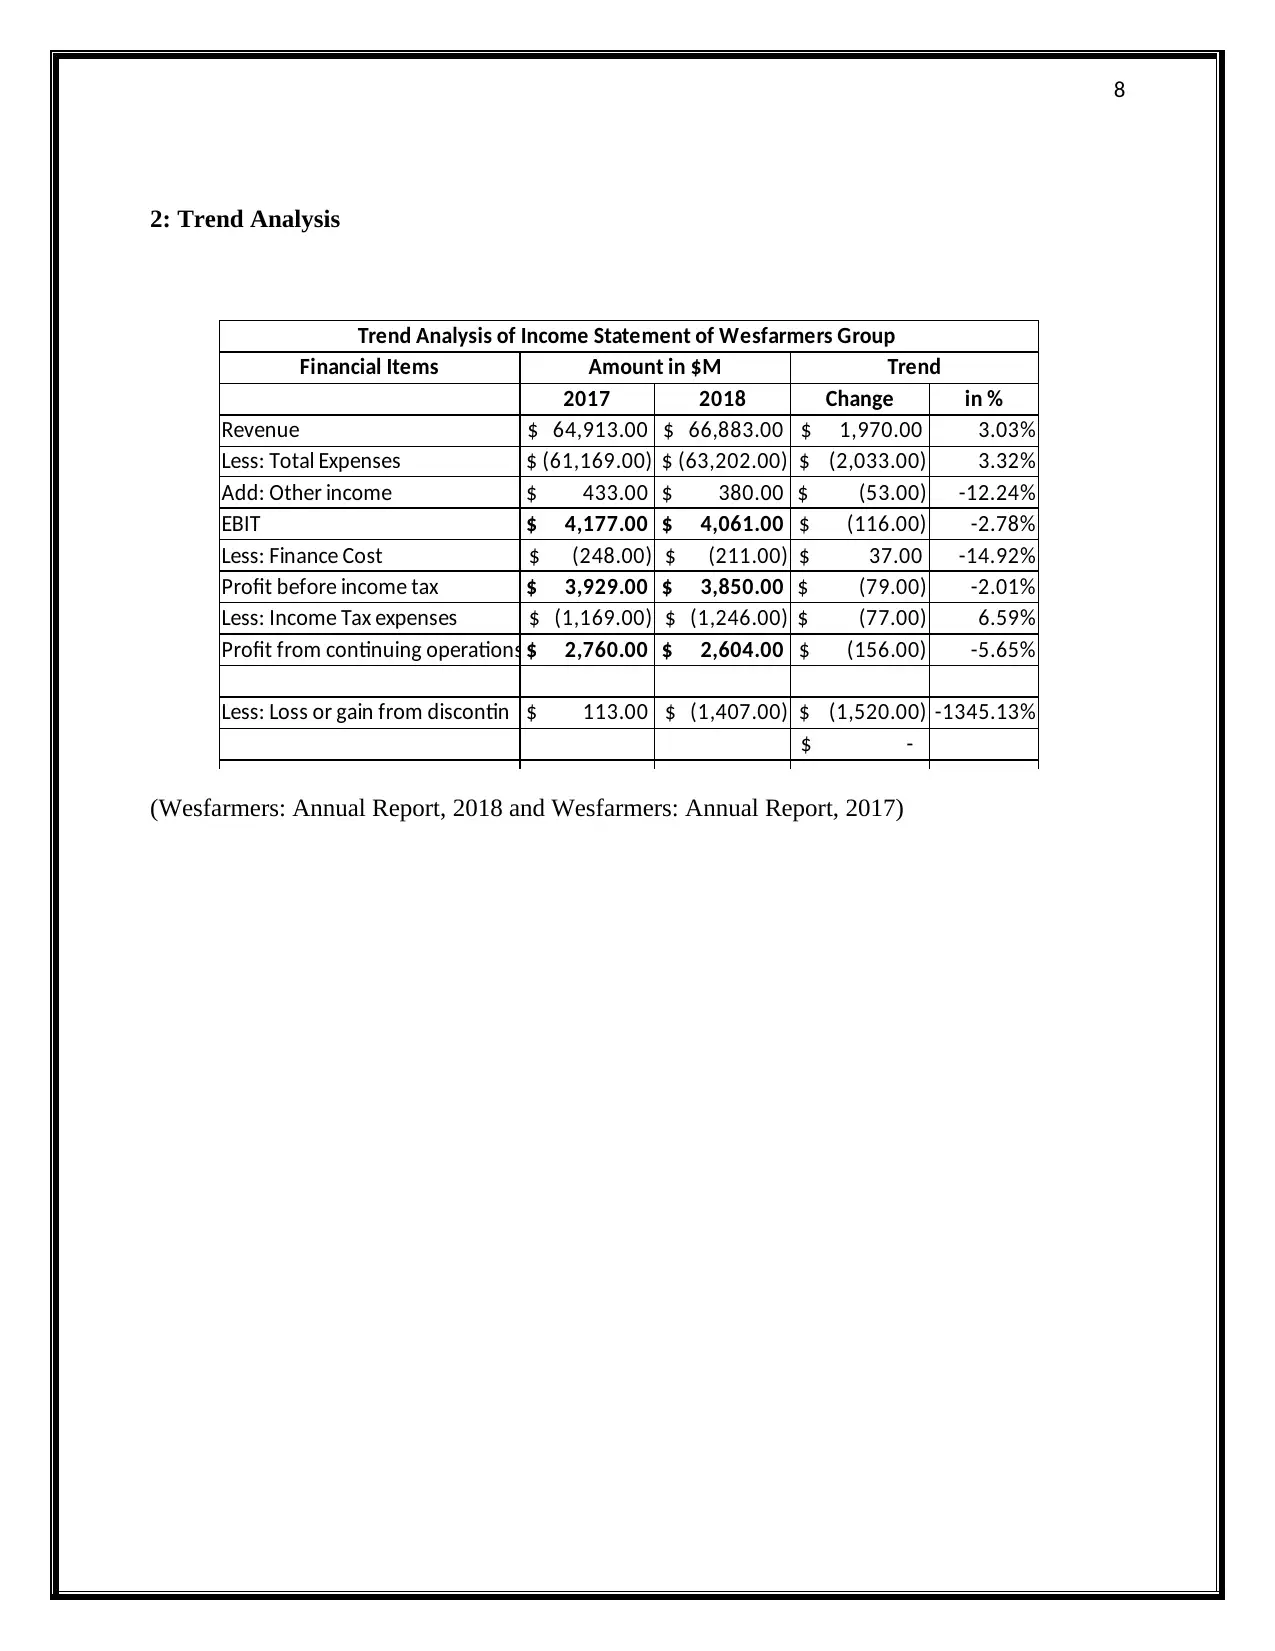
2: Trend Analysis
Trend Analysis of Income Statement of Wesfarmers Group
Financial Items Amount in $M Trend
2017 2018 Change in %
Revenue $ 64,913.00 $ 66,883.00 $ 1,970.00 3.03%
Less: Total Expenses $ (61,169.00) $ (63,202.00) $ (2,033.00) 3.32%
Add: Other income $ 433.00 $ 380.00 $ (53.00) -12.24%
EBIT $ 4,177.00 $ 4,061.00 $ (116.00) -2.78%
Less: Finance Cost $ (248.00) $ (211.00) $ 37.00 -14.92%
Profit before income tax $ 3,929.00 $ 3,850.00 $ (79.00) -2.01%
Less: Income Tax expenses $ (1,169.00) $ (1,246.00) $ (77.00) 6.59%
Profit from continuing operations $ 2,760.00 $ 2,604.00 $ (156.00) -5.65%
Less: Loss or gain from discontin $ 113.00 $ (1,407.00) $ (1,520.00) -1345.13%
$ -
(Wesfarmers: Annual Report, 2018 and Wesfarmers: Annual Report, 2017)
9
(Wesfarmers: Annual Report, 2018 and Wesfarmers: Annual Report, 2017)
(Wesfarmers: Annual Report, 2018 and Wesfarmers: Annual Report, 2017)
⊘ This is a preview!⊘
Do you want full access?
Subscribe today to unlock all pages.
Trusted by 1+ million students worldwide
10
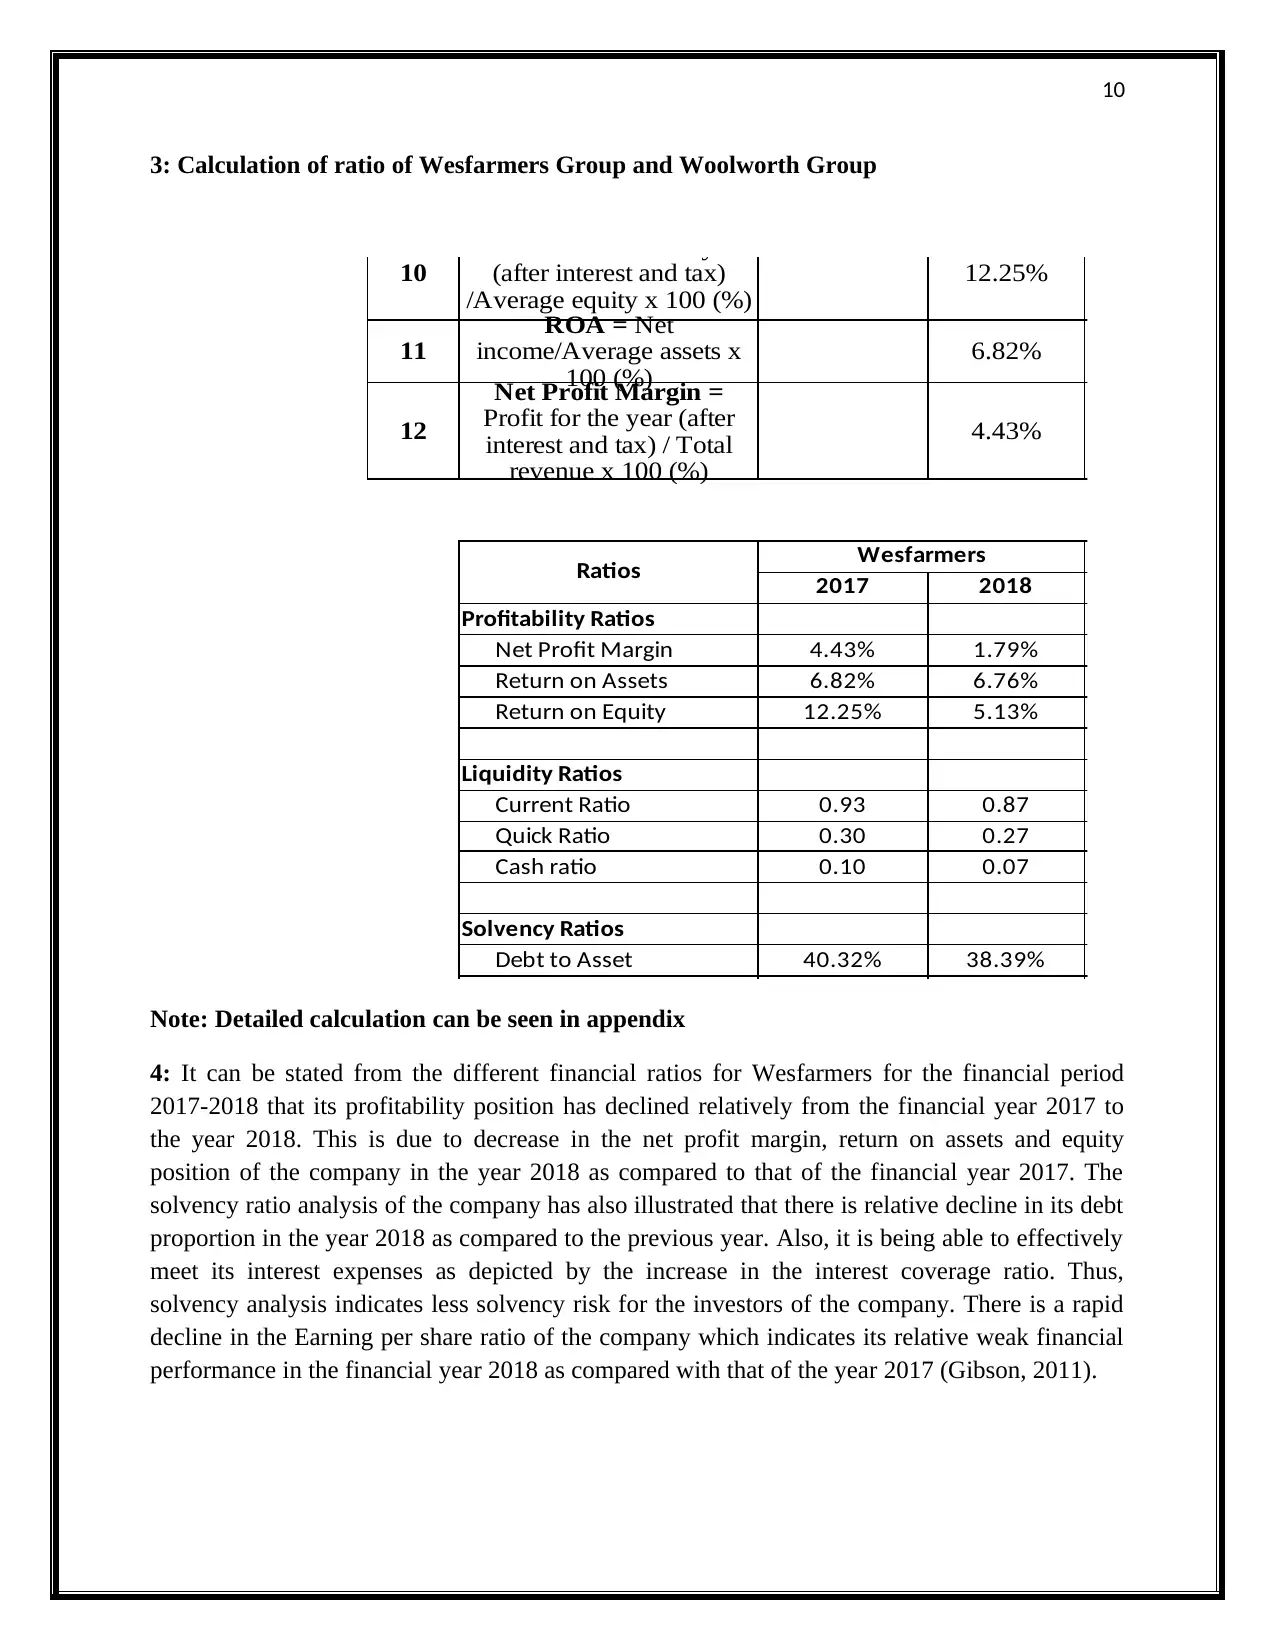
3: Calculation of ratio of Wesfarmers Group and Woolworth Group
10 12.25%
11 6.82%
12 4.43%
Ratios Wesfarmers
2017 2018
Profitability Ratios
Net Profit Margin 4.43% 1.79%
Return on Assets 6.82% 6.76%
Return on Equity 12.25% 5.13%
Liquidity Ratios
Current Ratio 0.93 0.87
Quick Ratio 0.30 0.27
Cash ratio 0.10 0.07
Solvency Ratios
Debt to Asset 40.32% 38.39%
ROE = Profit for the year
(after interest and tax)
/Average equity x 100 (%)
ROA = Net
income/Average assets x
100 (%)
Net Profit Margin =
Profit for the year (after
interest and tax) / Total
revenue x 100 (%)
Note: Detailed calculation can be seen in appendix
4: It can be stated from the different financial ratios for Wesfarmers for the financial period
2017-2018 that its profitability position has declined relatively from the financial year 2017 to
the year 2018. This is due to decrease in the net profit margin, return on assets and equity
position of the company in the year 2018 as compared to that of the financial year 2017. The
solvency ratio analysis of the company has also illustrated that there is relative decline in its debt
proportion in the year 2018 as compared to the previous year. Also, it is being able to effectively
meet its interest expenses as depicted by the increase in the interest coverage ratio. Thus,
solvency analysis indicates less solvency risk for the investors of the company. There is a rapid
decline in the Earning per share ratio of the company which indicates its relative weak financial
performance in the financial year 2018 as compared with that of the year 2017 (Gibson, 2011).
Paraphrase This Document
Need a fresh take? Get an instant paraphrase of this document with our AI Paraphraser
11
B4: Financial analysis for Wesfarmers and its competitor Woolworth
The competitive position of Wesfarmers is evaluated in respect of its key competitor
Woolworths by conducting ratio analysis to provide suggestions to a financial adviser for
investment purpose. The analysis and interpretation of the key ratios for both the firms is carried
out as follows:
Liquidity Analysis: The liquidity analysis for both the firms is carried out by the calculation of
the following ratios:
Current Ratio: The current ratio for both Wesfarmers and Woolworths for the financial
period 2017-2018 is less than 1 indicating that they possess a credit risk due to presence
of fewer current assets for meeting the current liabilities. However, Woolworth has a
relatively lower ratio for both the years as compared to Wesfarmers and this indicates
more credit risk for Woolworths Group (Bragg, 2010).
Quick Ratio: The Quick ratio for Wesfarmers has relatively declined from 0.30 to 0.27
and for Woolworths it has depicted a gradual increase from 0.33 to 0.32 over the
financial period 2017-2018. This means that Woolworths has strengthened its liquidity
position for meeting the short-term obligations with its most liquid asset base as
compared to Wesfarmers. However, the quick ratio for both the companies is less than 1
over the selected financial period which means that they need to increase their liquid
asset base for effectively meeting the short-term financial obligations
Cash Ratio: The cash equivalents for Wesfarmers have decreased from 0.10 to 0.07 for
the year 2017-2018 while that for Woolworths have depicted a gradual increase from
0.10 to 0.14 for the respective period (Baker & Powell, 2010).
Solvency Analysis
Debt to Asset: The debt to asset ratio for the financial year 2017-2018 for Wesfarmers
has depicted a decrease from 40.32% to 38.39% while for Woolworths have also shown a
decrease from 57.14% to 53.95%. This implies that Woolworths is financing more its
assets from debt as compared to Wesfarmers (Moles & Kidwekk, 2011).
Debt to Equity: The Wesfarmers have depicted a decrease from 67.56% to 62.3% while
for Woolworths it has declined from 133.32% to 117.14% during the financial year 2017-
2018. This implies that Wesfarmers is using less debt in comparison to equity for
financing its asset base as compared with that of Woolworths.
Interest Coverage: Both the companies are able to effectively manage their interest
obligations as depicted by the increase in the ratio for both the companies. Wesfarmers is
able to more adequately manage its interest expense as it depicts an increase from 16.84
to 19.25 for the financial period as compared to Woolworths that have depicted an
increase from 11.99 to 16.55 (Krantz, 2016).
Profitability Analysis
12
Net Profit Margin: The net profit margin for Wesfarmers has depicted a decrease from
4.43% to 1.79% while for Woolworths have depicted an increase from 2.89 to 3.15%
over the respective period. This implies that Woolworths is more able to effectively meet
its operating expenses as compared to Woolworths.
Return on Assets: The ROA position of Wesfarmers have also depicted gradual decrease
from 6.82% to 6.76% while for Woolworth it has been relatively improved from 6.36%
to 7.195 over the financial period 2017-2018. This implies that Woolworth’s position is
more effective to realize sale from asset base as compared with Woolworths Group.
Return on Equity: The ROE position of Wesfarmers is also weak as compared with that
of Woolworths. Wesfarmers have depicted a decrease in the ratio from 12.25% to 5.13%
over the financial period while for Woolworth it has depicted an increase from 17.08% to
17.32% over the respective financial period (Davies & Crawford, 2011).
Efficiency Analysis
Cash flow from operations: Both the companies are able to realize less cash from their
operational activities as indicated by the ratio of less than 1 during the financial period
2017-2018.
Receivables turnover: The ratio for Wesfarmers have depicted an increase from 39.81 to
40.66 while for Woolworths have also shown an increase from 72.95 to 73.69 over the
financial period 2017-2018. This clearly indicates that Woolworths is able to effectively
realize its debt and thus ether is less credit risk for the company (Damodaran, 2011).
Investments Ratio
EPS: The Ratio for Wesfarmers has depicted a decline from $2.55 to $1.06 while for the
Woolworths group have decreased from $1.19 to $1.33. This means that amount of net
come available for meeting the shareholders obligations have declined during the
respective years for both the companies (Brigham & Michael, 2013).
Conclusion
It can be stated from the competitor analysis of Wesfarmers carried out in context of
Woolworth that Woolworth possesses better profitability position as compared to Wesfarmers.
Wesfarmers, on the other hand, has better liquidity, solvency and efficiency position as
compared with that of Woolworths.
⊘ This is a preview!⊘
Do you want full access?
Subscribe today to unlock all pages.
Trusted by 1+ million students worldwide
1 out of 16
Related Documents


Your All-in-One AI-Powered Toolkit for Academic Success.
+13062052269
info@desklib.com
Available 24*7 on WhatsApp / Email
![[object Object]](/_next/static/media/star-bottom.7253800d.svg)
Unlock your academic potential
Copyright © 2020–2026 A2Z Services. All Rights Reserved. Developed and managed by ZUCOL.