Comprehensive Accounting Management Report: Jeffrey & Son's Case Study
VerifiedAdded on 2020/01/28
|25
|6772
|43
Report
AI Summary
This report provides a detailed analysis of accounting management principles, focusing on cost classification, unit cost calculation, and the application of absorption costing techniques. It presents a case study of Jeffrey & Son's Ltd, calculating the cost of a product ('Exquisite') using absorption costing, and analyzes the results. The report also covers the preparation and analysis of cost reports, including variance analysis to identify areas for improvement and suggest cost reduction strategies. Furthermore, it discusses the purpose and nature of budgeting, different budgeting methods, and the preparation of various budget types, including a cash budget. The report concludes with a discussion of variance analysis, reconciliation statements, and findings for management, providing a comprehensive overview of accounting management concepts and their practical application within a business context.
Accounting Management
Paraphrase This Document
Need a fresh take? Get an instant paraphrase of this document with our AI Paraphraser
TABLE OF CONTENTS
INTRODUCTION...........................................................................................................................4
1.1 Description of cost classification...........................................................................................4
1.2 Calculating unit cost and total job cost..................................................................................5
1.3 Calculating the cost of Exquisite using absorption costing technique...................................5
1.4 Analyzing cost of Exquisite...................................................................................................9
TASK 2..........................................................................................................................................10
2.1 Preparing and analyzing cost report for month of September.............................................10
2.2 Using various performance indicator to identify areas of improvement.............................12
2.3 Suggesting ways to reduce cost, enhance value and quality................................................12
TASK 3..........................................................................................................................................13
3.1 Purpose and nature of budgeting process............................................................................13
3.2 Selecting appropriate budgeting methods for organization.................................................14
3.3 Preparation of different types of budget..............................................................................15
3.4 Preparing cash budget..........................................................................................................16
TASK 4..........................................................................................................................................20
4.1 Calculating variance............................................................................................................20
4.2 Preparing reconciliation operating statement......................................................................22
4.3 Findings to management in accordance with identified responsibility centres...................23
CONCLUSION..............................................................................................................................23
REFERENCES..............................................................................................................................25
2
INDEX OF TABLES
Table 1: Unit cost.............................................................................................................................5
Table 2: Allocation of cost of support departments on the basis of machine hours........................8
Table 3: Allocation of criteria of cost..............................................................................................8
Table 4: Units to be produced..........................................................................................................9
Table 5: Overhead absorption rate...................................................................................................9
Table 6: Exquisite calculation.........................................................................................................9
Table 7: Calculation of absorption rate on the basis of labor hours................................................9
Table 8: Calculation of Exquisite..................................................................................................10
Table 9: Material purchase budget................................................................................................15
Table 10: Material purchase budget of Jeffrey and Son's..............................................................16
Table 11: Cash budget...................................................................................................................16
Table 12: Reconciliation operating statement................................................................................22
3
⊘ This is a preview!⊘
Do you want full access?
Subscribe today to unlock all pages.
Trusted by 1+ million students worldwide
INTRODUCTION
A procedure used for the analysis and interpretation of data collected by cost and
financial accounting is termed as management accounting. The major objective of this
accounting is to help the manager for making viable decisions so that aims and objectives of the
corporate can be achieved in an effective manner. Further, this kind of accounting helps in
reducing the unnecessary expenses because; it maintains a track over all the expenses and
surplus. Moreover, through this cash flow of the firm get improvised. This report focuses on the
evaluation of several concepts of cost by considering information of Jeffrey & Son’s Ltd.
Furthermore, this report also includes the theoretical description and practical application
regarding the cost computation, budget and variance analysis.
1.1 Description of cost classification
Cost can be described as an amount paid or payable by the company or business
organization for obtaining product or services. Thus, the classification of the cost can be done on
the basis of below mentioned factors: Element: This classification is mainly based on the objectives of cost. On the basis of
which cost can be classified into direct or indirect cost. Further, direct cost can be
incurred while doing production activities such as manufacturing, acquiring raw
materials, stocking of work in progress, etc (Burns and et.al, 2004). These activities are
necessary for conducting business. Moreover, indirect cost is incurred in order to attain
economic benefit so that efficiency and profitability of the business can be enhanced.
For Example: Direct cost incurred at the time of purchasing of raw material and indirect cost can
be the amount incurred on selling and distribution expenses. Nature: As per the nature of expenses, cost can be classified into three segments that are
material, labour and overhead expenses. Through this, identification of cost classification
can be done (Dekker, 2015).
For Example: Material cost can be referred to as the amount incurred on variables that are
required for manufacturing such as raw materials. Further, labour cost involves wages and
salaries. Moreover, overhead expenses include other related expenses such rent (Kastantin,
2005).
Paraphrase This Document
Need a fresh take? Get an instant paraphrase of this document with our AI Paraphraser
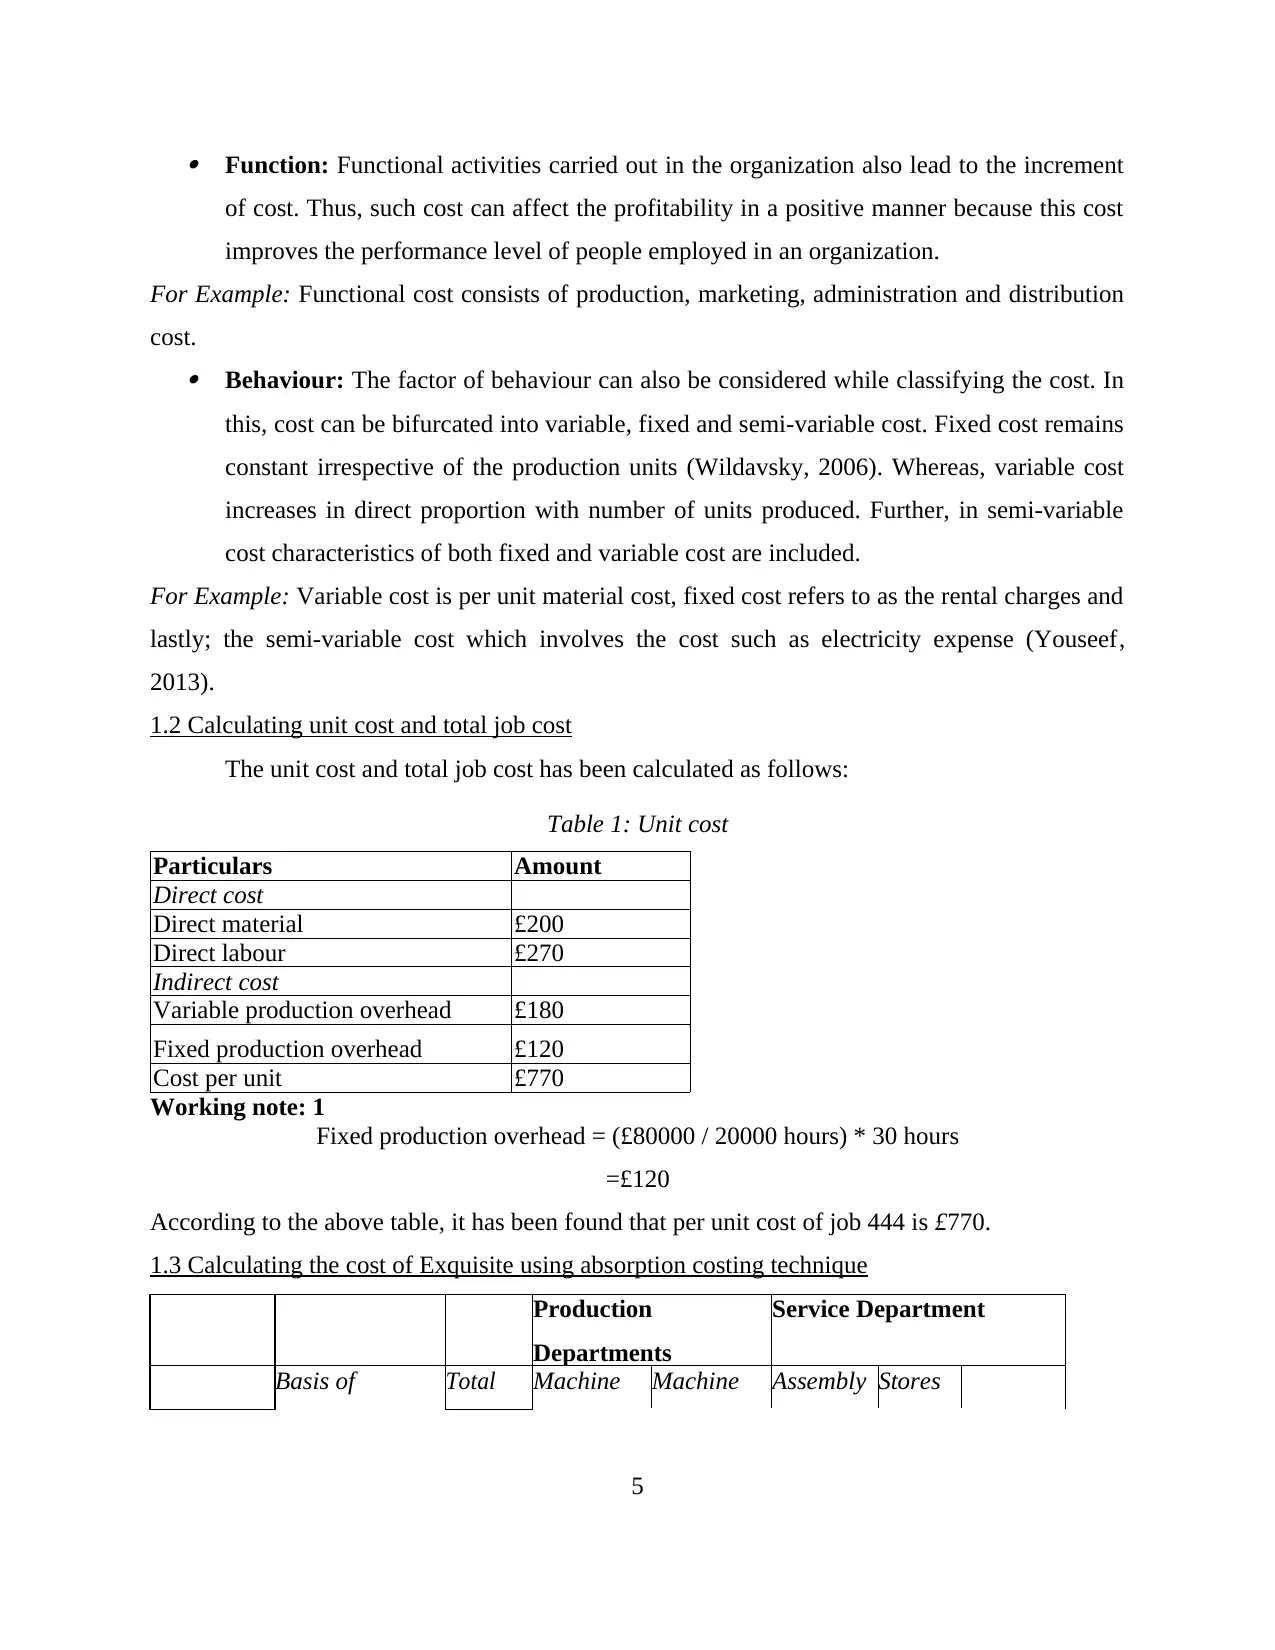
Function: Functional activities carried out in the organization also lead to the increment
of cost. Thus, such cost can affect the profitability in a positive manner because this cost
improves the performance level of people employed in an organization.
For Example: Functional cost consists of production, marketing, administration and distribution
cost. Behaviour: The factor of behaviour can also be considered while classifying the cost. In
this, cost can be bifurcated into variable, fixed and semi-variable cost. Fixed cost remains
constant irrespective of the production units (Wildavsky, 2006). Whereas, variable cost
increases in direct proportion with number of units produced. Further, in semi-variable
cost characteristics of both fixed and variable cost are included.
For Example: Variable cost is per unit material cost, fixed cost refers to as the rental charges and
lastly; the semi-variable cost which involves the cost such as electricity expense (Youseef,
2013).
1.2 Calculating unit cost and total job cost
The unit cost and total job cost has been calculated as follows:
Table 1: Unit cost
Particulars Amount
Direct cost
Direct material £200
Direct labour £270
Indirect cost
Variable production overhead £180
Fixed production overhead £120
Cost per unit £770
Working note: 1
Fixed production overhead = (£80000 / 20000 hours) * 30 hours
=£120
According to the above table, it has been found that per unit cost of job 444 is £770.
1.3 Calculating the cost of Exquisite using absorption costing technique
Production
Departments
Service Department
Basis of Total Machine Machine Assembly Stores
5
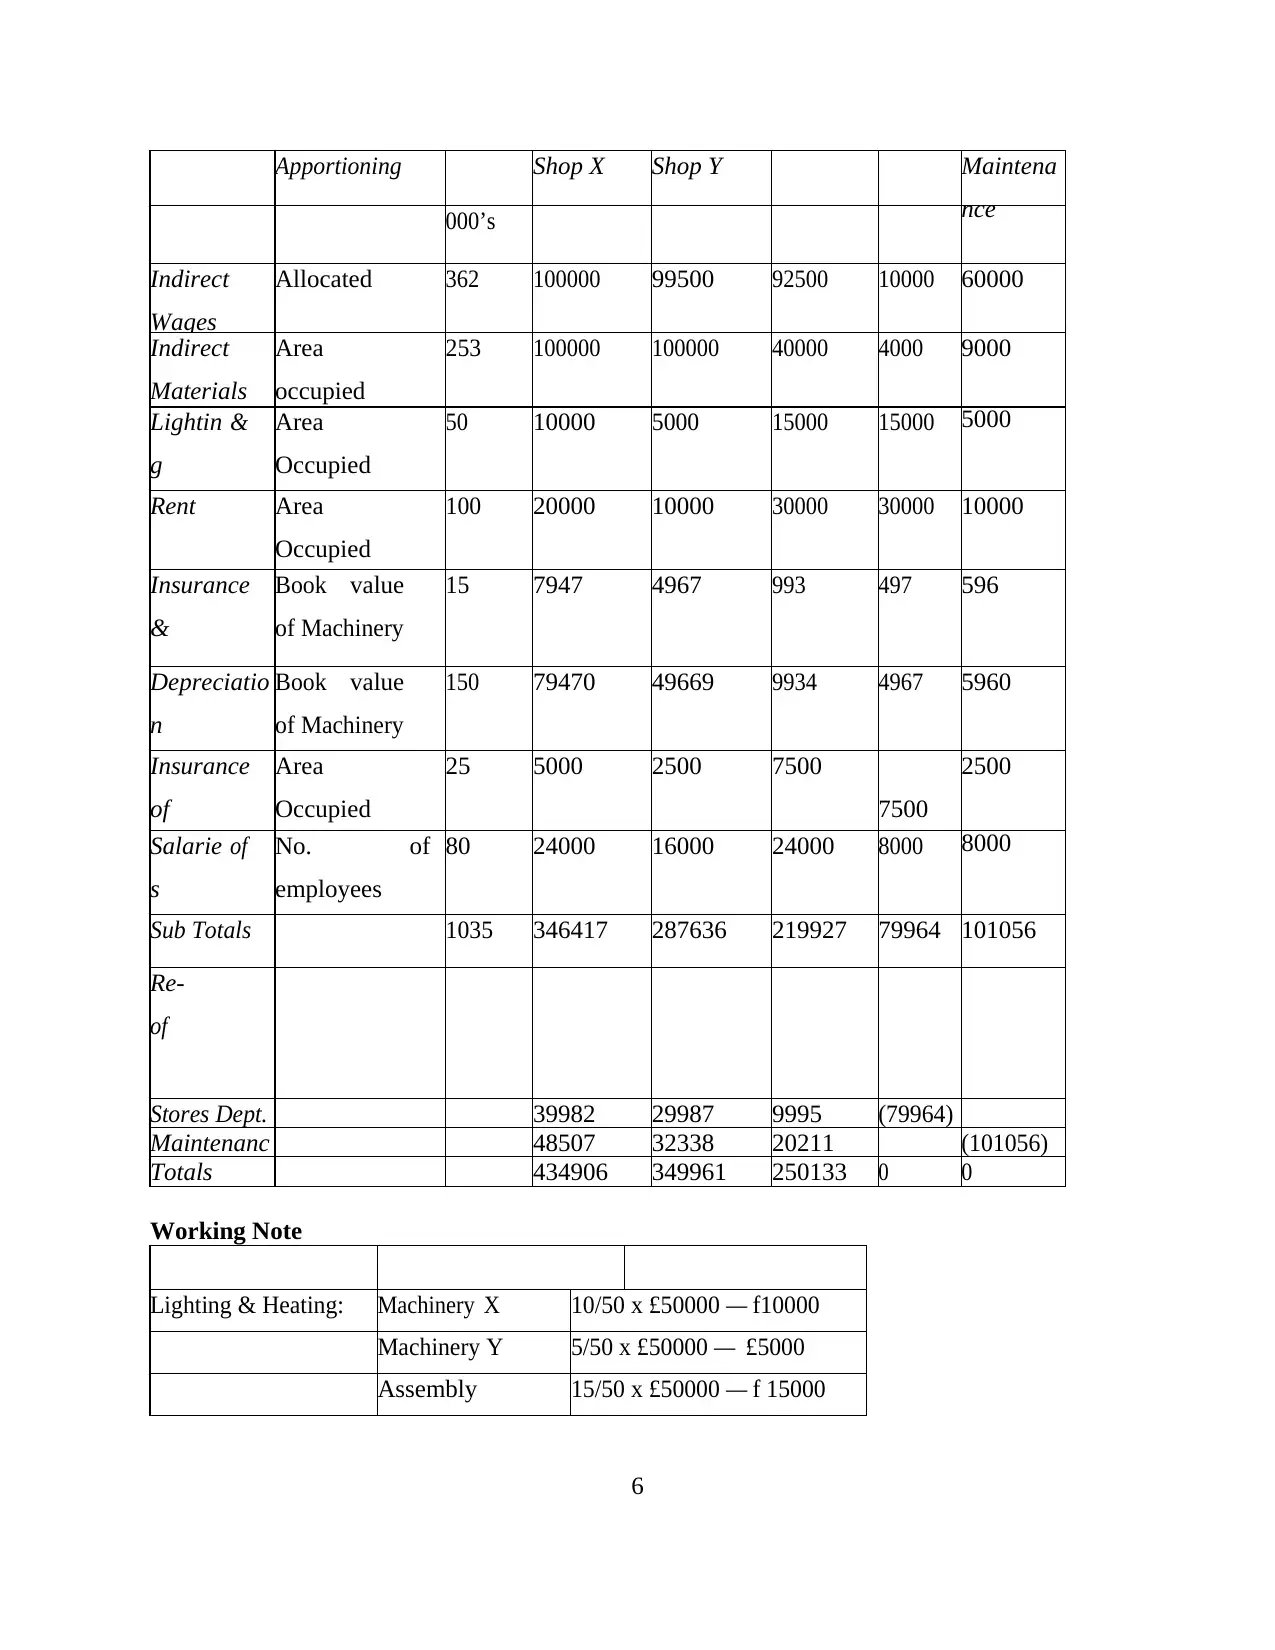
Apportioning Shop X Shop Y Maintena
nce000’s
Indirect
Wages
Allocated 362 100000 99500 92500 10000 60000
Indirect
Materials
Area
occupied
253 100000 100000 40000 4000 9000
Lightin
g
& Area
Occupied
50 10000 5000 15000 15000 5000
Rent Area
Occupied
100 20000 10000 30000 30000 10000
Insurance
&
Book value
of Machinery
15 7947 4967 993 497 596
Depreciatio
n
Book value
of Machinery
150 79470 49669 9934 4967 5960
Insurance
of
Area
Occupied
25 5000 2500 7500
7500
2500
Salarie
s
of No.
employees
of 80 24000 16000 24000 8000 8000
Sub Totals 1035 346417 287636 219927 79964 101056
Re-
of
service dept.Stores Dept. 39982 29987 9995 (79964)
Maintenanc 48507 32338 20211 (101056)
Totals 434906 349961 250133 0 0
Working Note
Lighting & Heating: Machinery X 10/50 x £50000 — f10000
Machinery Y 5/50 x £50000 — £5000
Assembly 15/50 x £50000 — f 15000
6
⊘ This is a preview!⊘
Do you want full access?
Subscribe today to unlock all pages.
Trusted by 1+ million students worldwide
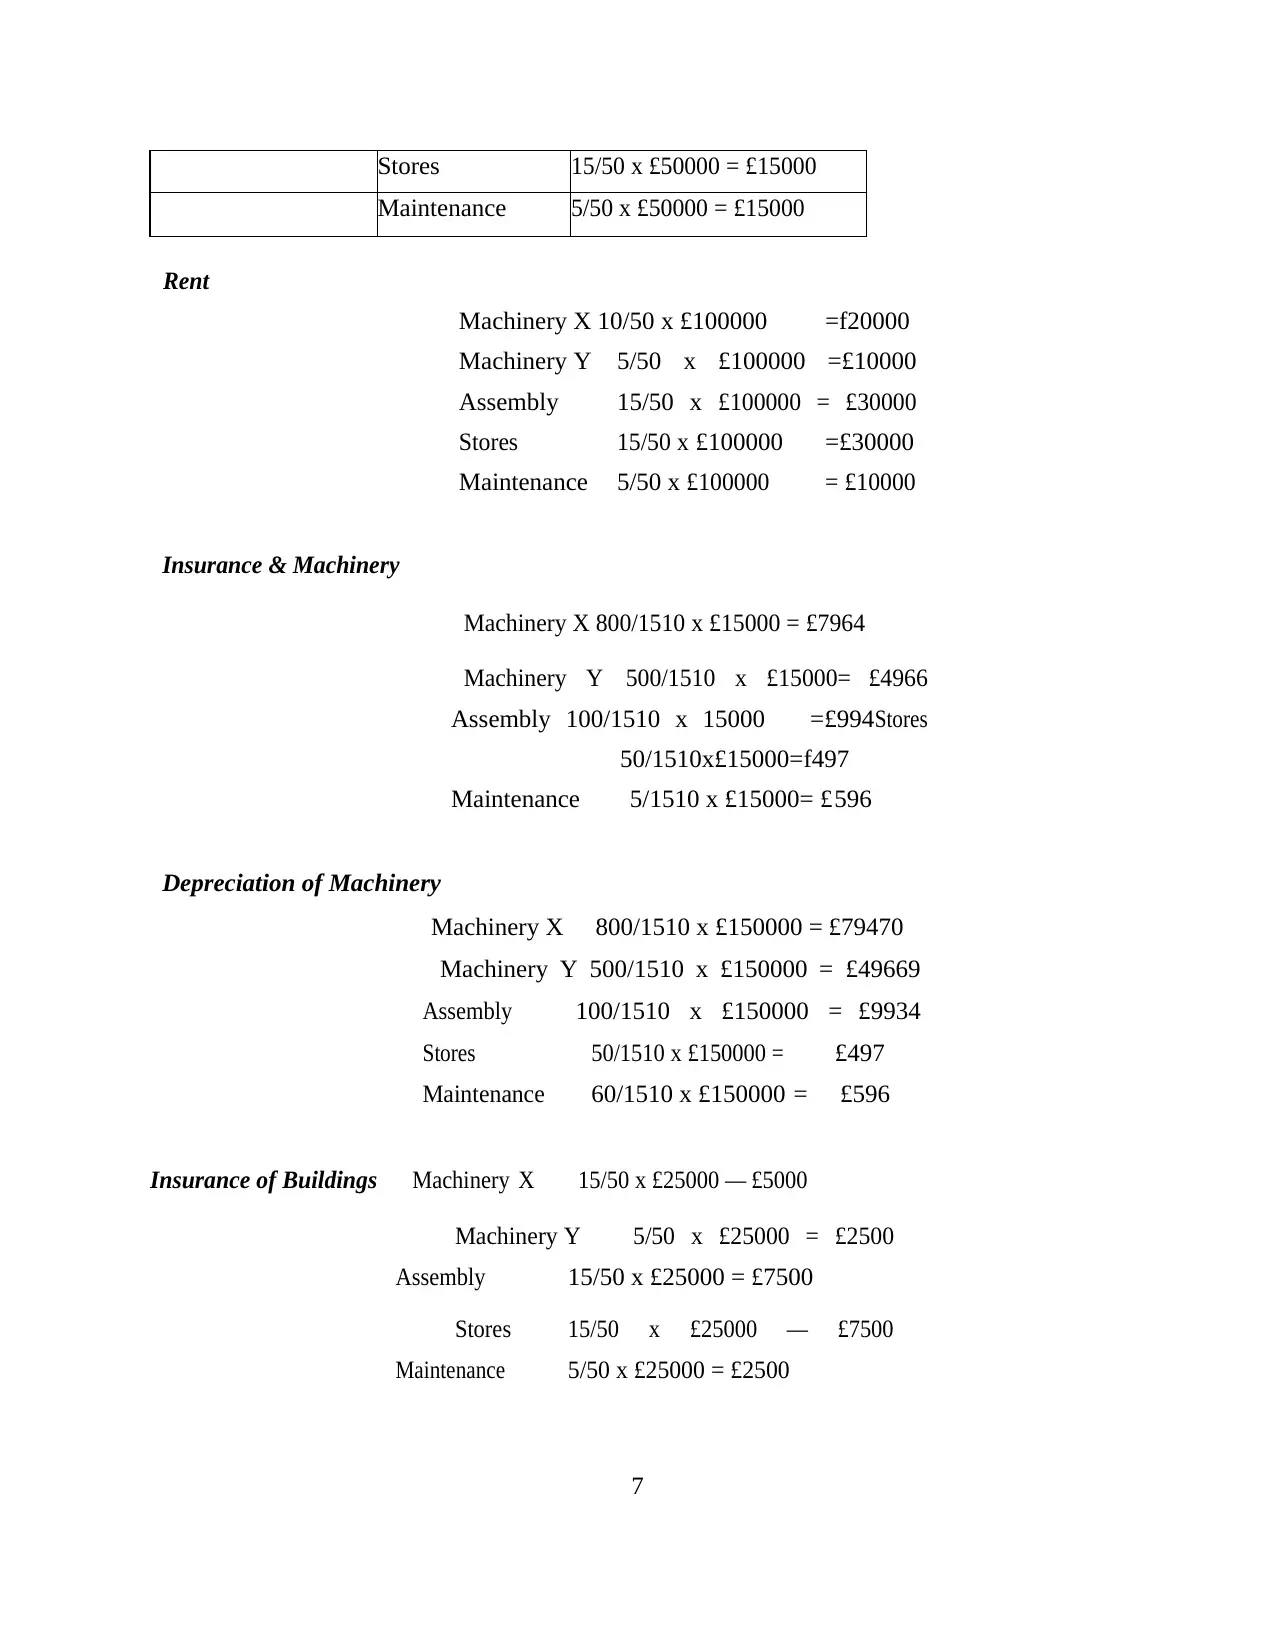
Stores 15/50 x £50000 = £15000
Maintenance 5/50 x £50000 = £15000
Rent
Machinery X 10/50 x £100000 =f20000
Machinery Y 5/50 x £100000 =£10000
Assembly 15/50 x £100000 = £30000
Stores 15/50 x £100000 =£30000
Maintenance 5/50 x £100000 = £10000
Insurance & Machinery
Machinery X 800/1510 x £15000 = £7964
Machinery Y 500/1510 x £15000= £4966
Assembly 100/1510 x 15000 =£994 Stores
50/1510x£15000=f497
Maintenance 5/1510 x £15000= £596
Depreciation of Machinery
Machinery X 800/1510 x £150000 = £79470
Machinery Y 500/1510 x £150000 = £49669
Assembly 100/1510 x £150000 = £9934
Stores 50/1510 x £150000 = £497
Maintenance 60/1510 x £150000 = £596
Insurance of Buildings Machinery X 15/50 x £25000 — £5000
Machinery Y 5/50 x £25000 = £2500
Assembly 15/50 x £25000 = £7500
Stores 15/50 x £25000 — £7500
Maintenance 5/50 x £25000 = £2500
7
Paraphrase This Document
Need a fresh take? Get an instant paraphrase of this document with our AI Paraphraser
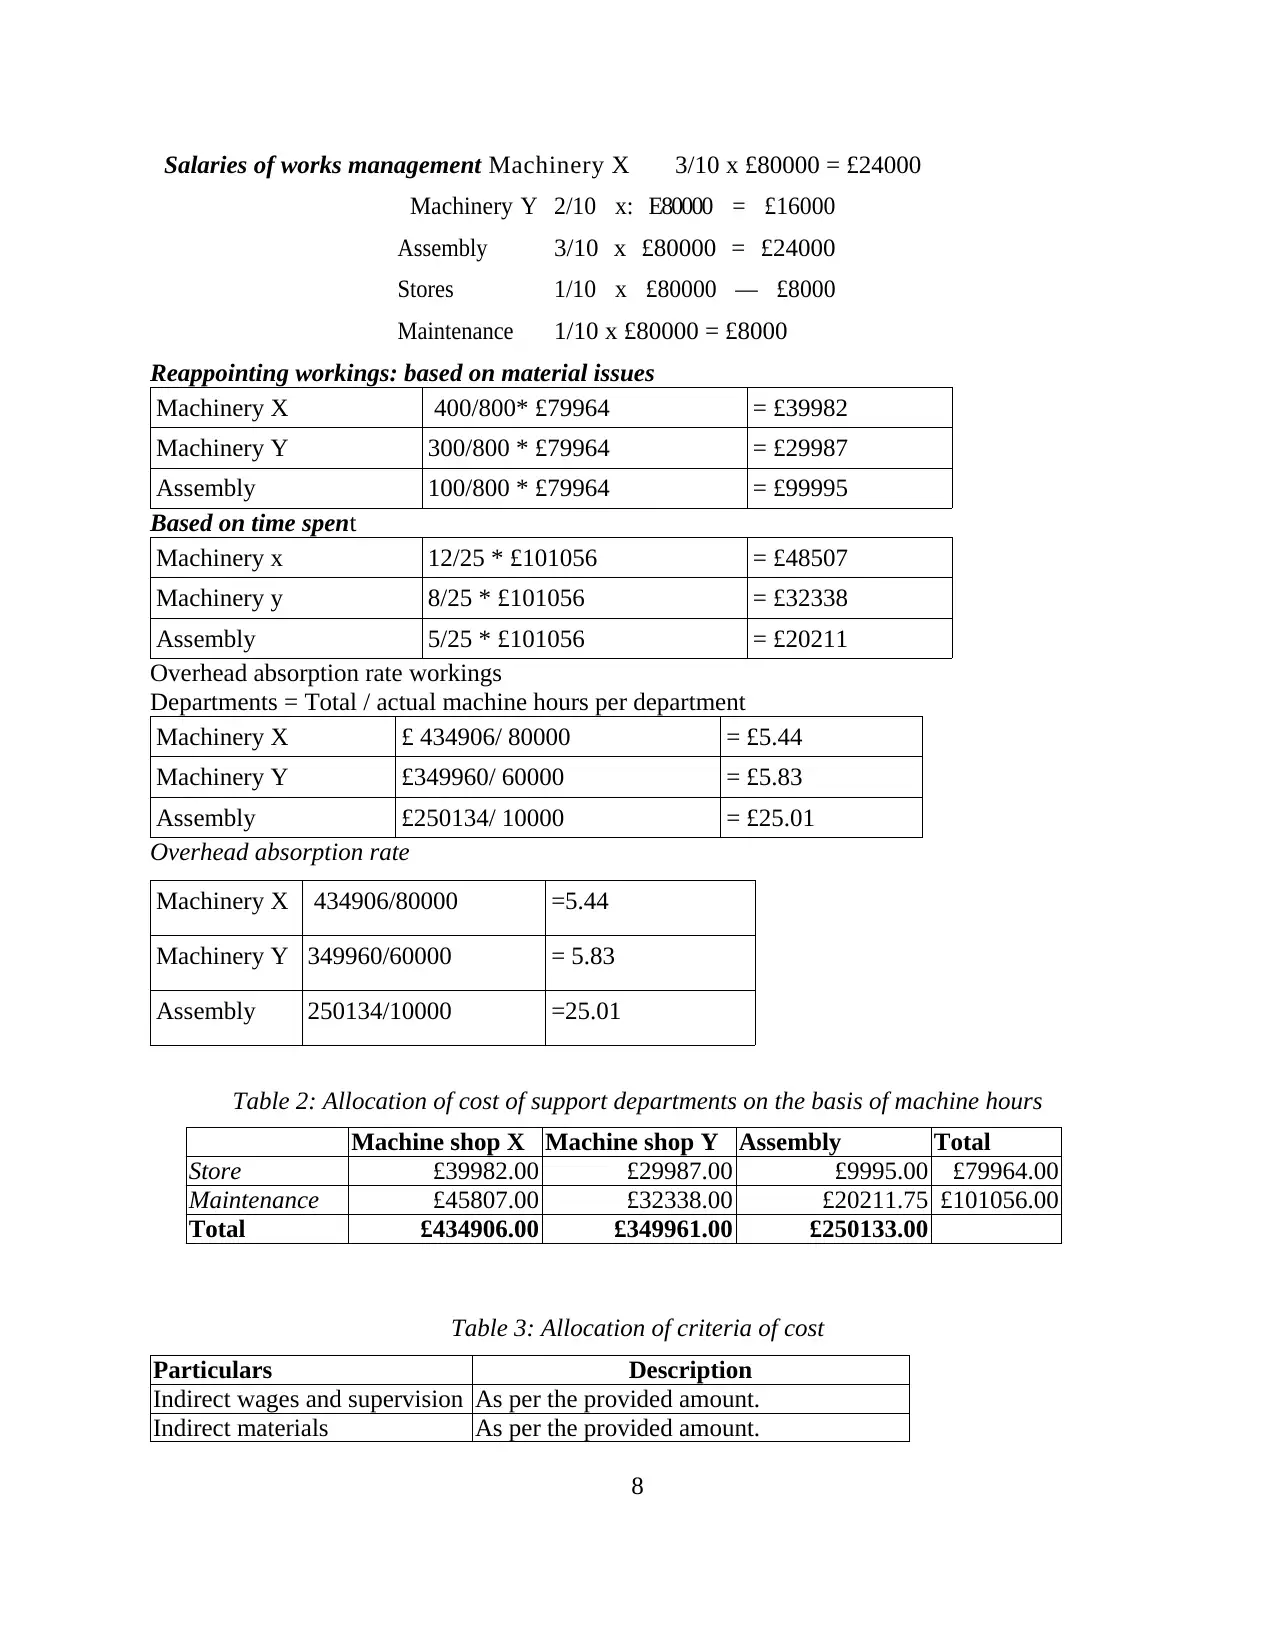
Salaries of works management Machinery X 3/10 x £80000 = £24000
Machinery Y 2/10 x: E80000 = £16000
Assembly 3/10 x £80000 = £24000
Stores 1/10 x £80000 — £8000
Maintenance 1/10 x £80000 = £8000
Reappointing workings: based on material issues
Machinery X 400/800* £79964 = £39982
Machinery Y 300/800 * £79964 = £29987
Assembly 100/800 * £79964 = £99995
Based on time spent
Machinery x 12/25 * £101056 = £48507
Machinery y 8/25 * £101056 = £32338
Assembly 5/25 * £101056 = £20211
Overhead absorption rate workings
Departments = Total / actual machine hours per department
Machinery X £ 434906/ 80000 = £5.44
Machinery Y £349960/ 60000 = £5.83
Assembly £250134/ 10000 = £25.01
Overhead absorption rate
Machinery X 434906/80000 =5.44
Machinery Y 349960/60000 = 5.83
Assembly 250134/10000 =25.01
Table 2: Allocation of cost of support departments on the basis of machine hours
Machine shop X Machine shop Y Assembly Total
Store £39982.00 £29987.00 £9995.00 £79964.00
Maintenance £45807.00 £32338.00 £20211.75 £101056.00
Total £434906.00 £349961.00 £250133.00
Table 3: Allocation of criteria of cost
Particulars Description
Indirect wages and supervision As per the provided amount.
Indirect materials As per the provided amount.
8
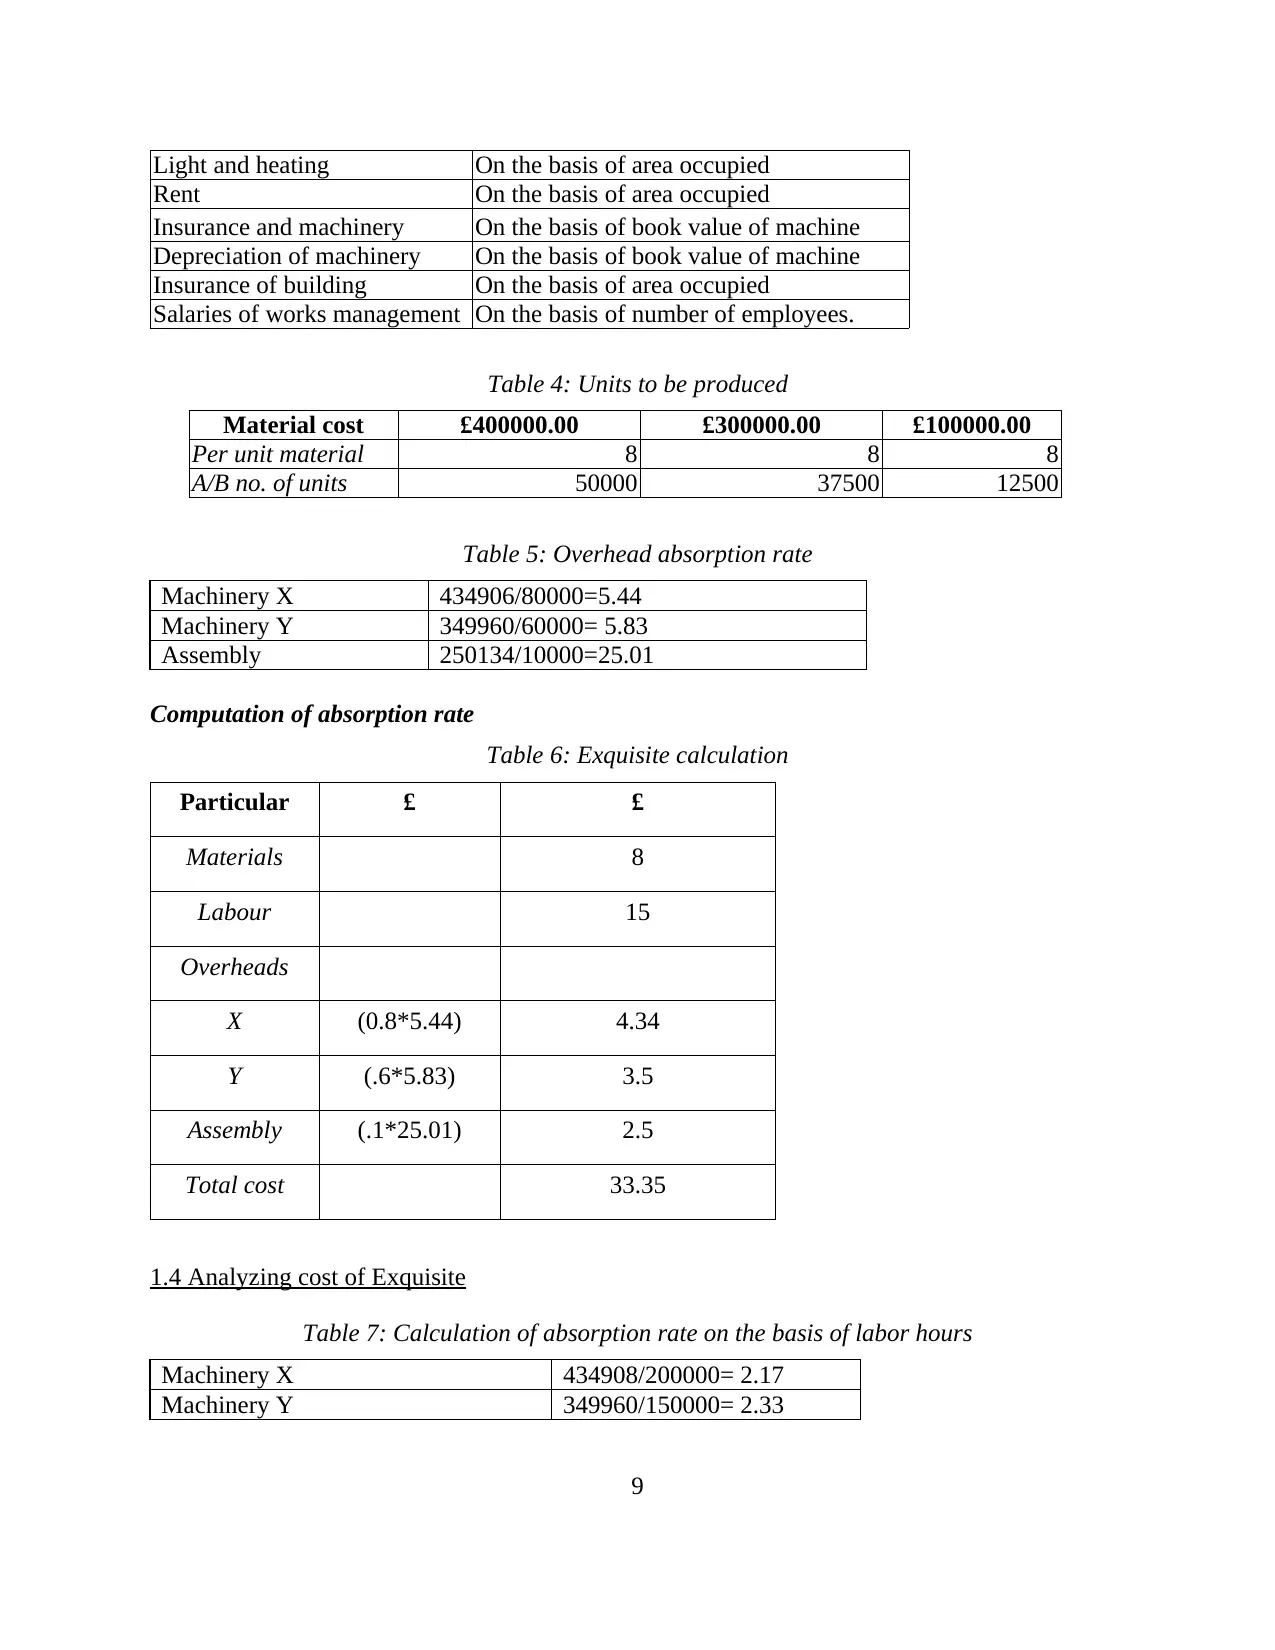
Light and heating On the basis of area occupied
Rent On the basis of area occupied
Insurance and machinery On the basis of book value of machine
Depreciation of machinery On the basis of book value of machine
Insurance of building On the basis of area occupied
Salaries of works management On the basis of number of employees.
Table 4: Units to be produced
Material cost £400000.00 £300000.00 £100000.00
Per unit material 8 8 8
A/B no. of units 50000 37500 12500
Table 5: Overhead absorption rate
Machinery X 434906/80000=5.44
Machinery Y 349960/60000= 5.83
Assembly 250134/10000=25.01
Computation of absorption rate
Table 6: Exquisite calculation
Particular £ £
Materials 8
Labour 15
Overheads
X (0.8*5.44) 4.34
Y (.6*5.83) 3.5
Assembly (.1*25.01) 2.5
Total cost 33.35
1.4 Analyzing cost of Exquisite
Table 7: Calculation of absorption rate on the basis of labor hours
Machinery X 434908/200000= 2.17
Machinery Y 349960/150000= 2.33
9
⊘ This is a preview!⊘
Do you want full access?
Subscribe today to unlock all pages.
Trusted by 1+ million students worldwide
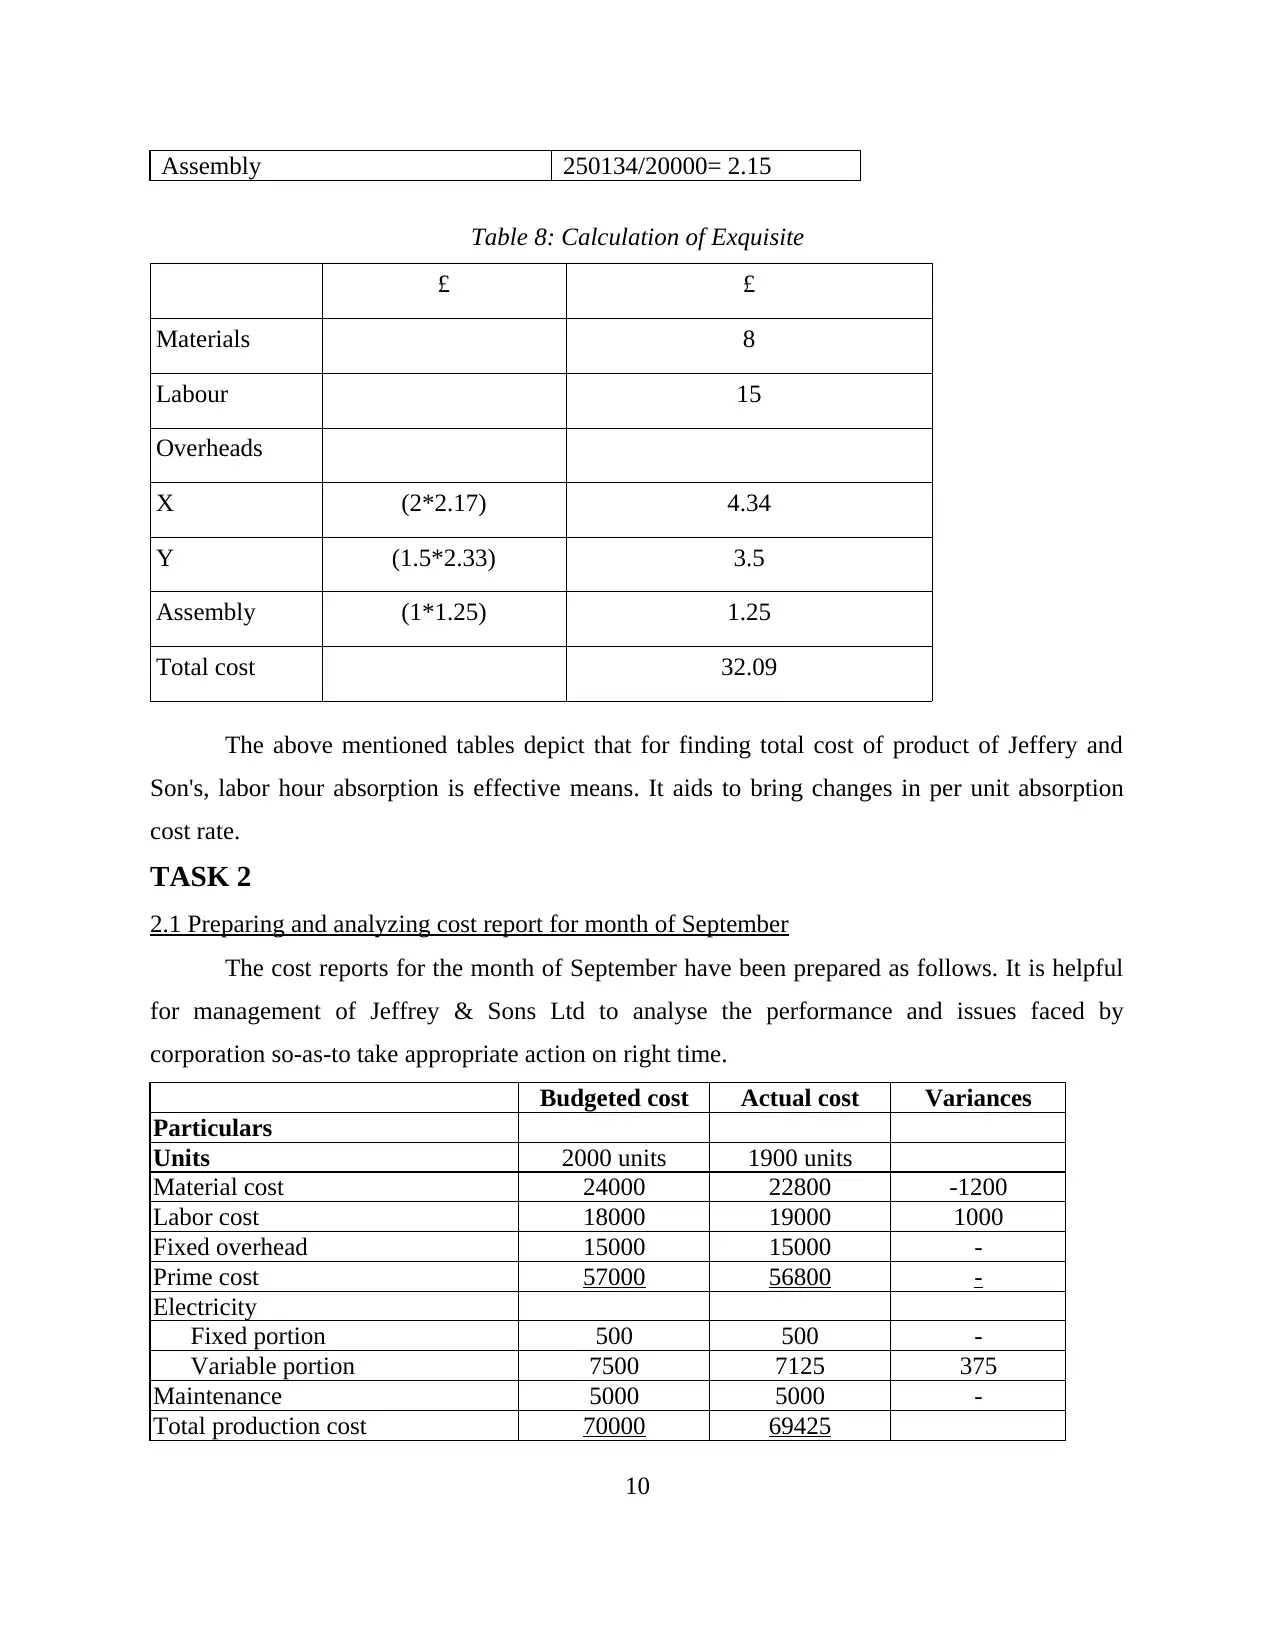
Assembly 250134/20000= 2.15
Table 8: Calculation of Exquisite
£ £
Materials 8
Labour 15
Overheads
X (2*2.17) 4.34
Y (1.5*2.33) 3.5
Assembly (1*1.25) 1.25
Total cost 32.09
The above mentioned tables depict that for finding total cost of product of Jeffery and
Son's, labor hour absorption is effective means. It aids to bring changes in per unit absorption
cost rate.
TASK 2
2.1 Preparing and analyzing cost report for month of September
The cost reports for the month of September have been prepared as follows. It is helpful
for management of Jeffrey & Sons Ltd to analyse the performance and issues faced by
corporation so-as-to take appropriate action on right time.
Budgeted cost Actual cost Variances
Particulars
Units 2000 units 1900 units
Material cost 24000 22800 -1200
Labor cost 18000 19000 1000
Fixed overhead 15000 15000 -
Prime cost 57000 56800 -
Electricity
Fixed portion 500 500 -
Variable portion 7500 7125 375
Maintenance 5000 5000 -
Total production cost 70000 69425
10
Paraphrase This Document
Need a fresh take? Get an instant paraphrase of this document with our AI Paraphraser
Budgeted cost Budgeted cost
Particulars
Units 2000 units 1900 units
Material cost 24000 22800
Labor cost 18000 17100
Fixed overhead 15000 15000
Prime cost 57000 54900
Electricity
Fixed portion 500 500
Variable portion 7500 7125
Maintenance 5000 5000
Total production cost 70000 67525
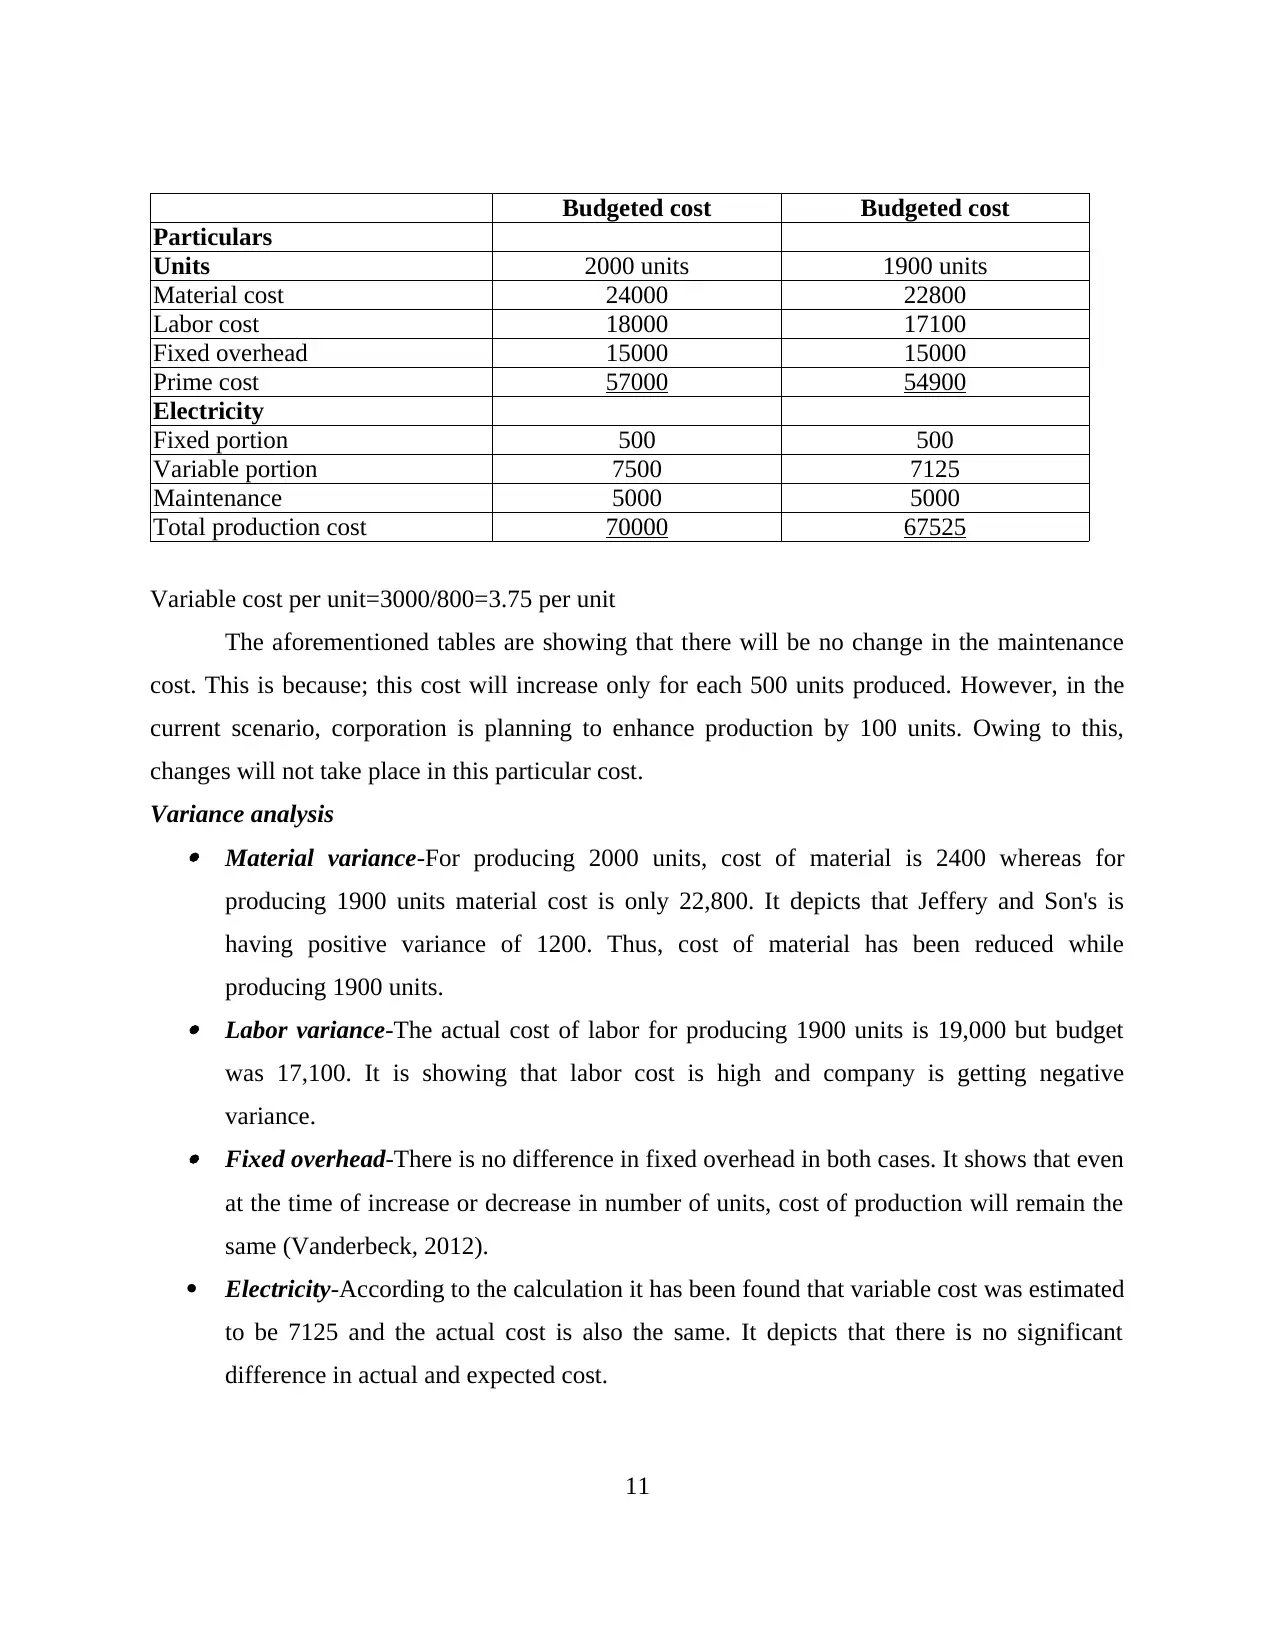
Variable cost per unit=3000/800=3.75 per unit
The aforementioned tables are showing that there will be no change in the maintenance
cost. This is because; this cost will increase only for each 500 units produced. However, in the
current scenario, corporation is planning to enhance production by 100 units. Owing to this,
changes will not take place in this particular cost.
Variance analysis Material variance-For producing 2000 units, cost of material is 2400 whereas for
producing 1900 units material cost is only 22,800. It depicts that Jeffery and Son's is
having positive variance of 1200. Thus, cost of material has been reduced while
producing 1900 units. Labor variance-The actual cost of labor for producing 1900 units is 19,000 but budget
was 17,100. It is showing that labor cost is high and company is getting negative
variance. Fixed overhead-There is no difference in fixed overhead in both cases. It shows that even
at the time of increase or decrease in number of units, cost of production will remain the
same (Vanderbeck, 2012).
Electricity-According to the calculation it has been found that variable cost was estimated
to be 7125 and the actual cost is also the same. It depicts that there is no significant
difference in actual and expected cost.
11
Particulars
Units 2000 units 1900 units
Material cost 24000 22800
Labor cost 18000 17100
Fixed overhead 15000 15000
Prime cost 57000 54900
Electricity
Fixed portion 500 500
Variable portion 7500 7125
Maintenance 5000 5000
Total production cost 70000 67525
Variable cost per unit=3000/800=3.75 per unit
The aforementioned tables are showing that there will be no change in the maintenance
cost. This is because; this cost will increase only for each 500 units produced. However, in the
current scenario, corporation is planning to enhance production by 100 units. Owing to this,
changes will not take place in this particular cost.
Variance analysis Material variance-For producing 2000 units, cost of material is 2400 whereas for
producing 1900 units material cost is only 22,800. It depicts that Jeffery and Son's is
having positive variance of 1200. Thus, cost of material has been reduced while
producing 1900 units. Labor variance-The actual cost of labor for producing 1900 units is 19,000 but budget
was 17,100. It is showing that labor cost is high and company is getting negative
variance. Fixed overhead-There is no difference in fixed overhead in both cases. It shows that even
at the time of increase or decrease in number of units, cost of production will remain the
same (Vanderbeck, 2012).
Electricity-According to the calculation it has been found that variable cost was estimated
to be 7125 and the actual cost is also the same. It depicts that there is no significant
difference in actual and expected cost.
11
2.2 Using various performance indicator to identify areas of improvement
The performance appraisal of organization is crucial task which assists management to
concentrate on key performance indicator (Key Performance Indicators, 2014). These key
performance indicators are the effective means through which improvement can take place in
internal or external environment of Jeffrey & Sons Ltd. Key performance indicators are
explained as follows- Qualitative indicators-Performance of corporation can be assessed with the help of
qualitative indicators like increased customer base, high sales turnover and retention of
buyers. In case the indicators are not shown, then company might take decision to bring
improvement in its internal business environment (Weygandt and et.al., 2009). It shows
that management needs to focus on potential areas like marketing strategies, retention etc.
Thus, qualitative performance indicators help to ensure continuous improvement at
workplace so-as-to deliver higher level of satisfaction among buyers.
Quantitative indicators-The qualitative performance indicators include factors like high
rate of return, sales turnover and cost of production. According to findings, management
assess what kind of strategies could be adopted to ensure good performance (Elmassri
and Harris, 2011). Thus, all of these indicators depict that who should be improved and
how. Furthermore, high cost of production shows that company is not focusing on its
production activities. Therefore, changes can be done in an effectual manner.
2.3 Suggesting ways to reduce cost, enhance value and quality
There are different ways to reduce cost and enhance value as well quality of Jeffrey &
Sons Ltd. These are explained as follows- Total quality management- Under this, company can assess issues that are taking place
in production process. It assists management to ensure that good quality of products and
services are delivered to end users. On the other hand, as per the total quality
management, aspect management of Jeffrey & Sons Ltd can meet the expectations of
buyers in the most effective manner (Kate-Riin Kont, 2012). This in turn leads to increase
in rate of return and decrease in cost of production to a great extent. However, at the
initial stage, non-monetary cost can be incurred but it will enhance quality.
12
⊘ This is a preview!⊘
Do you want full access?
Subscribe today to unlock all pages.
Trusted by 1+ million students worldwide
1 out of 25
Related Documents


Your All-in-One AI-Powered Toolkit for Academic Success.
+13062052269
info@desklib.com
Available 24*7 on WhatsApp / Email
![[object Object]](/_next/static/media/star-bottom.7253800d.svg)
Unlock your academic potential
Copyright © 2020–2026 A2Z Services. All Rights Reserved. Developed and managed by ZUCOL.