Accounting for Decision Making: Financial Statement Analysis Report
VerifiedAdded on 2021/06/17
|14
|3224
|148
Report
AI Summary
This report delves into the core principles of accounting for decision-making, emphasizing the evaluation of a company's financial performance through both financial statement analysis and ratio analysis. The report contrasts accounting profits with cash flow, highlighting the preference for cash flow in evaluating a company's true financial position due to its reliability and resistance to manipulation. It examines the roles of internal and external users of financial statements, detailing their specific needs and how they utilize financial information. Furthermore, the report critically assesses the limitations of financial statements, such as their reliance on historical costs and potential for manipulation. Finally, the report includes an analysis of Briscoe Group Limited, evaluating its financial health through key ratios like current ratio, quick ratio, and profitability ratios, along with an examination of its share price performance and recent announcements to aid in an investment decision between purchasing Briscoe Group Limited shares or investing in a term deposit.
RUNNING HEAD: ACCOUNTING
Accounting for decision making
Accounting for decision making
Paraphrase This Document
Need a fresh take? Get an instant paraphrase of this document with our AI Paraphraser
Accounting 2
Question 1
In general, the evaluation of a company involves two aspects, first deals with presentation of
financial statements and second deal with analysis of the same. Normally, while measuring
the performance of an enterprise, two factors on which the analysis is based are net profit and
cash flow. These are the two aspects which clearly reflects financial position of the company
and presents a true and fair view of it (Charifzadeh, & Taschner, 2017).
Accounting profits is the excess amount of total income over total expenses. It is the value
which is derived by deducting all the expenditures from the total revenue earned. (Knight,
2012). On the other hand, cash flow is the inside and outside movement of cash within the
business. The inflow and outflow of cash is represented by cash flow statement and is
recorded on cash basis (Periasamy, 2009). The main difference between the two is the way in
which they are recorded in the books of accounts. Profit is recorded on accrual basis and cash
flow is reported on cash basis.
However, at time of evaluating users generally prefer or rely on cash flow rather than or
profits. Reason being,
Since the profits are recorded and reported on accrual basis, they do not provide a
true representation of actual profits and may prove to be wrong in near future. The
transactions in income statement are reported as per accrual accounting and there is a
possibility of them getting deferred or change in future (Boex, 2015).
The calculation of profit include non-cash items such as depreciation and
amortization while the same are not included in cash flow statement. It is true that the
asset of the company reduces its value over the time and that’s why it is necessary to
record the amount of depreciation. But in actual, such amount is not been paid by the
company and thus it does not affect the profits (Fernandez, 2006).
Accounting 3
Another reason is that the management of an organization can easily manipulate the
accounting profits as compare to cash flow. The figure of the profit can be easily
exaggerated by the mangers by reporting a transaction on accrual basis (CPA. 2018).
The cash flow is a performance measure from the shareholders’ perspective while the
profit only evaluates the outcome of the company’s operations (Fernandez, 2006).
From the above reasons, it can be said that user should rely more on cash flow rather than
accounting profits at time of evaluating or measuring a company’s performance. Also the
cash flows are generally easy to forecast as compare to profits and they reflect the true
liquidity position. Critical evaluation of cash flow helps in knowing about the future trends
that will prevail in the business and also reflects the cash position of the company.
Accounting profits are not reliable and can be modified, thus not reflecting a true position of
the entity. Therefore, it is important to take into account, the cash flow of the company while
evaluating or determining its position and situation within the industry (Berk & DeMarzo,
2010).
Question 2
The financial statements mentioned in the annual report of a company are used by many
people for their own purposes. As these statements clearly represent the financial view of an
organizations, users evaluate them as per their needs and requirements. However, there are
many users of financial statements classified as internal and external. Both the type of users
are as follows:
Internal users
Management: The Company’s managers uses the information for understanding the
profitability, liquidity and efficiency of the business and analyse them to take
⊘ This is a preview!⊘
Do you want full access?
Subscribe today to unlock all pages.
Trusted by 1+ million students worldwide
Accounting 4
important decisions related to its operations and management (Dick & Missonier-
Piera, 2011).
Employees: They are those people who form an organization and work for it in return
of a compensation. They look up to the statements to know about the profits of the
company so that they can demand for bonus and salary increment.
Owners: They are the people who owned the organization or entity. For analysing and
measuring the viability and profitability of their investment they look up to the
financial statements and the key ratios of the firm (Alexander, Britton & Jorissen,
2007).
External users
Creditors and suppliers: They evaluate the final accounts of a company to know about
its creditworthiness and its ability to pay them back on time.
Investors: For knowing about the feasibility of their investment in a firm, they analyse
the final accounts of that firm. By critically reviewing the statements, they came to
know about the percentage of return offered by the organization and can decide to
continue with the investment or not.
Government: To ensure that the entity complies with all the regulatory requirements
and pay the tax liability on time, the government official require to check its financial
records.
Competitors: Entities generally functions in a competitive environment where a cut
throat competition prevails. In order to evaluate the financial conditions, competing
companies access each other financial data and gain knowledge regarding the same
(Palepu & Healy, 2007).
Paraphrase This Document
Need a fresh take? Get an instant paraphrase of this document with our AI Paraphraser
Accounting 5
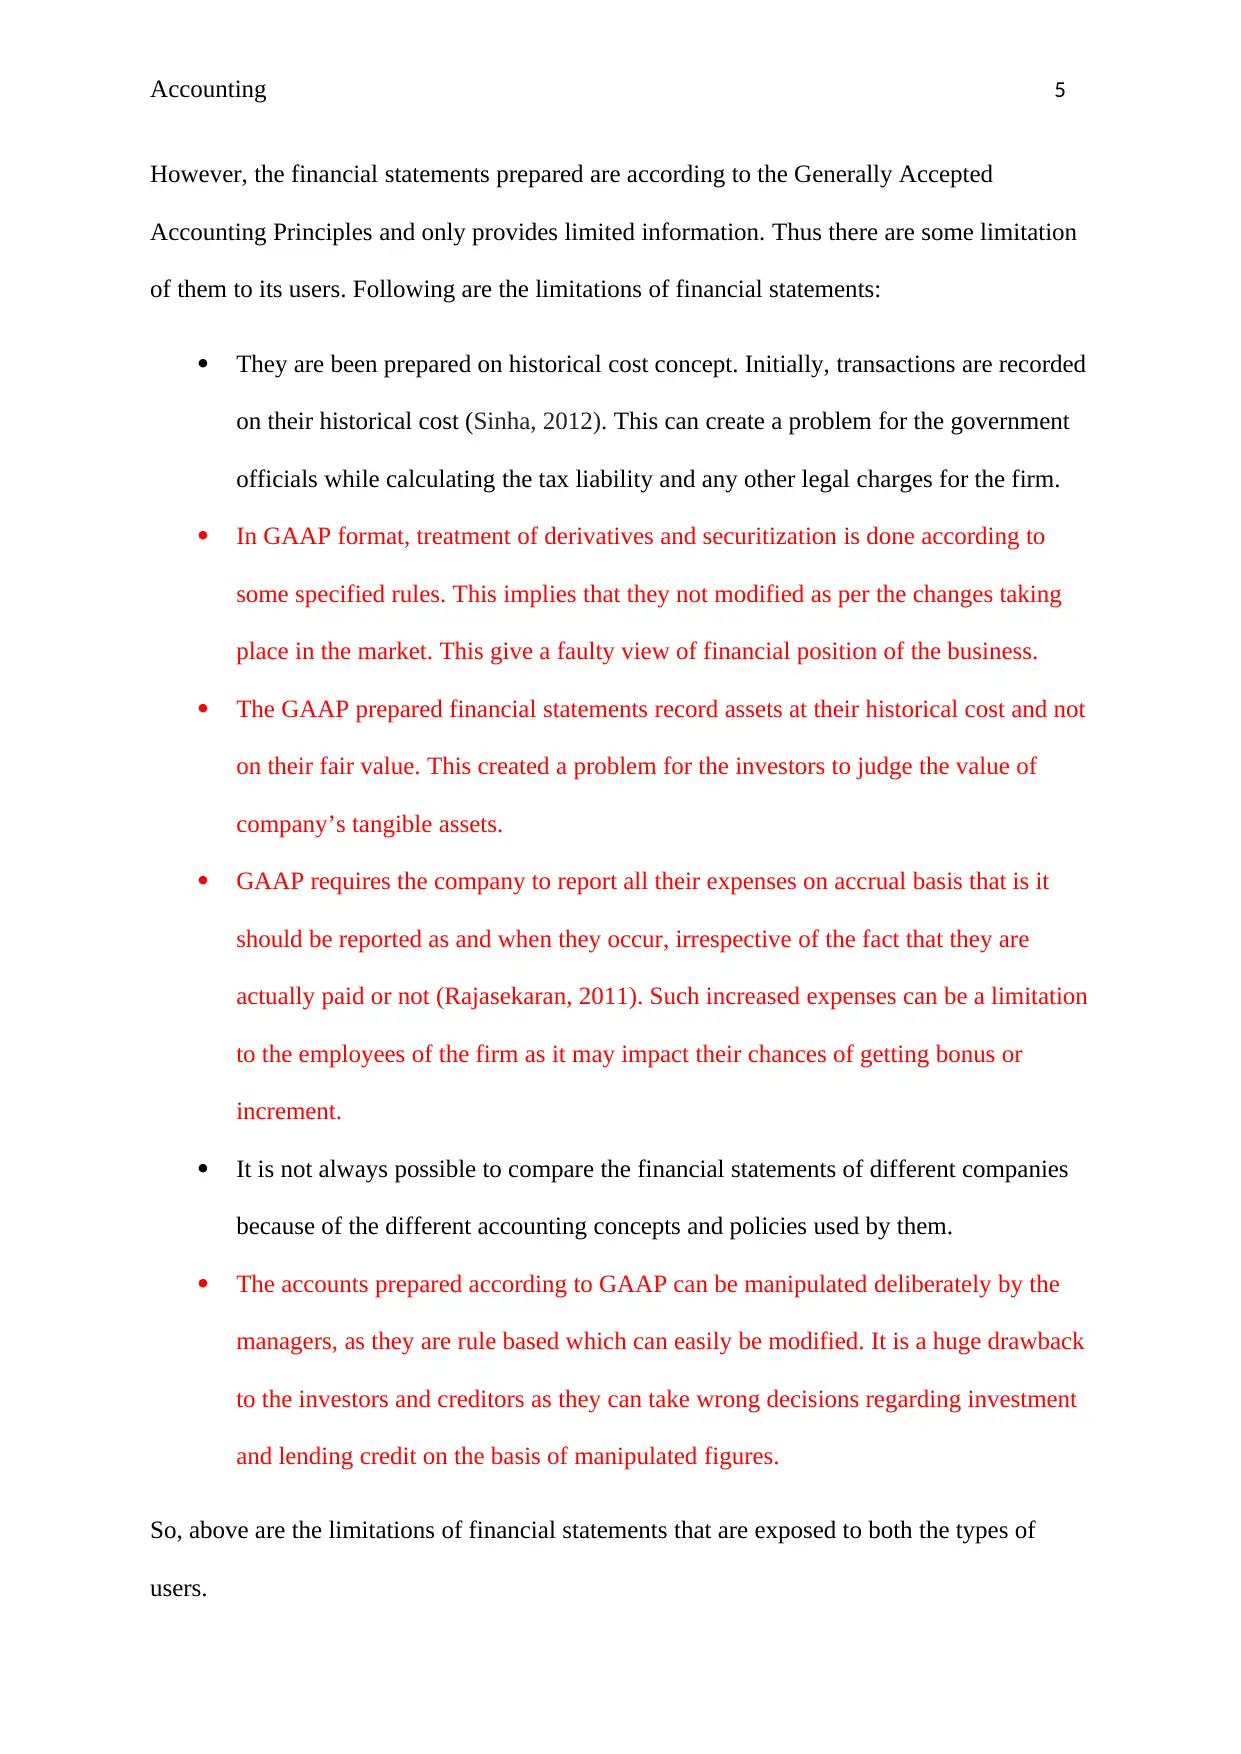
However, the financial statements prepared are according to the Generally Accepted
Accounting Principles and only provides limited information. Thus there are some limitation
of them to its users. Following are the limitations of financial statements:
They are been prepared on historical cost concept. Initially, transactions are recorded
on their historical cost (Sinha, 2012). This can create a problem for the government
officials while calculating the tax liability and any other legal charges for the firm.
In GAAP format, treatment of derivatives and securitization is done according to
some specified rules. This implies that they not modified as per the changes taking
place in the market. This give a faulty view of financial position of the business.
The GAAP prepared financial statements record assets at their historical cost and not
on their fair value. This created a problem for the investors to judge the value of
company’s tangible assets.
GAAP requires the company to report all their expenses on accrual basis that is it
should be reported as and when they occur, irrespective of the fact that they are
actually paid or not (Rajasekaran, 2011). Such increased expenses can be a limitation
to the employees of the firm as it may impact their chances of getting bonus or
increment.
It is not always possible to compare the financial statements of different companies
because of the different accounting concepts and policies used by them.
The accounts prepared according to GAAP can be manipulated deliberately by the
managers, as they are rule based which can easily be modified. It is a huge drawback
to the investors and creditors as they can take wrong decisions regarding investment
and lending credit on the basis of manipulated figures.
So, above are the limitations of financial statements that are exposed to both the types of
users.
Accounting 6
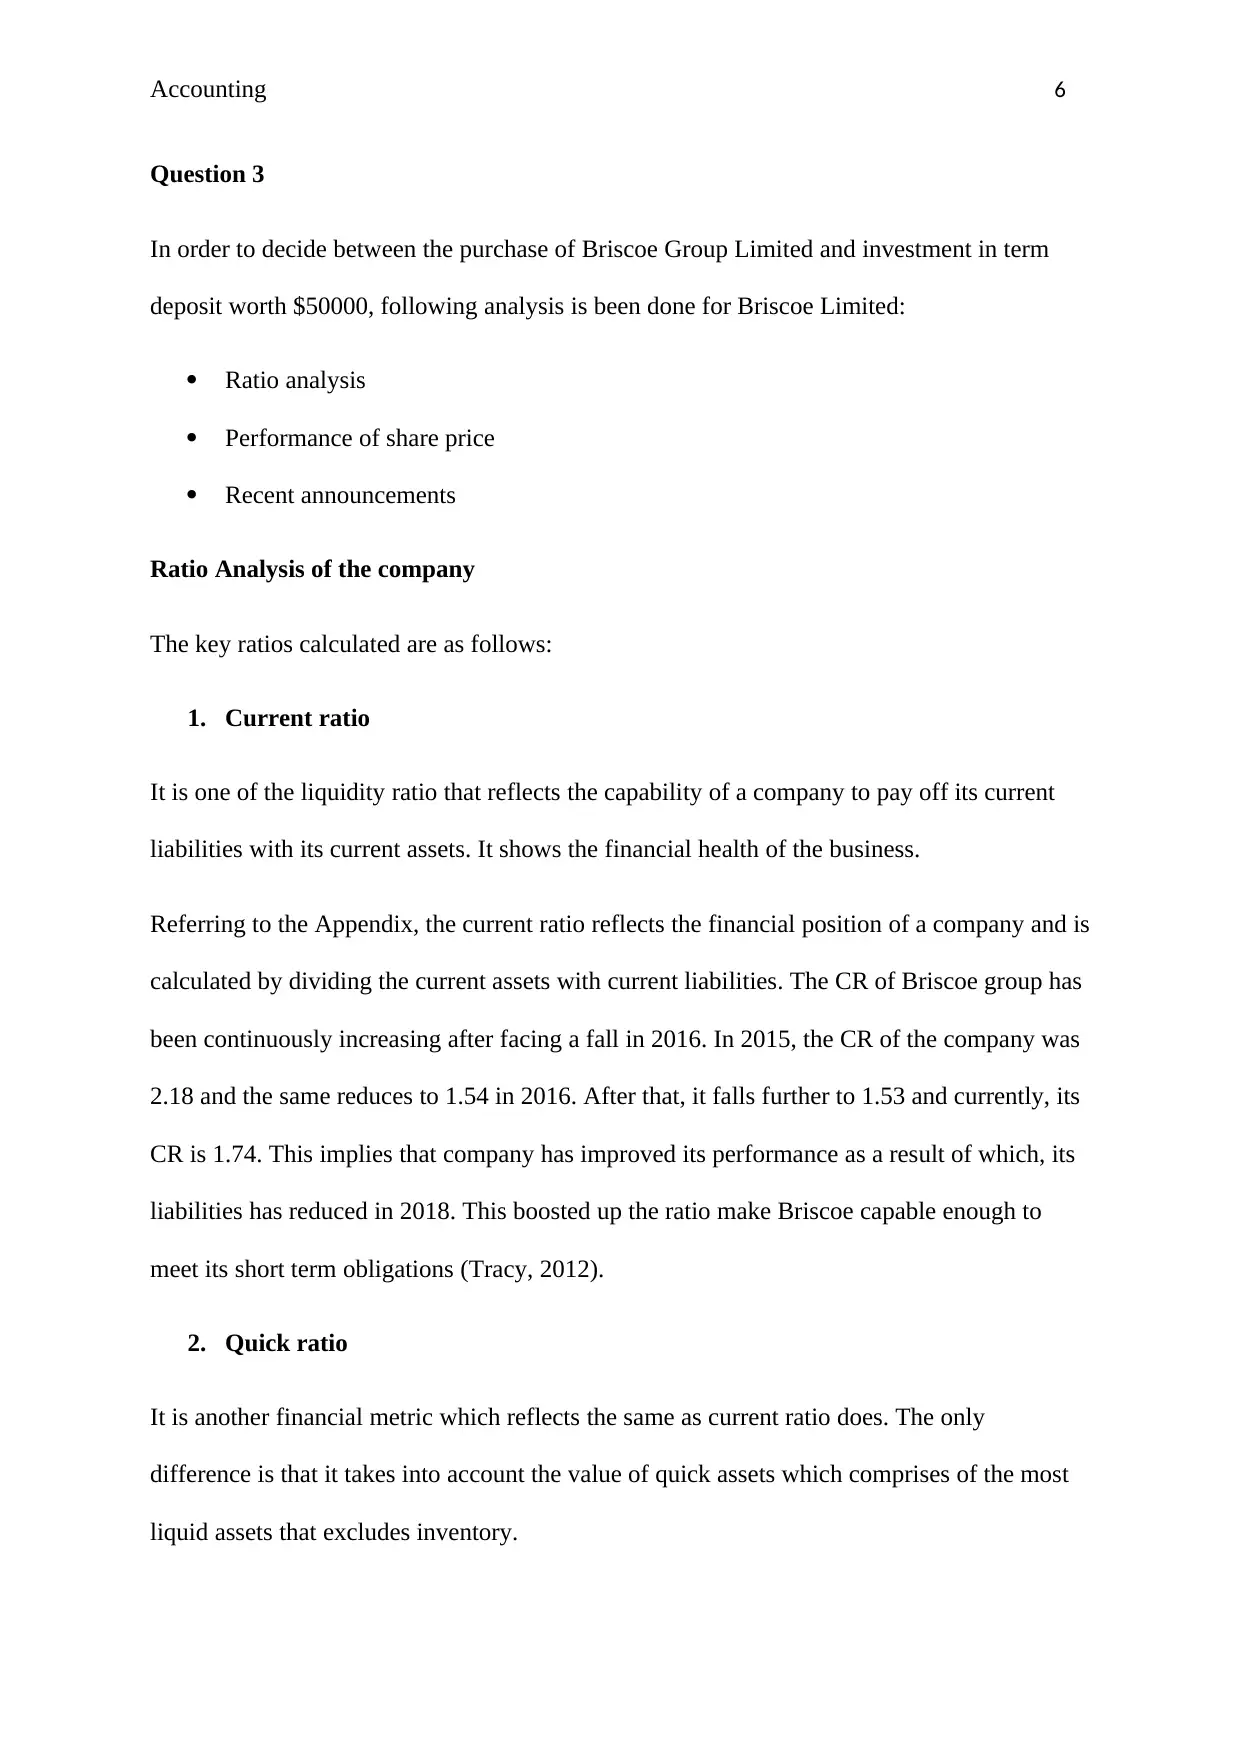
Question 3
In order to decide between the purchase of Briscoe Group Limited and investment in term
deposit worth $50000, following analysis is been done for Briscoe Limited:
Ratio analysis
Performance of share price
Recent announcements
Ratio Analysis of the company
The key ratios calculated are as follows:
1. Current ratio
It is one of the liquidity ratio that reflects the capability of a company to pay off its current
liabilities with its current assets. It shows the financial health of the business.
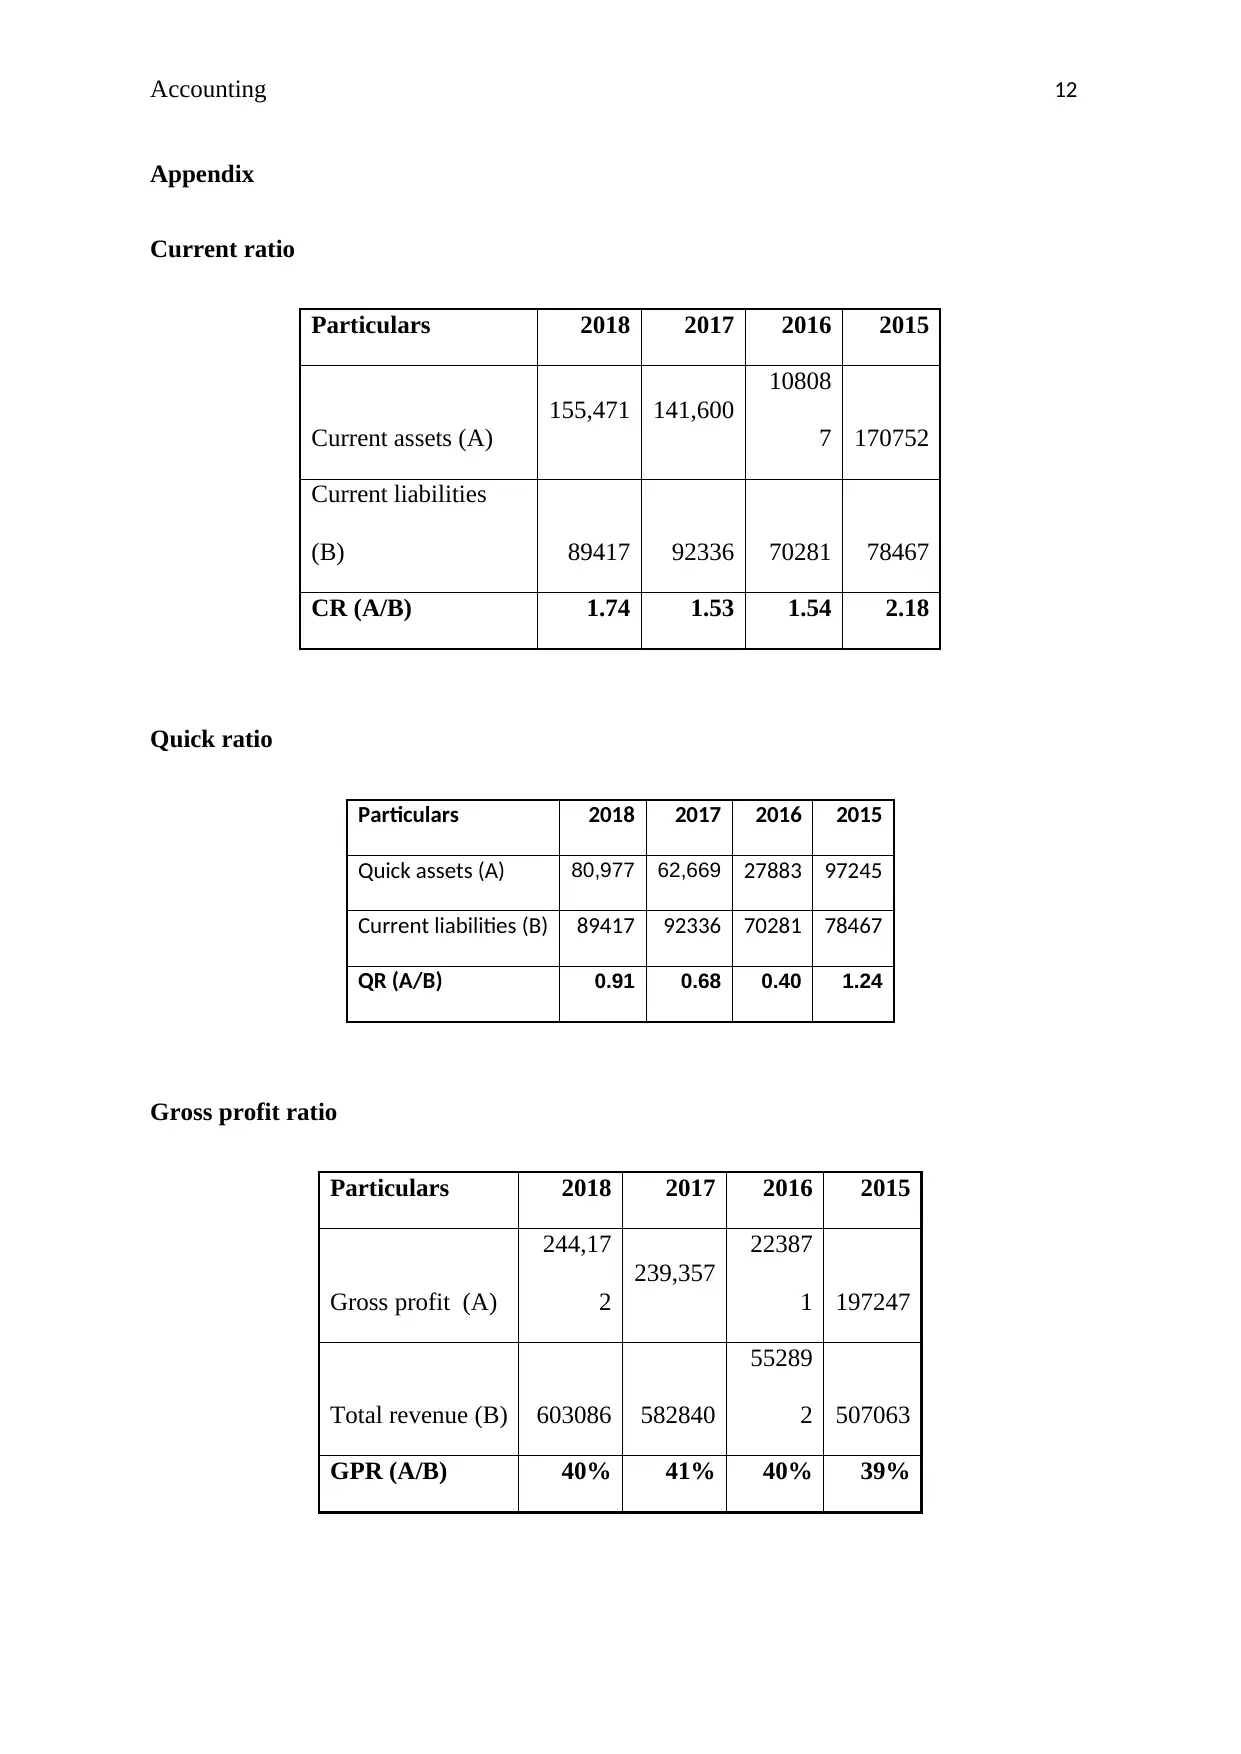
Referring to the Appendix, the current ratio reflects the financial position of a company and is
calculated by dividing the current assets with current liabilities. The CR of Briscoe group has
been continuously increasing after facing a fall in 2016. In 2015, the CR of the company was
2.18 and the same reduces to 1.54 in 2016. After that, it falls further to 1.53 and currently, its
CR is 1.74. This implies that company has improved its performance as a result of which, its
liabilities has reduced in 2018. This boosted up the ratio make Briscoe capable enough to
meet its short term obligations (Tracy, 2012).
2. Quick ratio
It is another financial metric which reflects the same as current ratio does. The only
difference is that it takes into account the value of quick assets which comprises of the most
liquid assets that excludes inventory.
Question 3
In order to decide between the purchase of Briscoe Group Limited and investment in term
deposit worth $50000, following analysis is been done for Briscoe Limited:
Ratio analysis
Performance of share price
Recent announcements
Ratio Analysis of the company
The key ratios calculated are as follows:
1. Current ratio
It is one of the liquidity ratio that reflects the capability of a company to pay off its current
liabilities with its current assets. It shows the financial health of the business.
Referring to the Appendix, the current ratio reflects the financial position of a company and is
calculated by dividing the current assets with current liabilities. The CR of Briscoe group has
been continuously increasing after facing a fall in 2016. In 2015, the CR of the company was
2.18 and the same reduces to 1.54 in 2016. After that, it falls further to 1.53 and currently, its
CR is 1.74. This implies that company has improved its performance as a result of which, its
liabilities has reduced in 2018. This boosted up the ratio make Briscoe capable enough to
meet its short term obligations (Tracy, 2012).
2. Quick ratio
It is another financial metric which reflects the same as current ratio does. The only
difference is that it takes into account the value of quick assets which comprises of the most
liquid assets that excludes inventory.
⊘ This is a preview!⊘
Do you want full access?
Subscribe today to unlock all pages.
Trusted by 1+ million students worldwide
Accounting 7
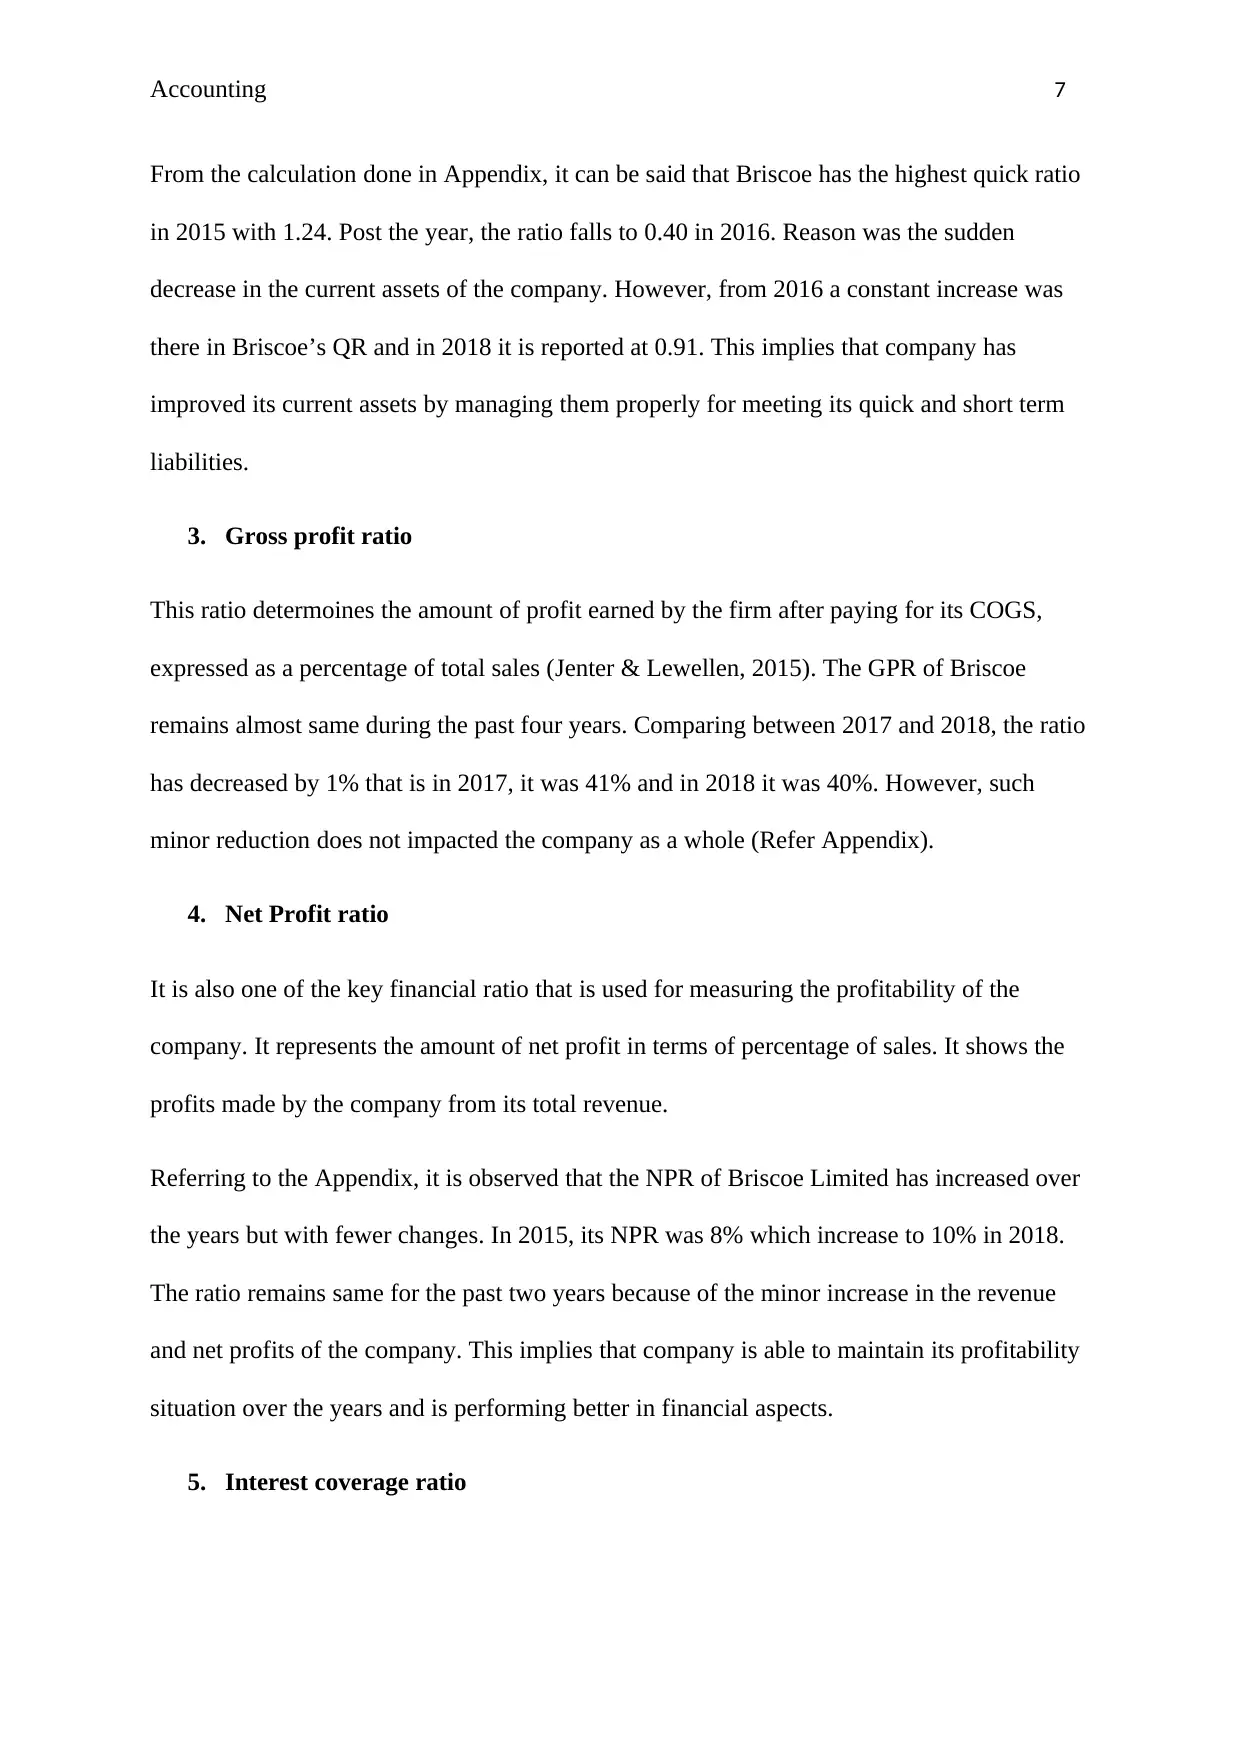
From the calculation done in Appendix, it can be said that Briscoe has the highest quick ratio
in 2015 with 1.24. Post the year, the ratio falls to 0.40 in 2016. Reason was the sudden
decrease in the current assets of the company. However, from 2016 a constant increase was
there in Briscoe’s QR and in 2018 it is reported at 0.91. This implies that company has
improved its current assets by managing them properly for meeting its quick and short term
liabilities.
3. Gross profit ratio
This ratio determoines the amount of profit earned by the firm after paying for its COGS,
expressed as a percentage of total sales (Jenter & Lewellen, 2015). The GPR of Briscoe
remains almost same during the past four years. Comparing between 2017 and 2018, the ratio
has decreased by 1% that is in 2017, it was 41% and in 2018 it was 40%. However, such
minor reduction does not impacted the company as a whole (Refer Appendix).
4. Net Profit ratio
It is also one of the key financial ratio that is used for measuring the profitability of the
company. It represents the amount of net profit in terms of percentage of sales. It shows the
profits made by the company from its total revenue.
Referring to the Appendix, it is observed that the NPR of Briscoe Limited has increased over
the years but with fewer changes. In 2015, its NPR was 8% which increase to 10% in 2018.
The ratio remains same for the past two years because of the minor increase in the revenue
and net profits of the company. This implies that company is able to maintain its profitability
situation over the years and is performing better in financial aspects.
5. Interest coverage ratio
Paraphrase This Document
Need a fresh take? Get an instant paraphrase of this document with our AI Paraphraser
Accounting 8
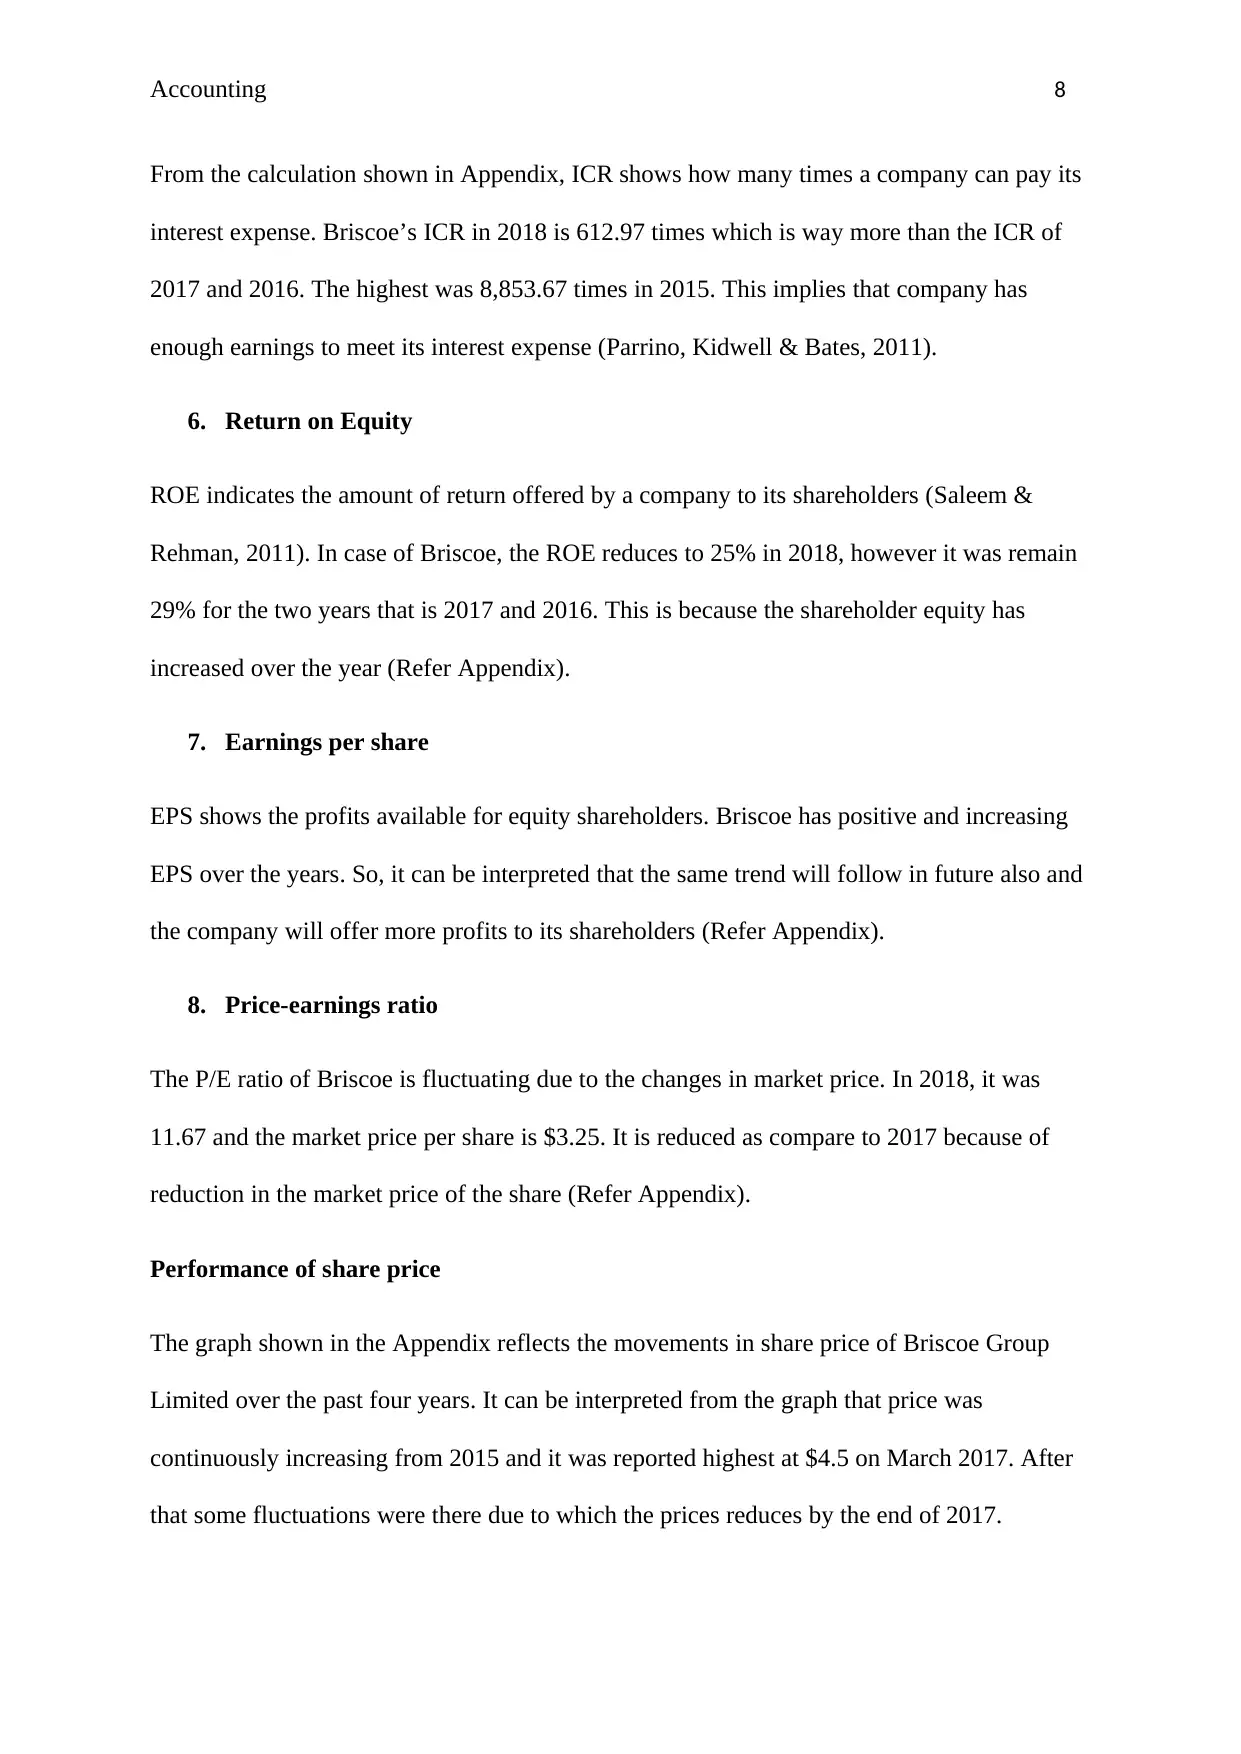
From the calculation shown in Appendix, ICR shows how many times a company can pay its
interest expense. Briscoe’s ICR in 2018 is 612.97 times which is way more than the ICR of
2017 and 2016. The highest was 8,853.67 times in 2015. This implies that company has
enough earnings to meet its interest expense (Parrino, Kidwell & Bates, 2011).
6. Return on Equity
ROE indicates the amount of return offered by a company to its shareholders (Saleem &
Rehman, 2011). In case of Briscoe, the ROE reduces to 25% in 2018, however it was remain
29% for the two years that is 2017 and 2016. This is because the shareholder equity has
increased over the year (Refer Appendix).
7. Earnings per share
EPS shows the profits available for equity shareholders. Briscoe has positive and increasing
EPS over the years. So, it can be interpreted that the same trend will follow in future also and
the company will offer more profits to its shareholders (Refer Appendix).
8. Price-earnings ratio
The P/E ratio of Briscoe is fluctuating due to the changes in market price. In 2018, it was
11.67 and the market price per share is $3.25. It is reduced as compare to 2017 because of
reduction in the market price of the share (Refer Appendix).
Performance of share price
The graph shown in the Appendix reflects the movements in share price of Briscoe Group
Limited over the past four years. It can be interpreted from the graph that price was
continuously increasing from 2015 and it was reported highest at $4.5 on March 2017. After
that some fluctuations were there due to which the prices reduces by the end of 2017.
Accounting 9
However, in start of 2018 the prices again rises showing a positive trend for the investors.
Currently the share price of Briscoe is $3.48.
Recent announcements
In April 2018, the company announce about its 1st quarter sales of year 2018. The sales were
worth $146.4 million showing a 3.57% hike as compare to the same quarter of 2017. The
report also discloses that the group sales were 2.03% high and the departmental sales also
increases (Briscoegroup.com. 2018).
As per the article in NZ Herald, Briscoe’s total profit for the year 2017 rose by 25% to $59
million along with the upsurge in the sales. The increase in profit and revenue boosted up the
share price of the company and bring it to the highest if $4.5 per share (NZ Herald. 2017).
Final Decision
As per the analysis, it will be recommended to invest $50,000 in Briscoe Group Limited by
purchasing its shares at $3.55 (price as on April 22, 2018) because it is believed that the
company is doing well and will give more return as compare to the term deposit. Also it has
high profits, reasonable ROE and a good financial health. So, it will be recommended that the
shares of Briscoe’s Limited should be purchased.
⊘ This is a preview!⊘
Do you want full access?
Subscribe today to unlock all pages.
Trusted by 1+ million students worldwide
Accounting 10
References
Alexander, D., Britton, A., & Jorissen, A. (2007). International financial reporting and
analysis. (3rd ed.). London: Thomson.
Berk, J. B., & DeMarzo, P. M. (2010). Corporate finance. India: Pearson Education.
Boex, A. (2015). Why cash flow is more important than profit. Retrieved from
https://www.unomaha.edu/nebraska-business-development-center/_files/
publications/cash-flow.pdf
Briscoegroup.com. (2018). 1st Quarter Sales to 29 April 2018. Retrieved from
http://briscoegroup.co.nz/wp-content/uploads/1st-Quarter-Sales-May-2018.pdf
Charifzadeh, M., & Taschner, A. (2017). Management accounting and control: tools and
concepts in a Central European context. Germany: John Wiley & Sons.
CPA. (2018). The importance of linking profitability and cash flow when analysing financial
statements. Retrieved from http://www.cpaireland.ie/docs/default-source/business-
resource/profitability-and-cashflow-(2009).pdf?sfvrsn=2
Dick, W., & Missonier-Piera, F. (2011). Financial reporting under IFRS: a topic based
approach (Vol. 1). UK: John Wiley & Sons.
Fernandez, P. (2006). Cash flow is cash and is a fact: Net income is an opinion. Retrieved
from https://www.iese.edu/research/pdfs/di-0629-e.pdf
Jenter, D., & Lewellen, K. (2015). CEO preferences and acquisitions. The Journal of
Finance, 70(6), 2813-2852.
Knight, F.H. (2012). Risk, uncertainty and profit. Courier Corporation.
Paraphrase This Document
Need a fresh take? Get an instant paraphrase of this document with our AI Paraphraser
Accounting 11
NZ Herald. (2017). Briscoe Group's full-year profit rose 25pc to about $59 million. Retrieved
from https://www.nzherald.co.nz/business/news/article.cfm?
c_id=3&objectid=11793458
Palepu, K. G., & Healy, P. M. (2007). Business analysis and valuation. USA: Cengage
Learning EMEA.
Parrino, R., Kidwell, D. S., & Bates, T. (2011). Fundamentals of corporate finance. John
Wiley & Sons.
Periasamy, P. (2009). Financial Management. 2nd ed. New Delhi: Tata McGraw-Hill
Education Pvt. Ltd.
Rajasekaran, V. (2011). Financial accounting. India: Pearson Education India.
Saleem, Q., & Rehman, R. U. (2011). Impacts of liquidity ratios on
profitability. Interdisciplinary Journal of Research in Business, 1(7), 95-98.
Sinha, G. (2012). Financial statement analysis. (2nd ed.). New Delhi: PHI Learning Pvt. Ltd..
Tracy, A. (2012). Ratio analysis fundamentals: how 17 financial ratios can allow you to
analyse any business on the planet. RatioAnalysis. net.
Yahoo Finance. (2018). BGP.NZ Interactive Chart Briscoe Group Limited Ordinary Stock -
Retrieved from https://finance.yahoo.com/quote/BGP.NZ/financials?p=BGP.NZ
Accounting 12
Appendix
Current ratio
Particulars 2018 2017 2016 2015
Current assets (A)
155,471 141,600
10808
7 170752
Current liabilities
(B) 89417 92336 70281 78467
CR (A/B) 1.74 1.53 1.54 2.18
Quick ratio
Particulars 2018 2017 2016 2015
Quick assets (A) 80,977 62,669 27883 97245
Current liabilities (B) 89417 92336 70281 78467
QR (A/B) 0.91 0.68 0.40 1.24
Gross profit ratio
Particulars 2018 2017 2016 2015
Gross profit (A)
244,17
2
239,357
22387
1 197247
Total revenue (B) 603086 582840
55289
2 507063
GPR (A/B) 40% 41% 40% 39%
⊘ This is a preview!⊘
Do you want full access?
Subscribe today to unlock all pages.
Trusted by 1+ million students worldwide
1 out of 14
Related Documents


Your All-in-One AI-Powered Toolkit for Academic Success.
+13062052269
info@desklib.com
Available 24*7 on WhatsApp / Email
![[object Object]](/_next/static/media/star-bottom.7253800d.svg)
Unlock your academic potential
Copyright © 2020–2026 A2Z Services. All Rights Reserved. Developed and managed by ZUCOL.