Financial Performance Analysis of Tiffany & Co: A Comprehensive Review

Verified

Added on  2020/12/09

|32
|4647
|99
Report
AI Summary
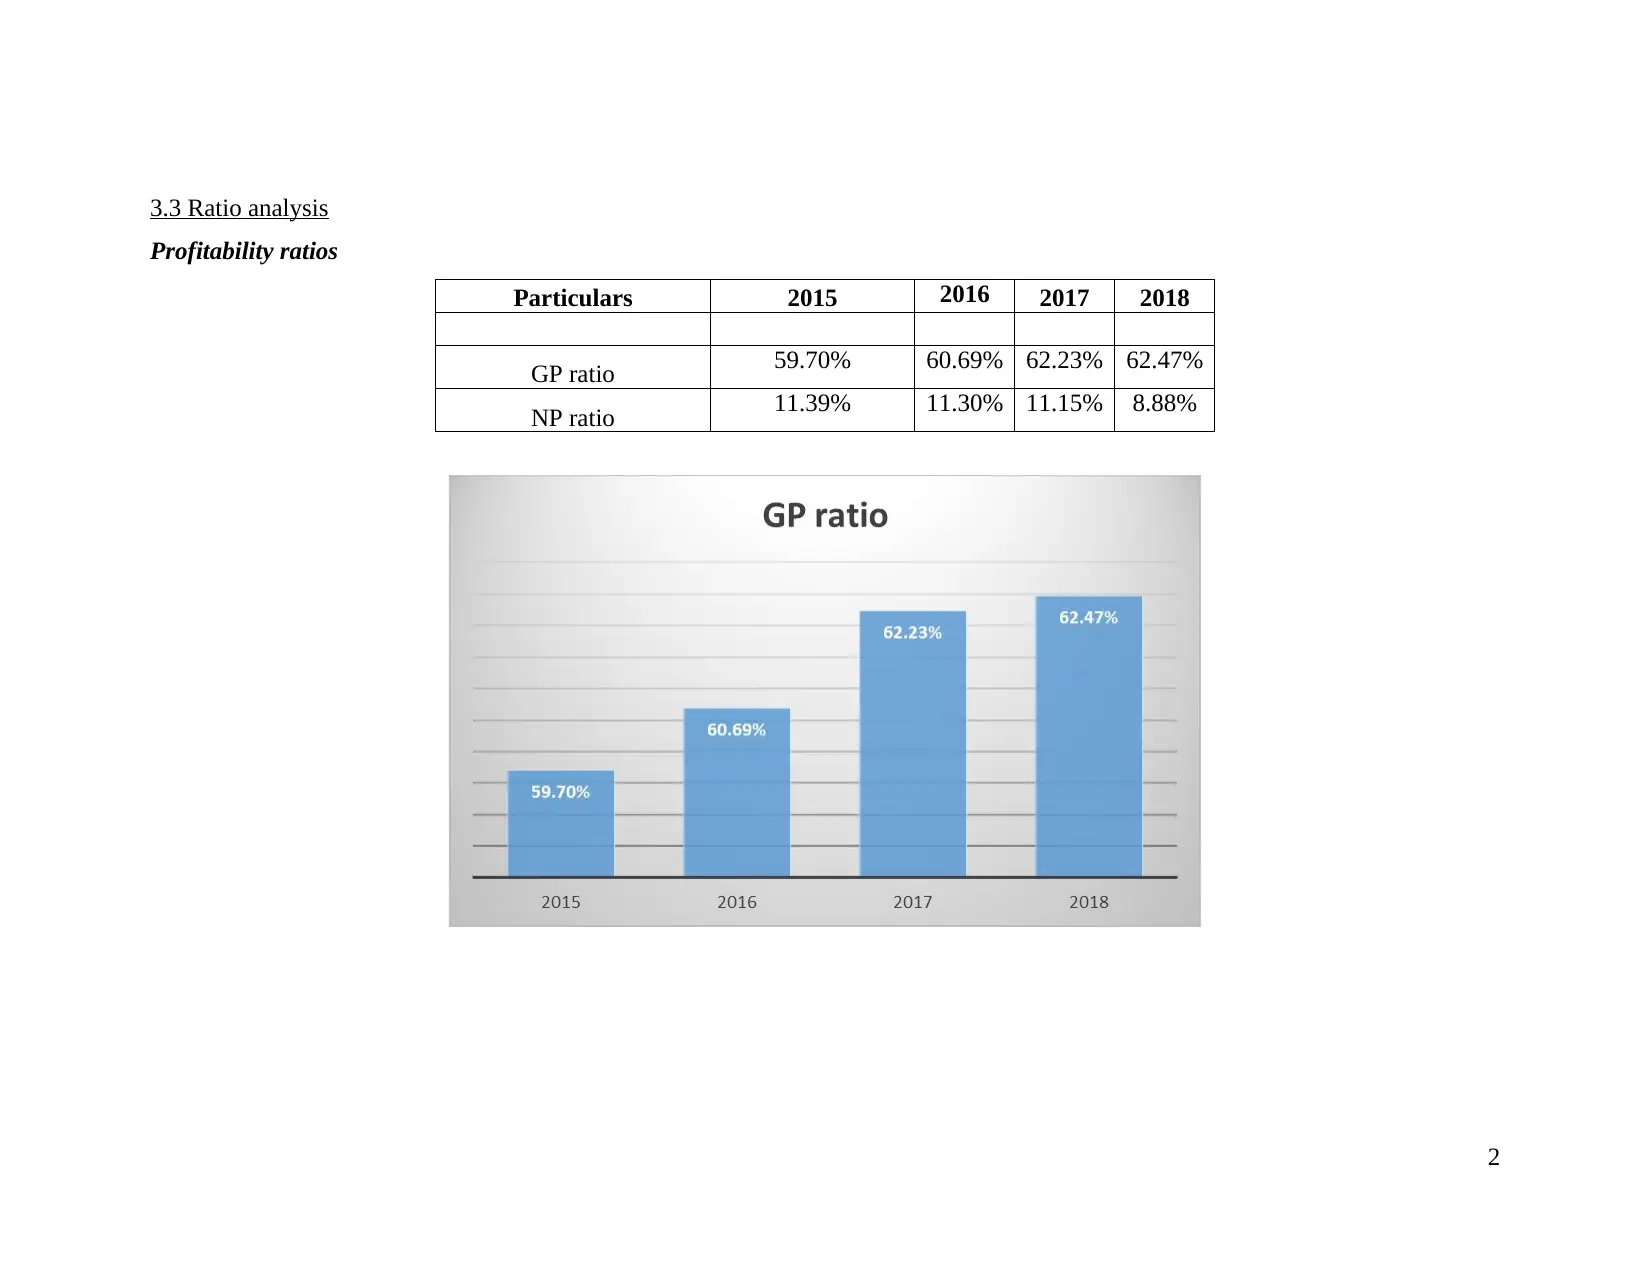
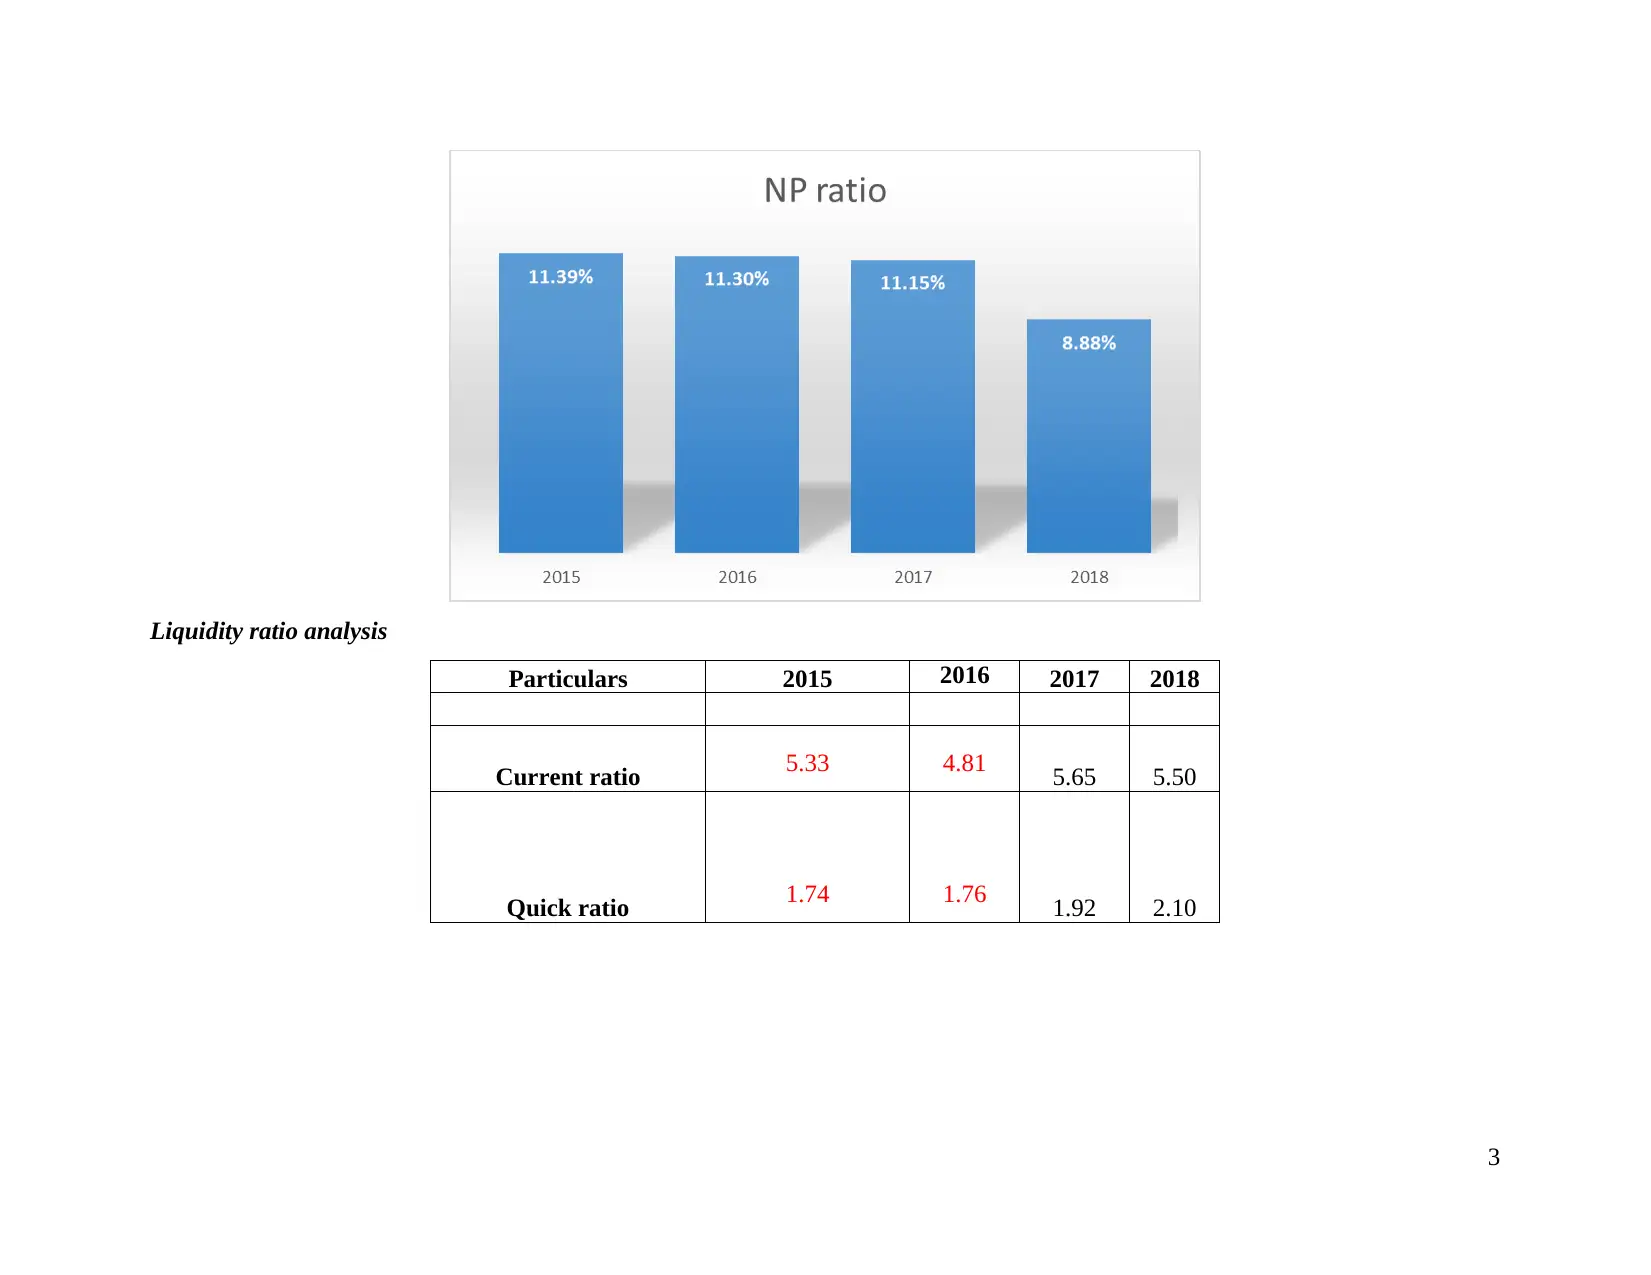
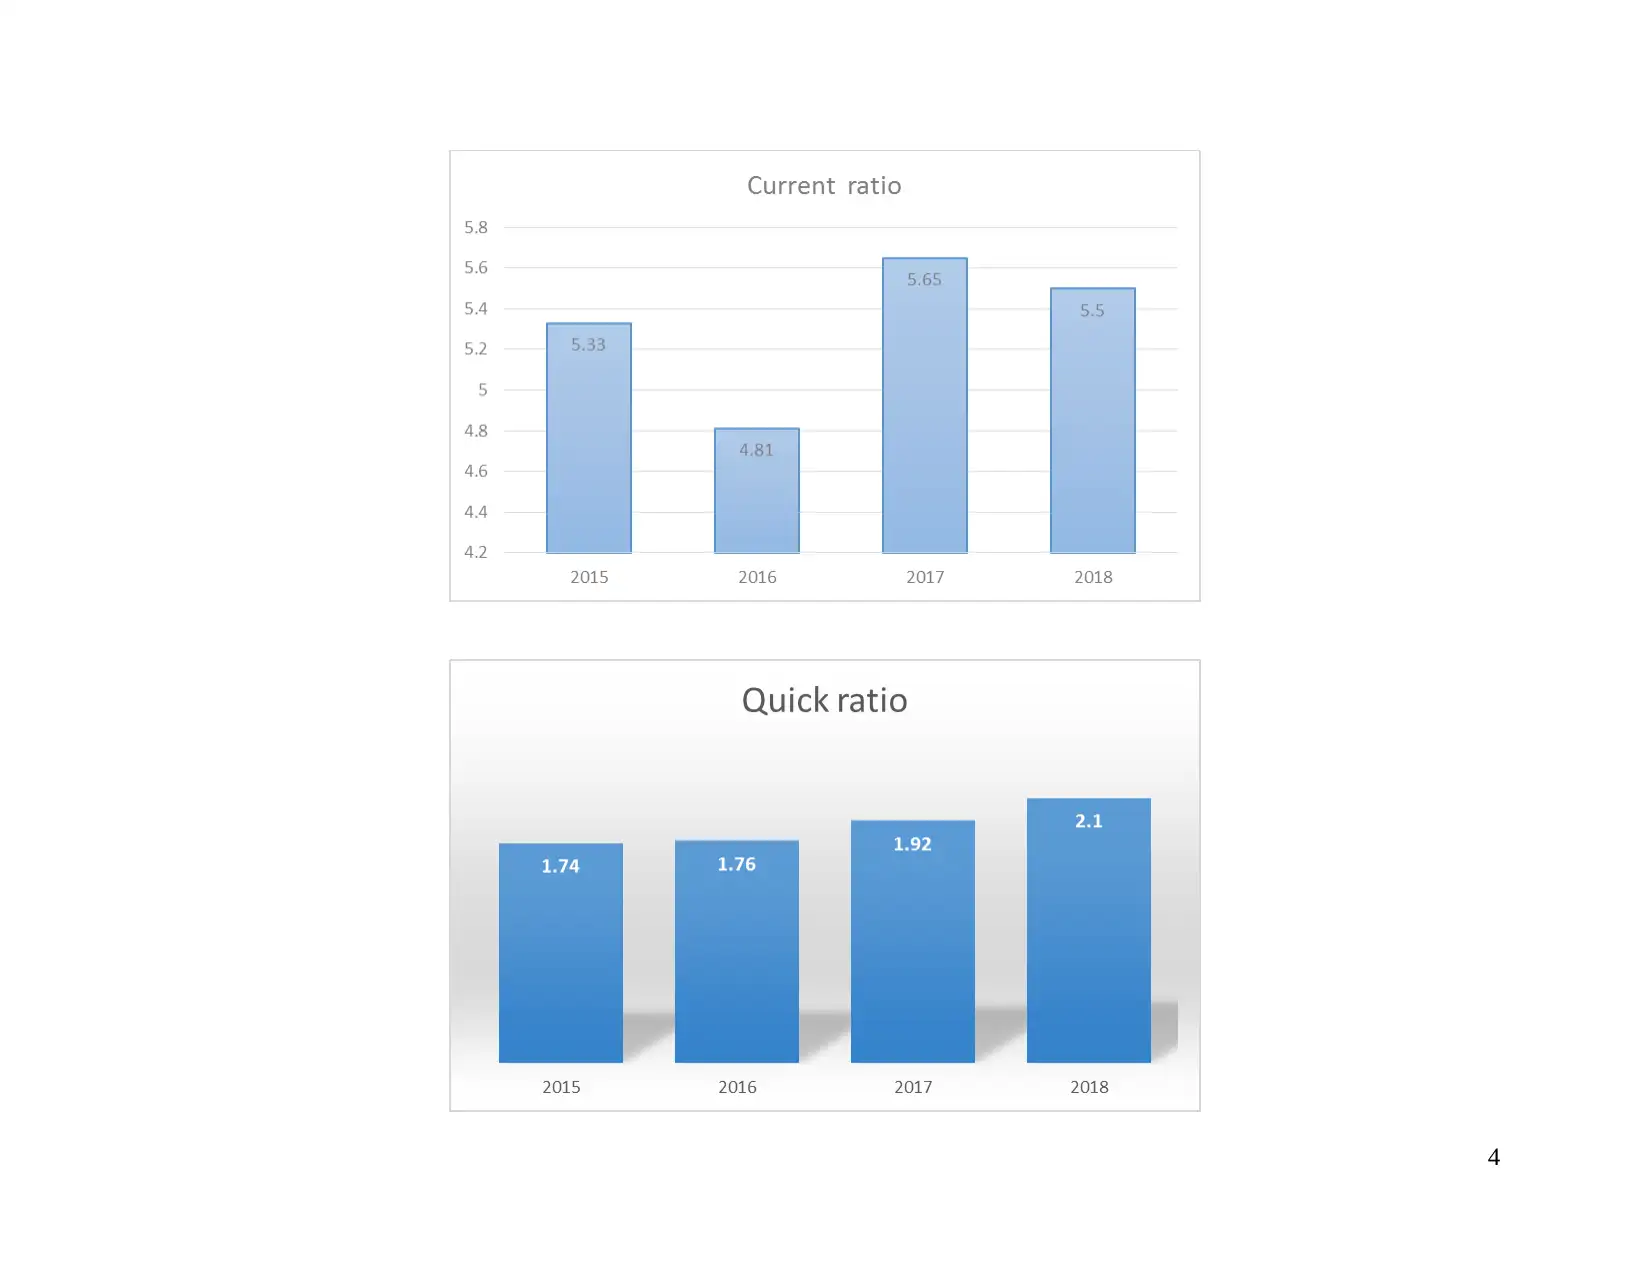
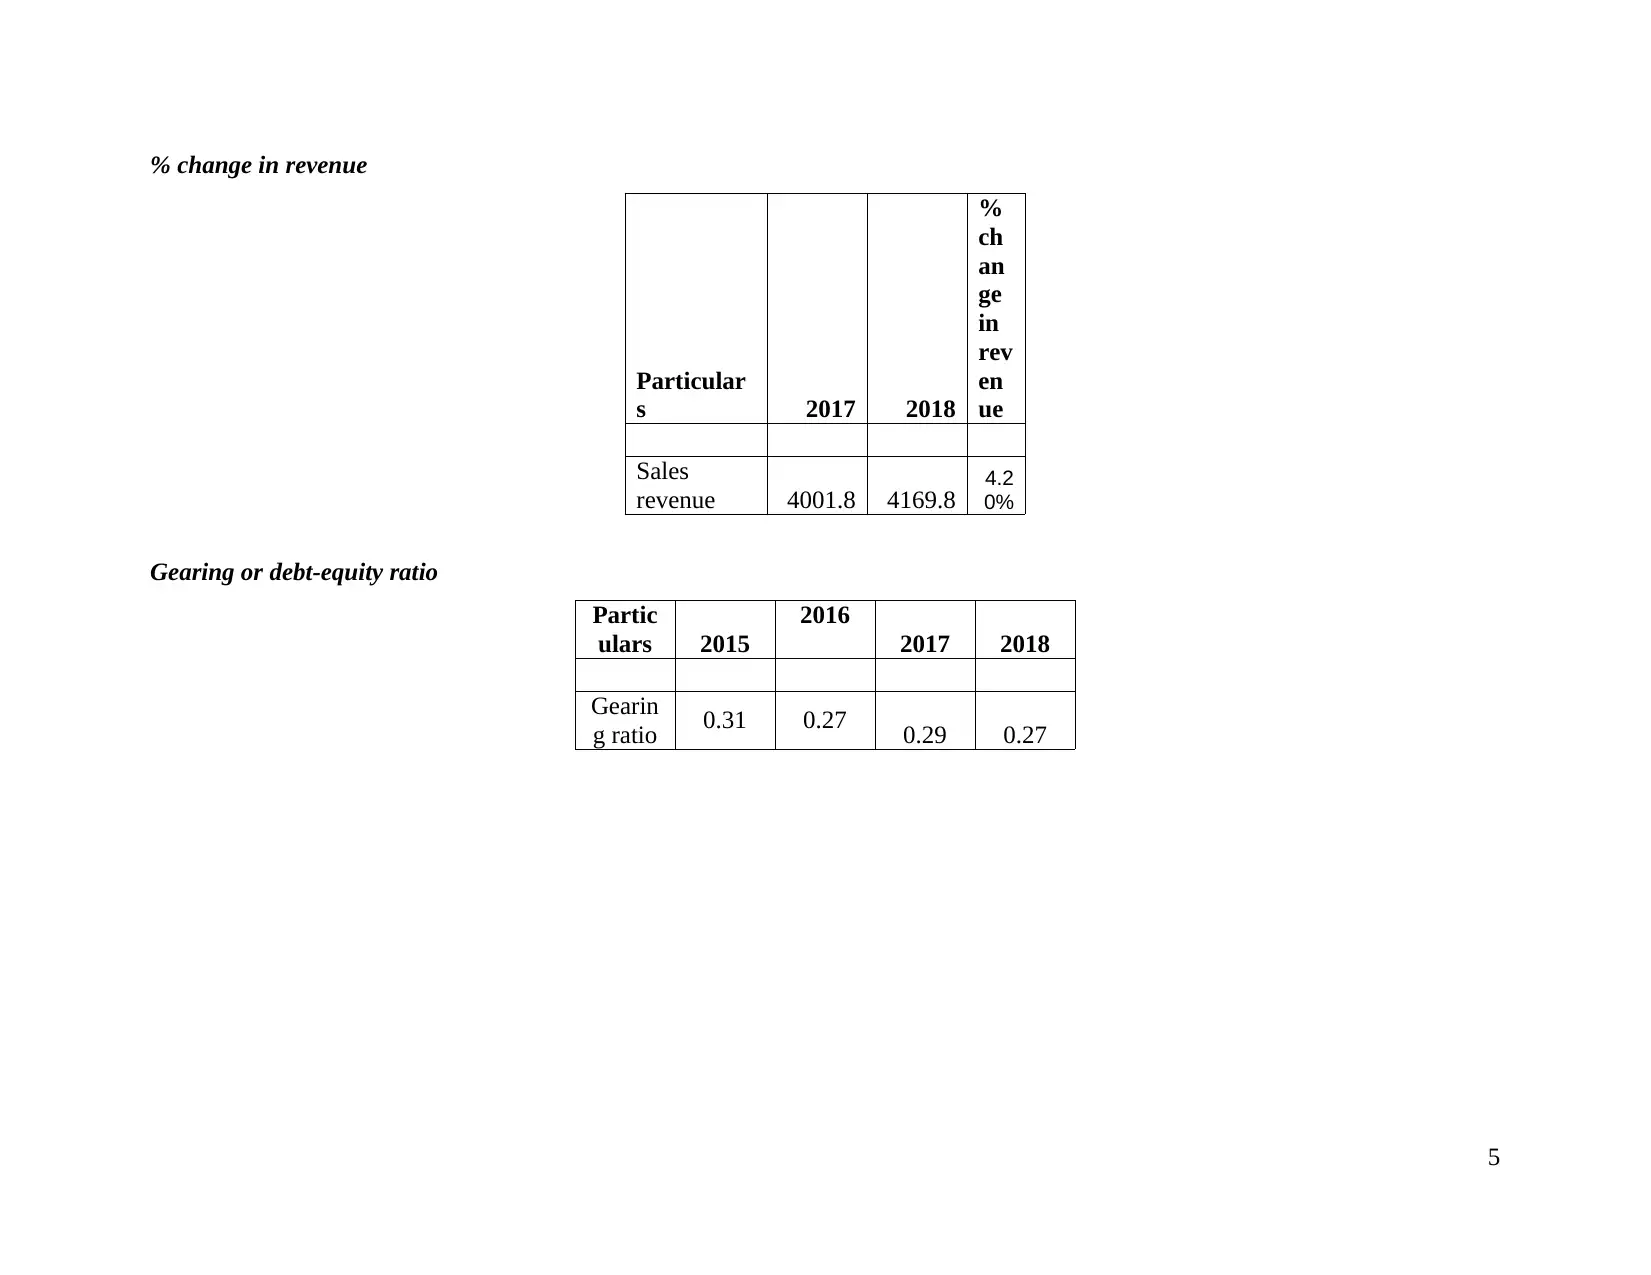
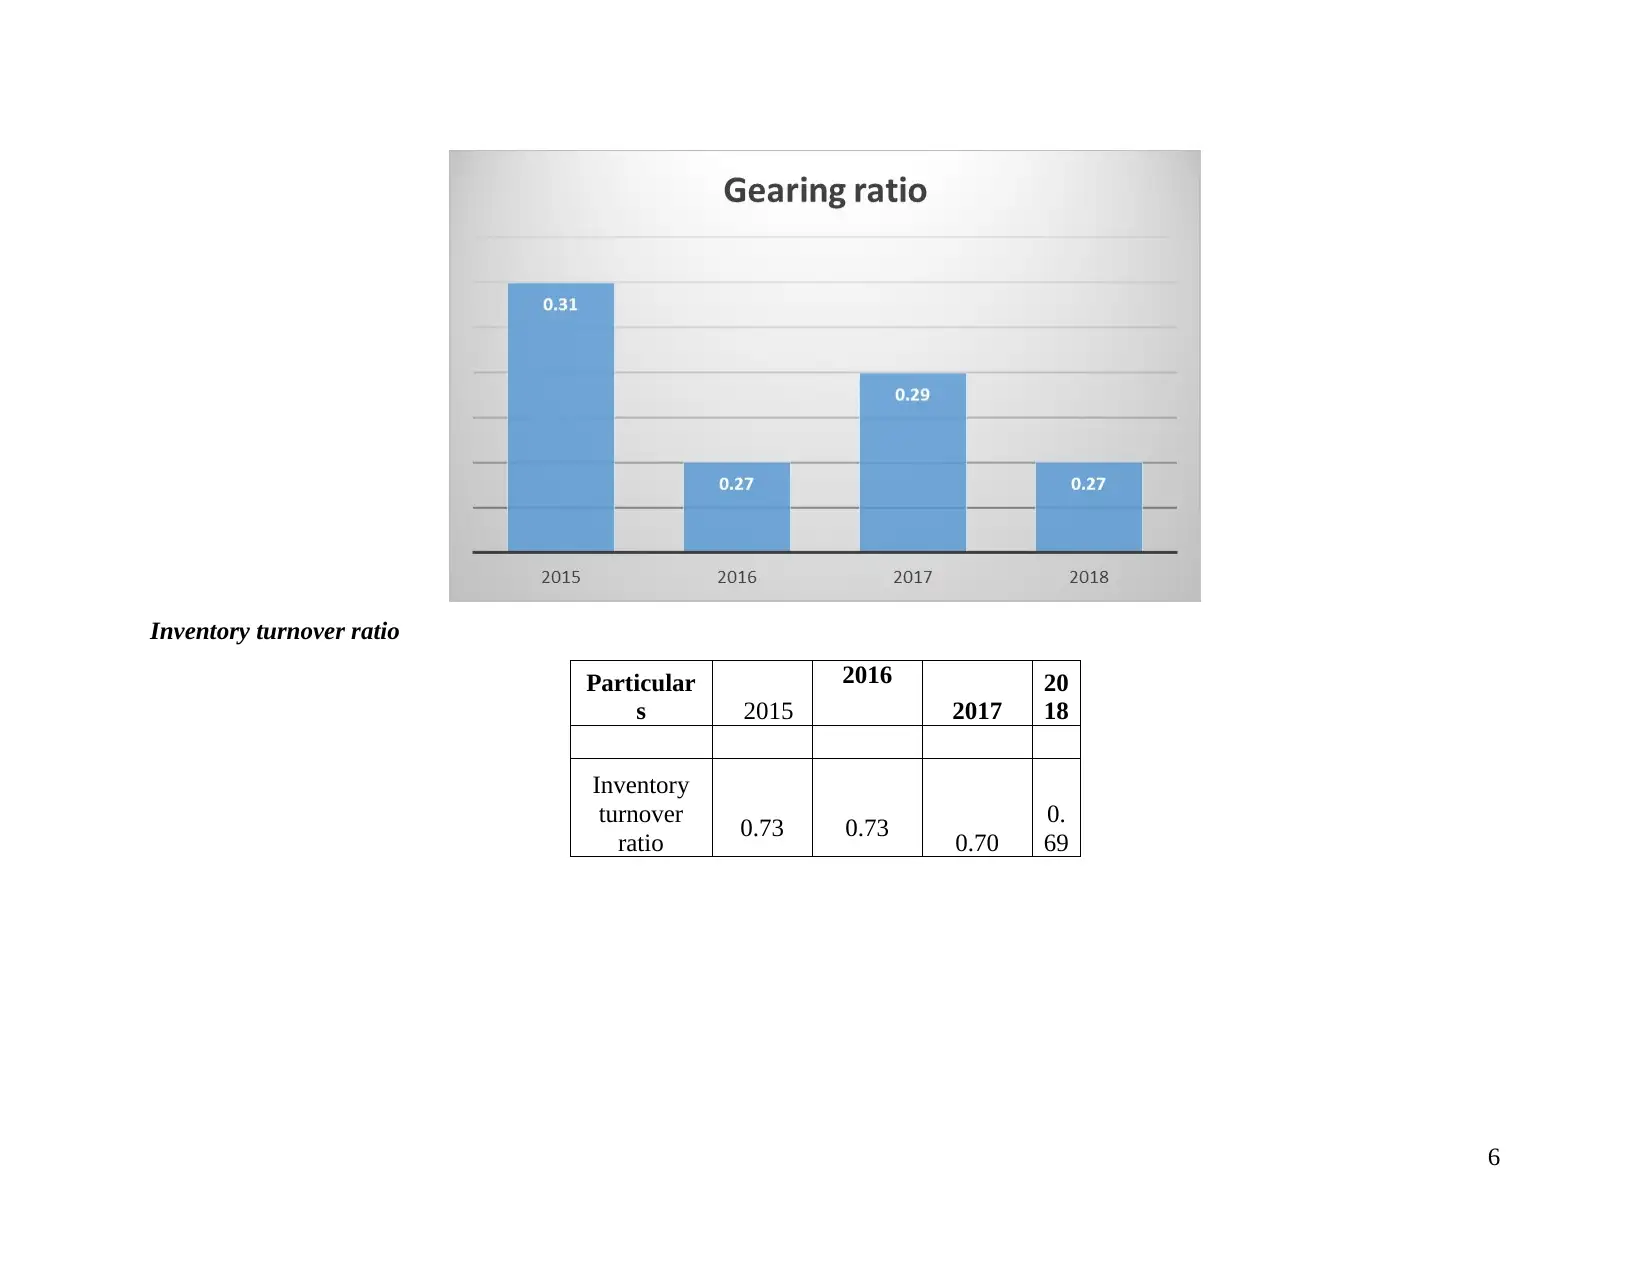
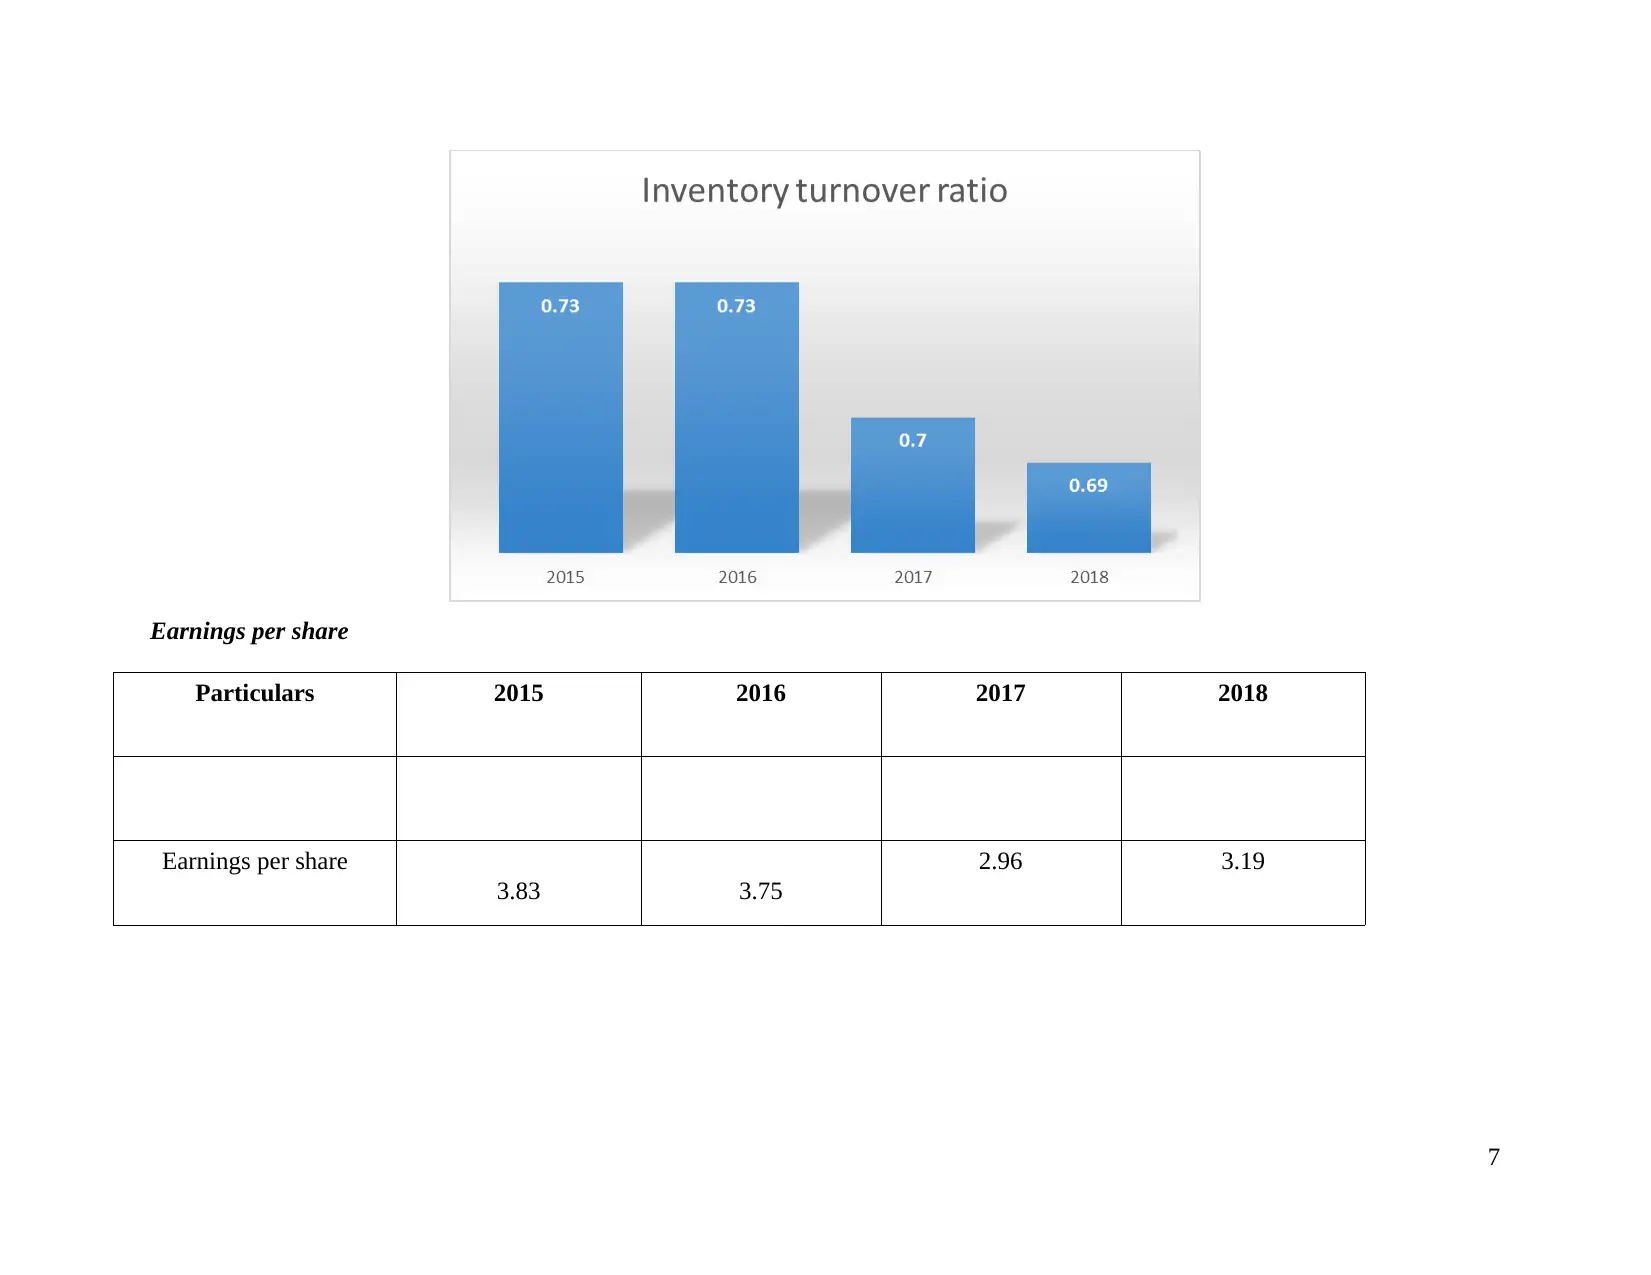
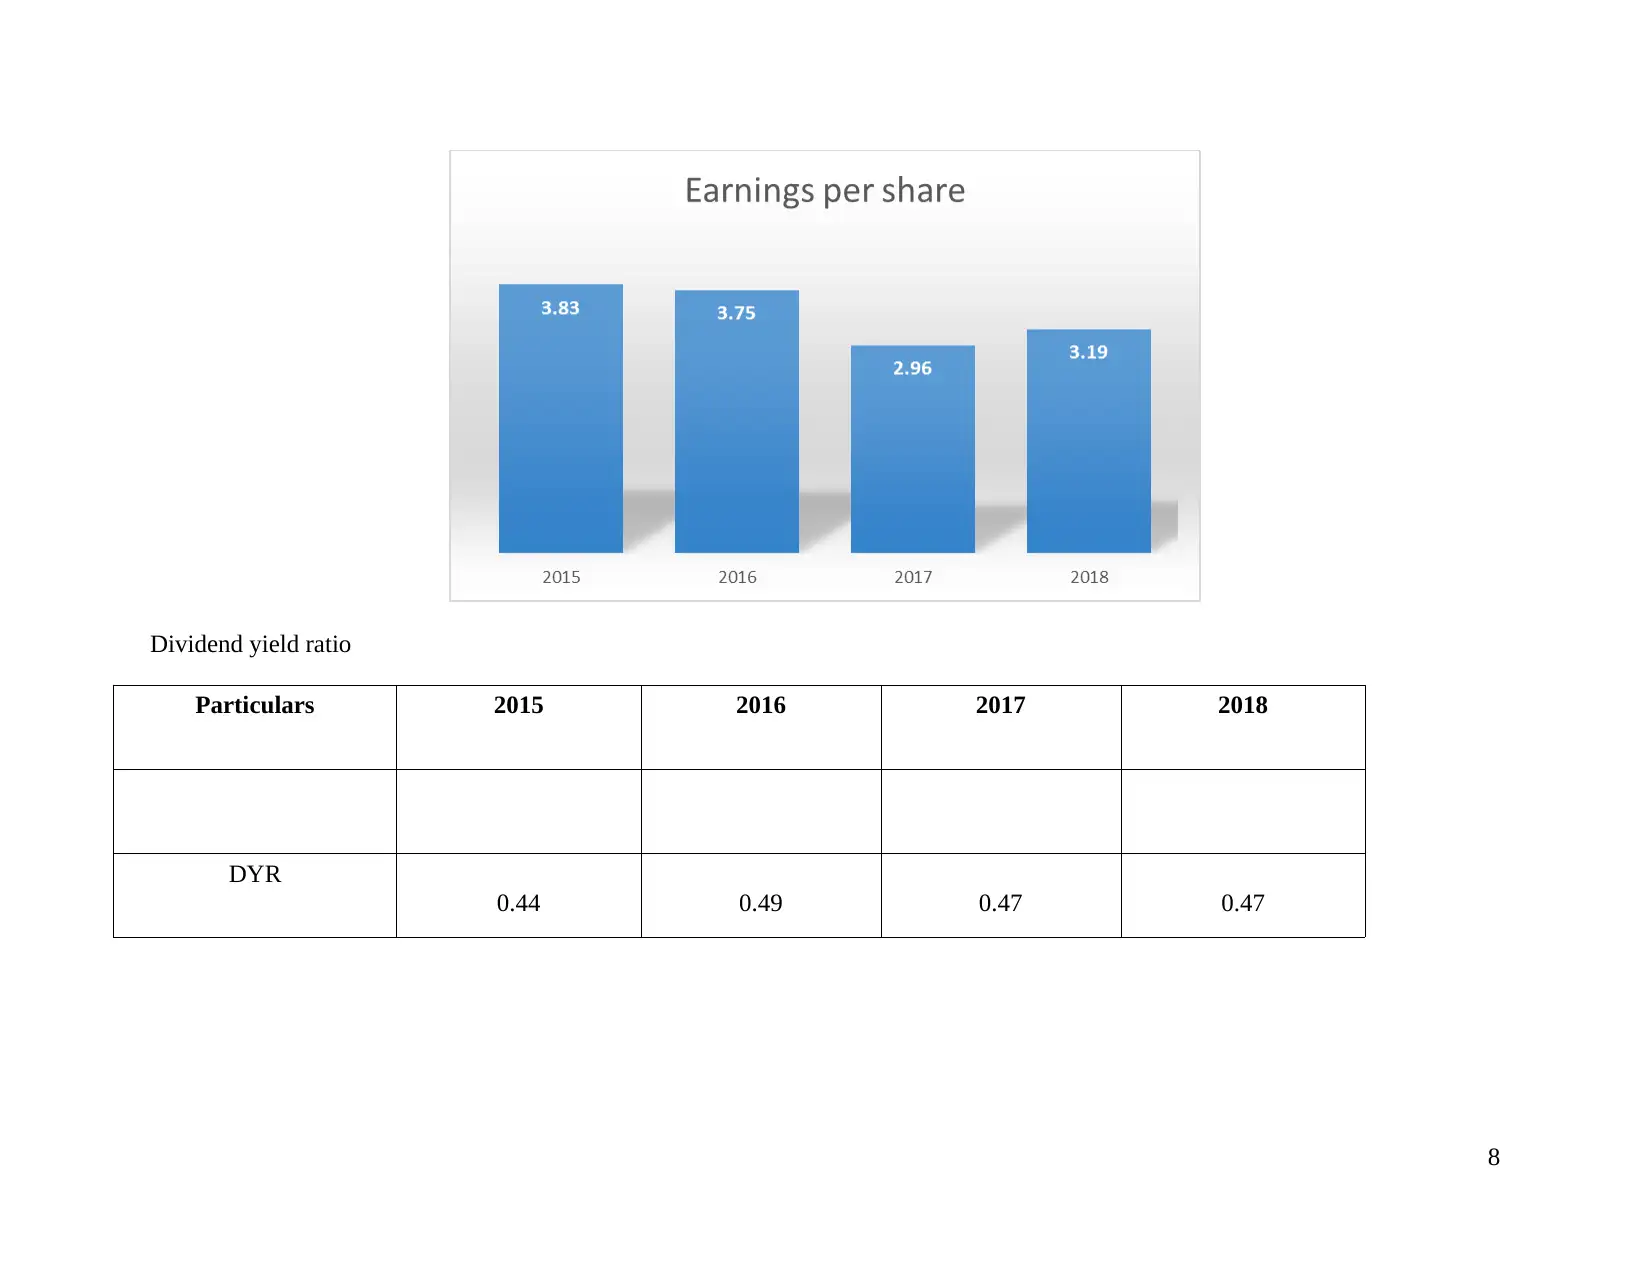
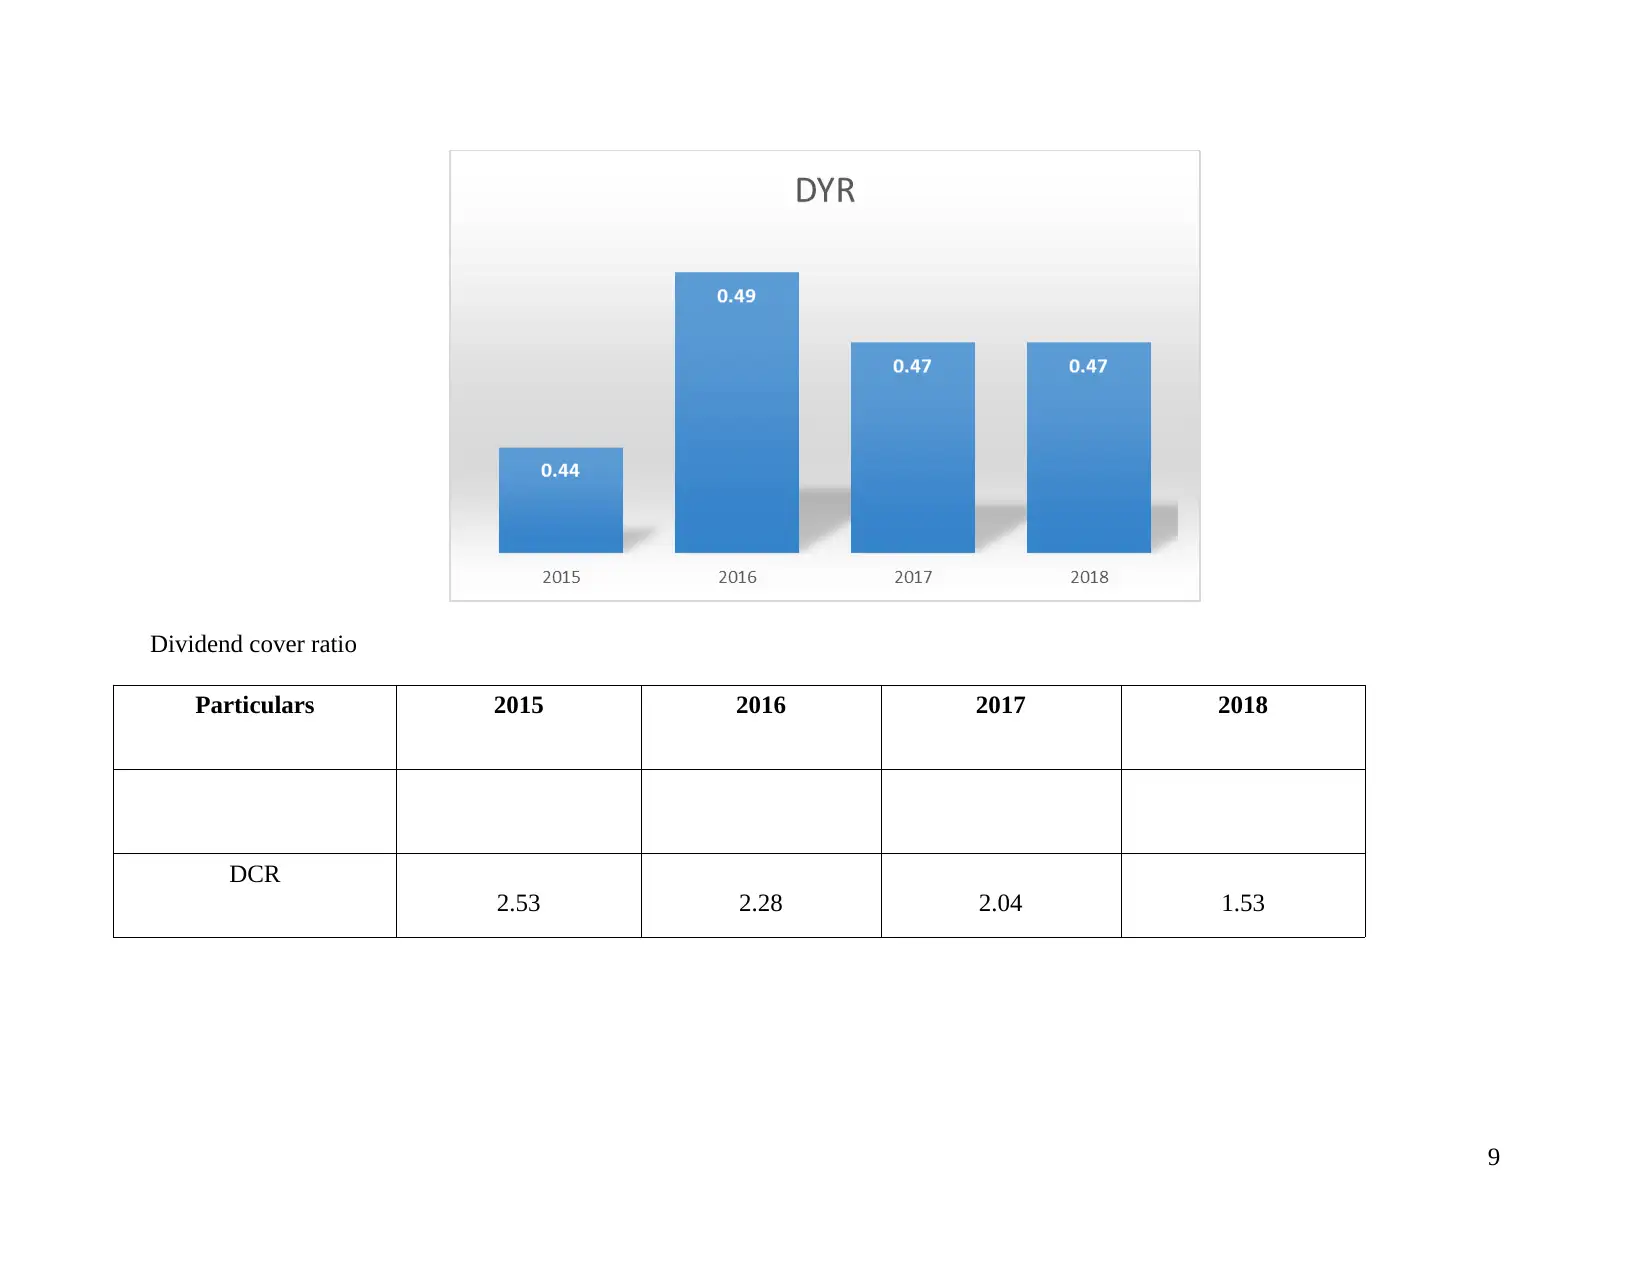
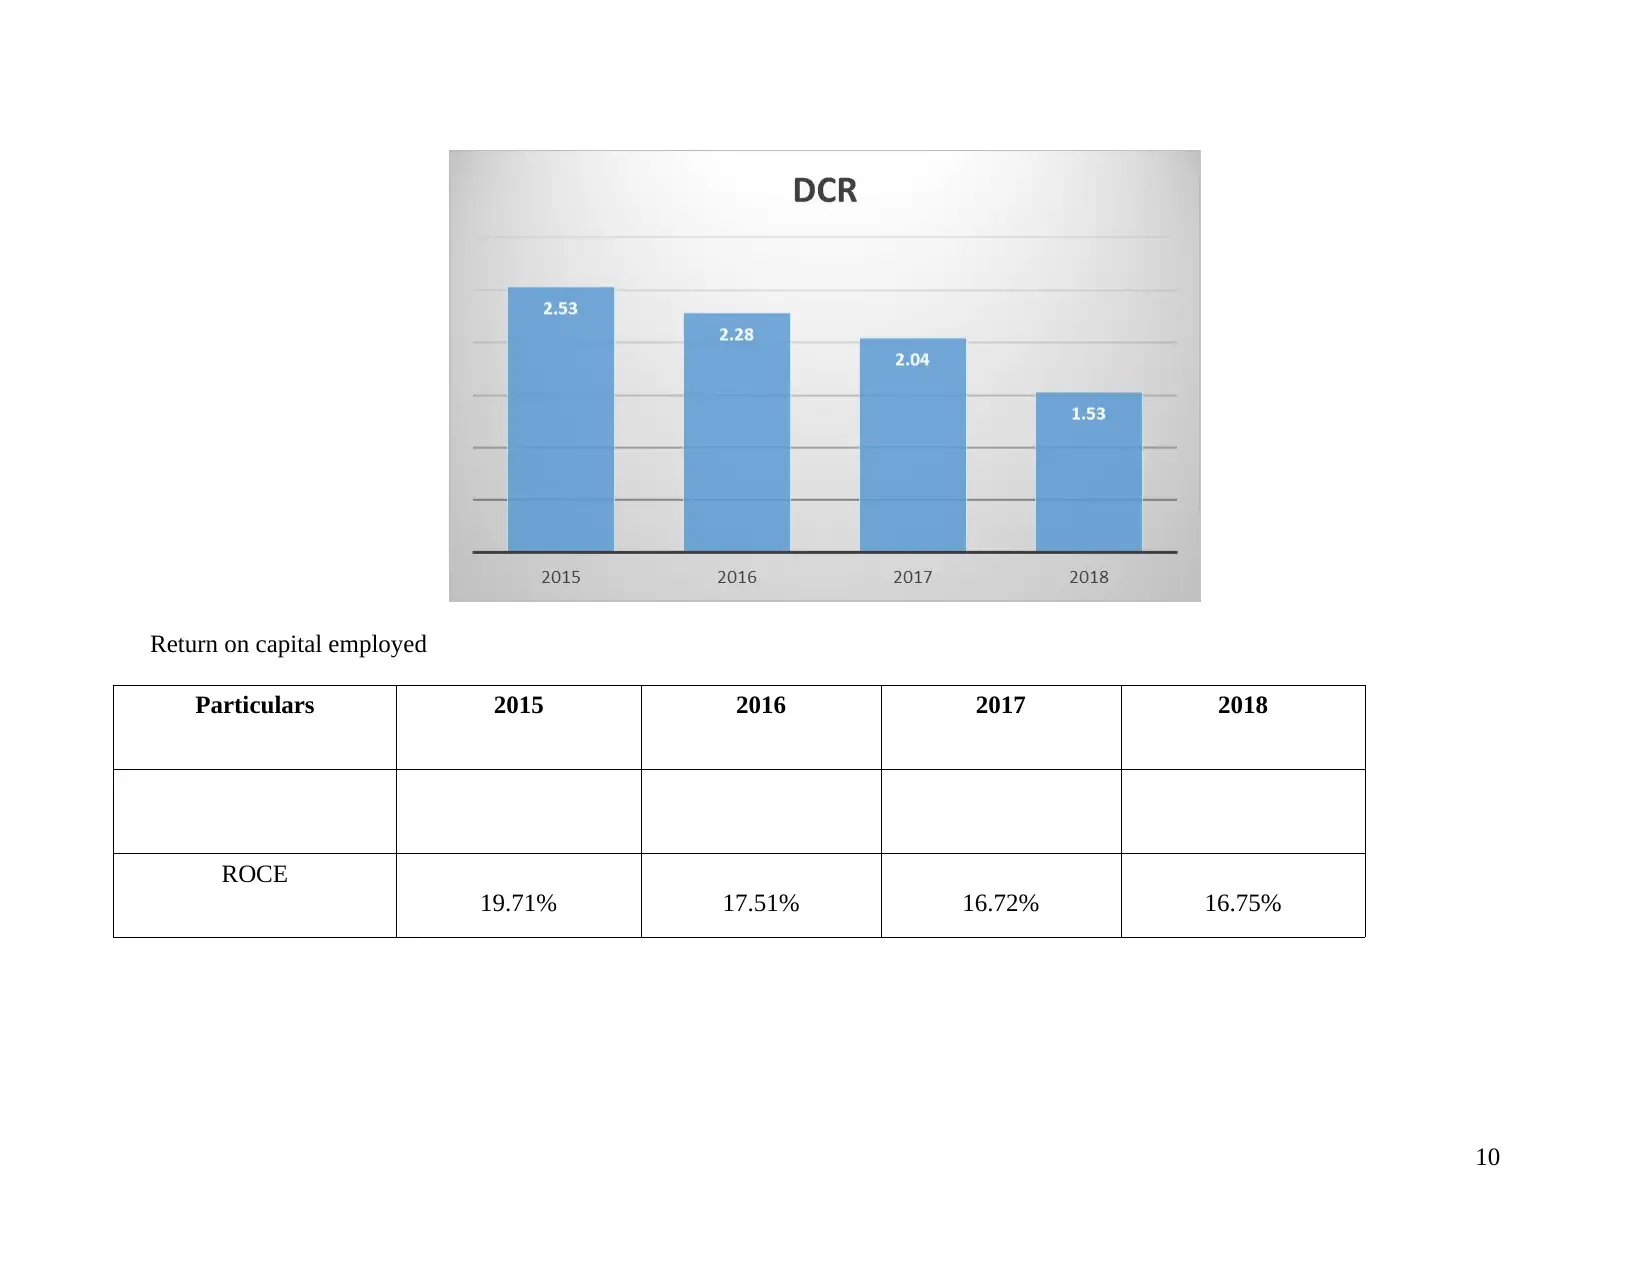
This report provides a comprehensive financial analysis of Tiffany & Co., evaluating its performance through horizontal, vertical, and ratio analyses from 2015 to 2018. It examines profitability ratios (gross profit and net profit), liquidity ratios (current and quick ratios), and other key metrics like revenue changes, gearing ratios, inventory turnover, earnings per share, dividend yields, dividend cover, and return on capital employed. The analysis reveals trends in earnings, liquidity, and debt management, highlighting both positive and negative indicators. The report also discusses Tiffany & Co.'s business and growth strategies, including global expansion, product development, and customer awareness initiatives. It further explores the limitations of ratio and trend analysis, addressing issues such as qualitative factors, window dressing, and the use of historical data. The conclusion summarizes the company's financial position and suggests growth strategies for long-term success, such as diversification and market exploration.
Document Page
Accounting for decision
making
tabler-icon-diamond-filled.svg

Paraphrase This Document

Need a fresh take? Get an instant paraphrase of this document with our AI Paraphraser
Document Page
TABLE OF CONTENTS
1. INTRODUCTION.......................................................................................................................1
2.BACKGROUND..........................................................................................................................1
3. FINANCIAL PERFORMANCE ANALYSIS.............................................................................1
3.1 Horizontal analysis...........................................................................................................1
3.2 Trend / Vertical analysis...................................................................................................1
3.3 Ratio analysis....................................................................................................................2
4. QUALITATIVE ANALYSIS....................................................................................................11
5. BUSINESS AND GROWTH STRATEGY..............................................................................12
6. DISADVANTAGES OF RATIO AND TREND ANALYSIS..................................................13
CONCLUSION..............................................................................................................................14
REFERENCES..............................................................................................................................15
APPENDIX....................................................................................................................................16
1. Ratio analysis of Tiffany & Co........................................................................................16
2. Horizontal analysis of income statement..........................................................................20
3. Horizontal analysis of balance sheet................................................................................21
4. Vertical analysis of income statement..............................................................................24
5. Vertical analysis of balance sheet.....................................................................................25
Document Page
1. INTRODUCTION
Financial accounting in relation with management accounting assist in making decisions regarding the allocation of resources
and generating profits. It helps business in maintaining the record of the financial transactions and enables in ascertaining the
profitability and financial position of the business (Williams and Dobelman, 2017). It also analyses the credibility, solvency and
liquidity of the company that leads to an effective decision making about the distribution of the funds in the various investment
channels so that huge funds can be generated. Further the report includes the background and aim of the company and financial ratios
and trend analysis of the organisation. It also describes the growth strategy and the limitations of the ratio and trend analysis.
2.BACKGROUND
The present study is based on Tiffany & co. which is an American company deals in the jewellery, china crystal, watches,
accessories and sterling silver headquartered in New york city. Further, such business is also listed on London Stock exchange with
the motive to attract more funds and investors. It is Well-known for its luxury and speciality in diamonds and operates worldwide
(Liu, and et.al., 2019). Its market itself has the style, taste and unique in terms of its gems and jewellery.
3. FINANCIAL PERFORMANCE ANALYSIS
3.1 Horizontal analysis
Income statement
Refer to appendix 2.
Balance sheet
Refer to appendix 3.
3.2 Trend / Vertical analysis
Income statement
Refer to appendix 4.
1
Document Page
3.3 Ratio analysis
Profitability ratios
Particulars 2015 2016 2017 2018
GP ratio 59.70% 60.69% 62.23% 62.47%
NP ratio 11.39% 11.30% 11.15% 8.88%
2
tabler-icon-diamond-filled.svg

Paraphrase This Document

Need a fresh take? Get an instant paraphrase of this document with our AI Paraphraser
Document Page
Liquidity ratio analysis
Particulars 2015 2016 2017 2018
Current ratio 5.33 4.81 5.65 5.50
Quick ratio 1.74 1.76 1.92 2.10
3
Document Page
4
Document Page
% change in revenue
Particular
s 2017 2018
%
ch
an
ge
in
rev
en
ue
Sales
revenue 4001.8 4169.8 4.2
0%
Gearing or debt-equity ratio
Partic
ulars 2015
2016
2017 2018
Gearin
g ratio 0.31 0.27 0.29 0.27
5
tabler-icon-diamond-filled.svg

Paraphrase This Document

Need a fresh take? Get an instant paraphrase of this document with our AI Paraphraser
Document Page
Inventory turnover ratio
Particular
s 2015
2016
2017
20
18
Inventory
turnover
ratio 0.73 0.73 0.70
0.
69
6
Document Page
Earnings per share
Particulars 2015 2016 2017 2018
Earnings per share
3.83 3.75
2.96 3.19
7
Document Page
Dividend yield ratio
Particulars 2015 2016 2017 2018
DYR
0.44 0.49 0.47 0.47
8
tabler-icon-diamond-filled.svg

Paraphrase This Document

Need a fresh take? Get an instant paraphrase of this document with our AI Paraphraser
Document Page
Dividend cover ratio
Particulars 2015 2016 2017 2018
DCR
2.53 2.28 2.04 1.53
9
Document Page
Return on capital employed
Particulars 2015 2016 2017 2018
ROCE
19.71% 17.51% 16.72% 16.75%
10
chevron_up_icon
1 out of 32
circle_padding
hide_on_mobile
zoom_out_icon
[object Object]