Accounting Information Systems: Excel Assignment and Research Report

Verified

Added on  2023/01/18

|10
|1748
|250
Homework Assignment
AI Summary
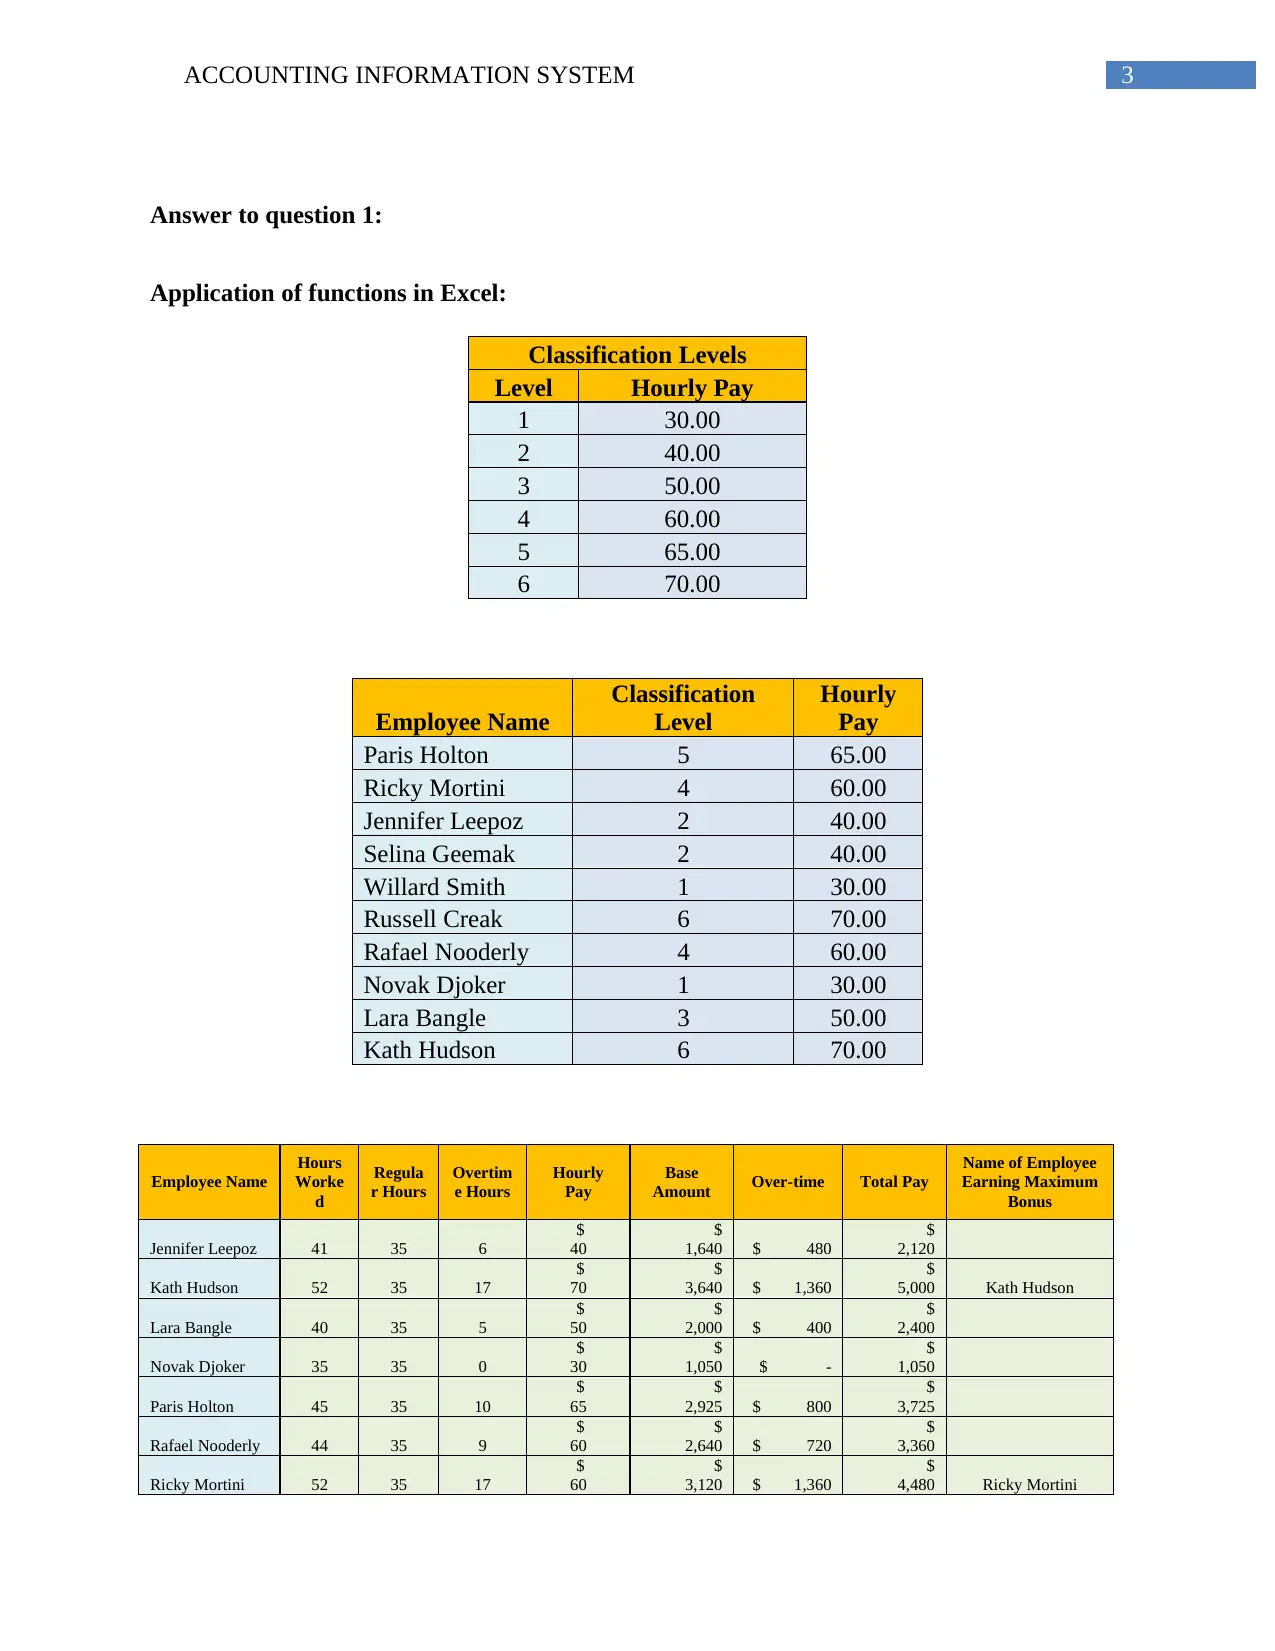
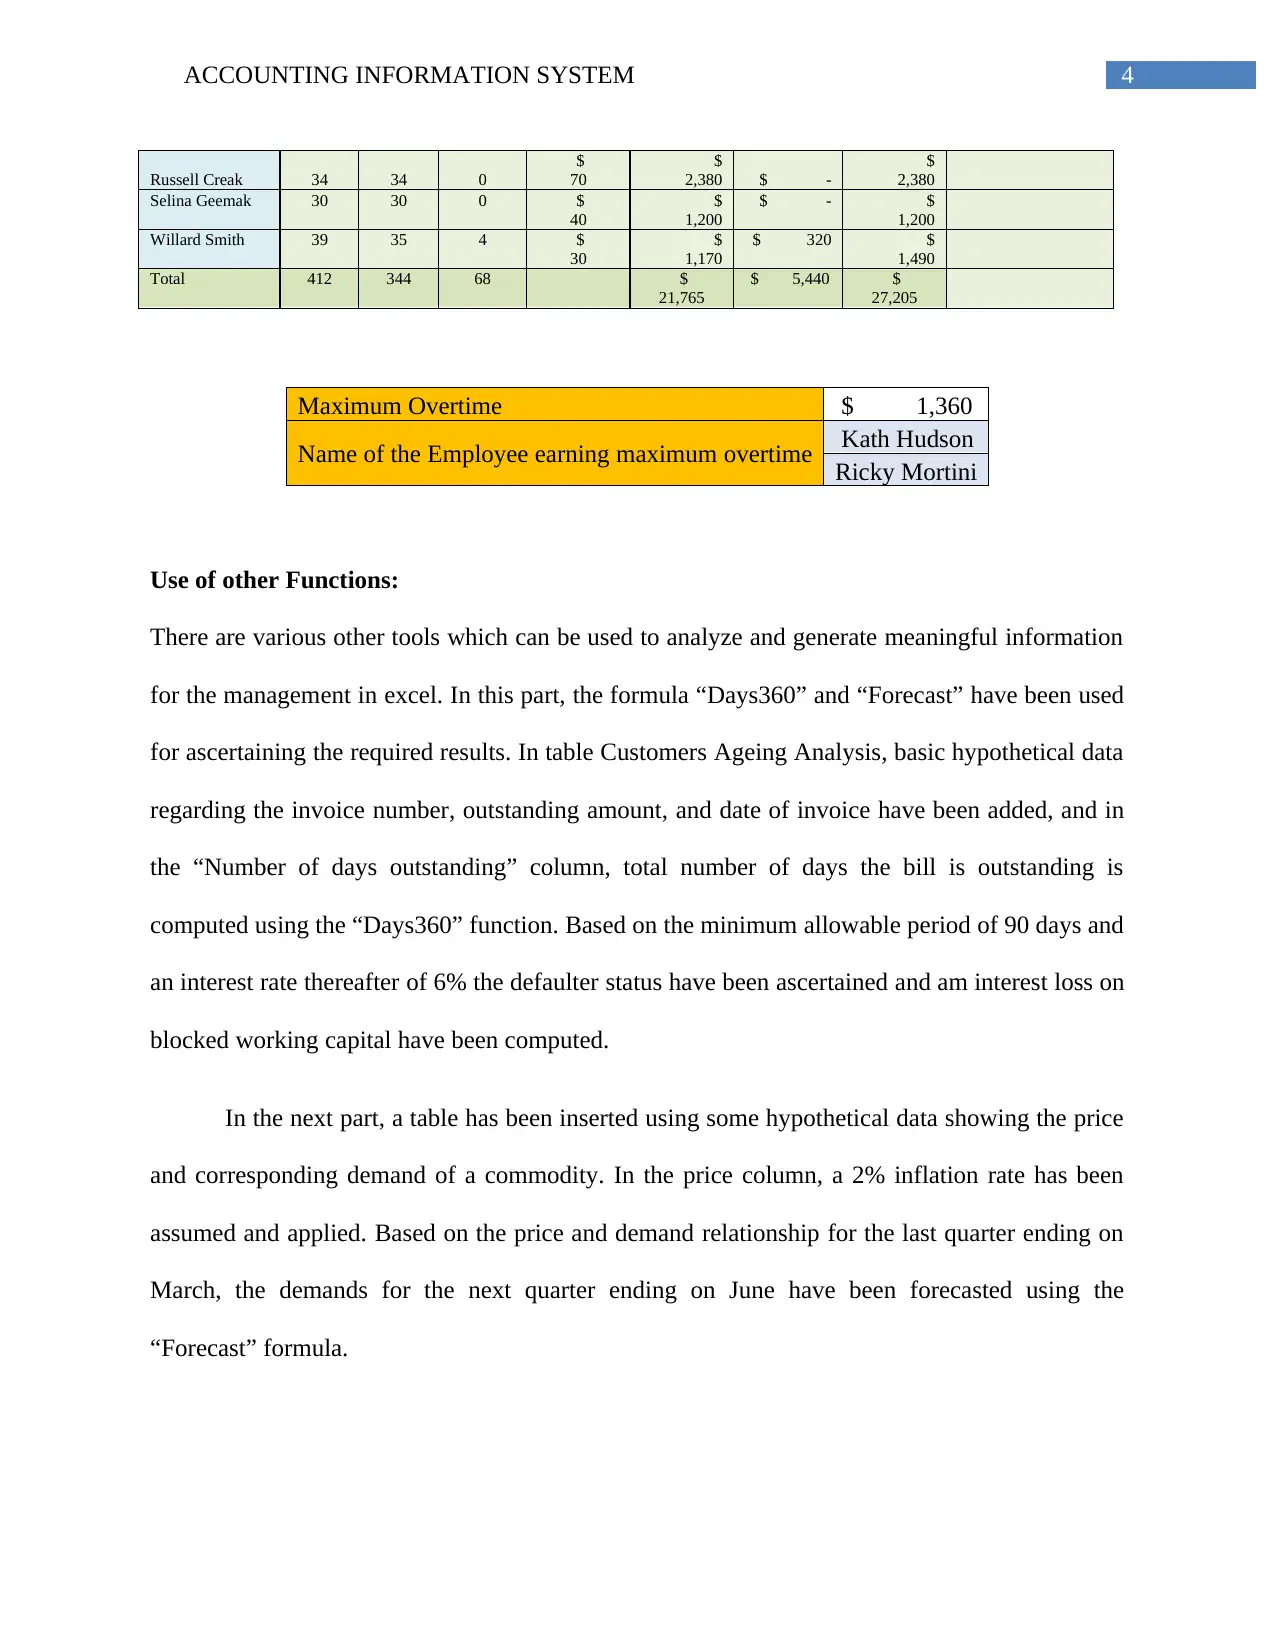
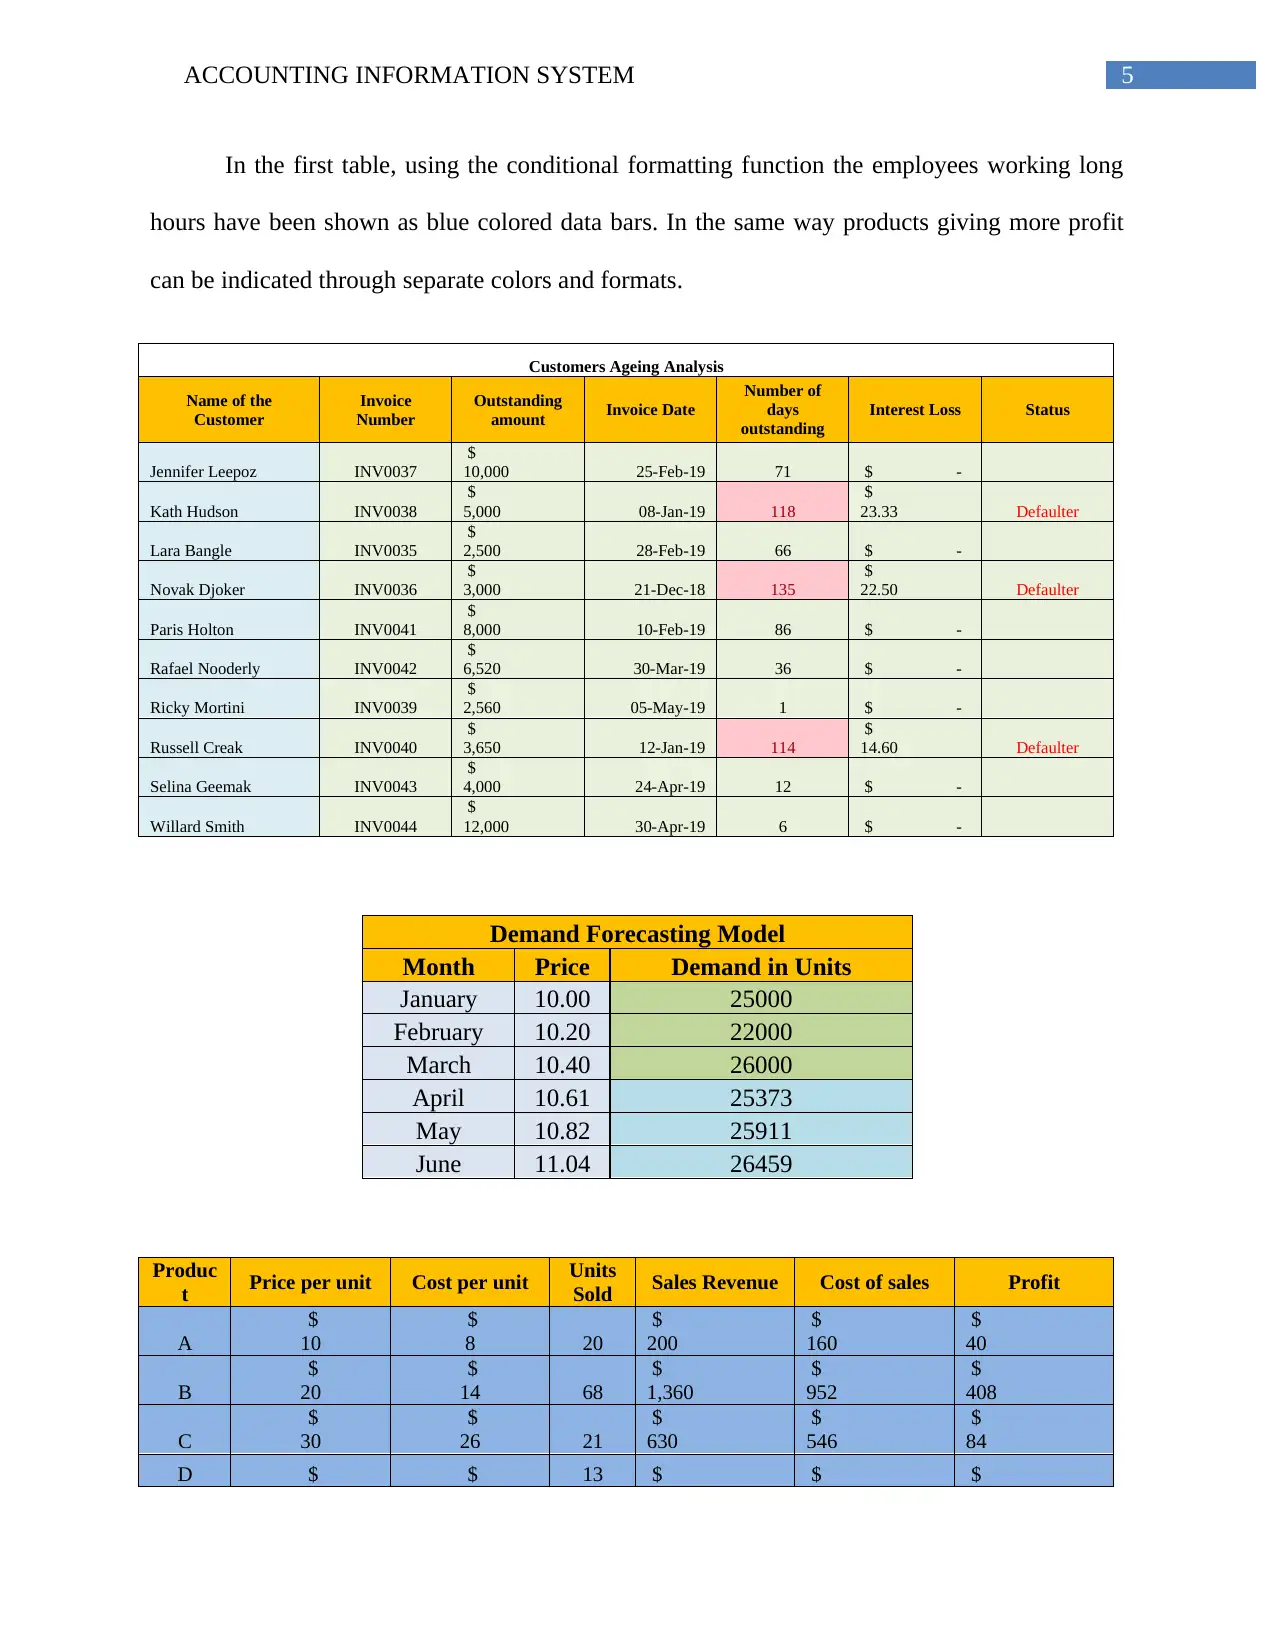
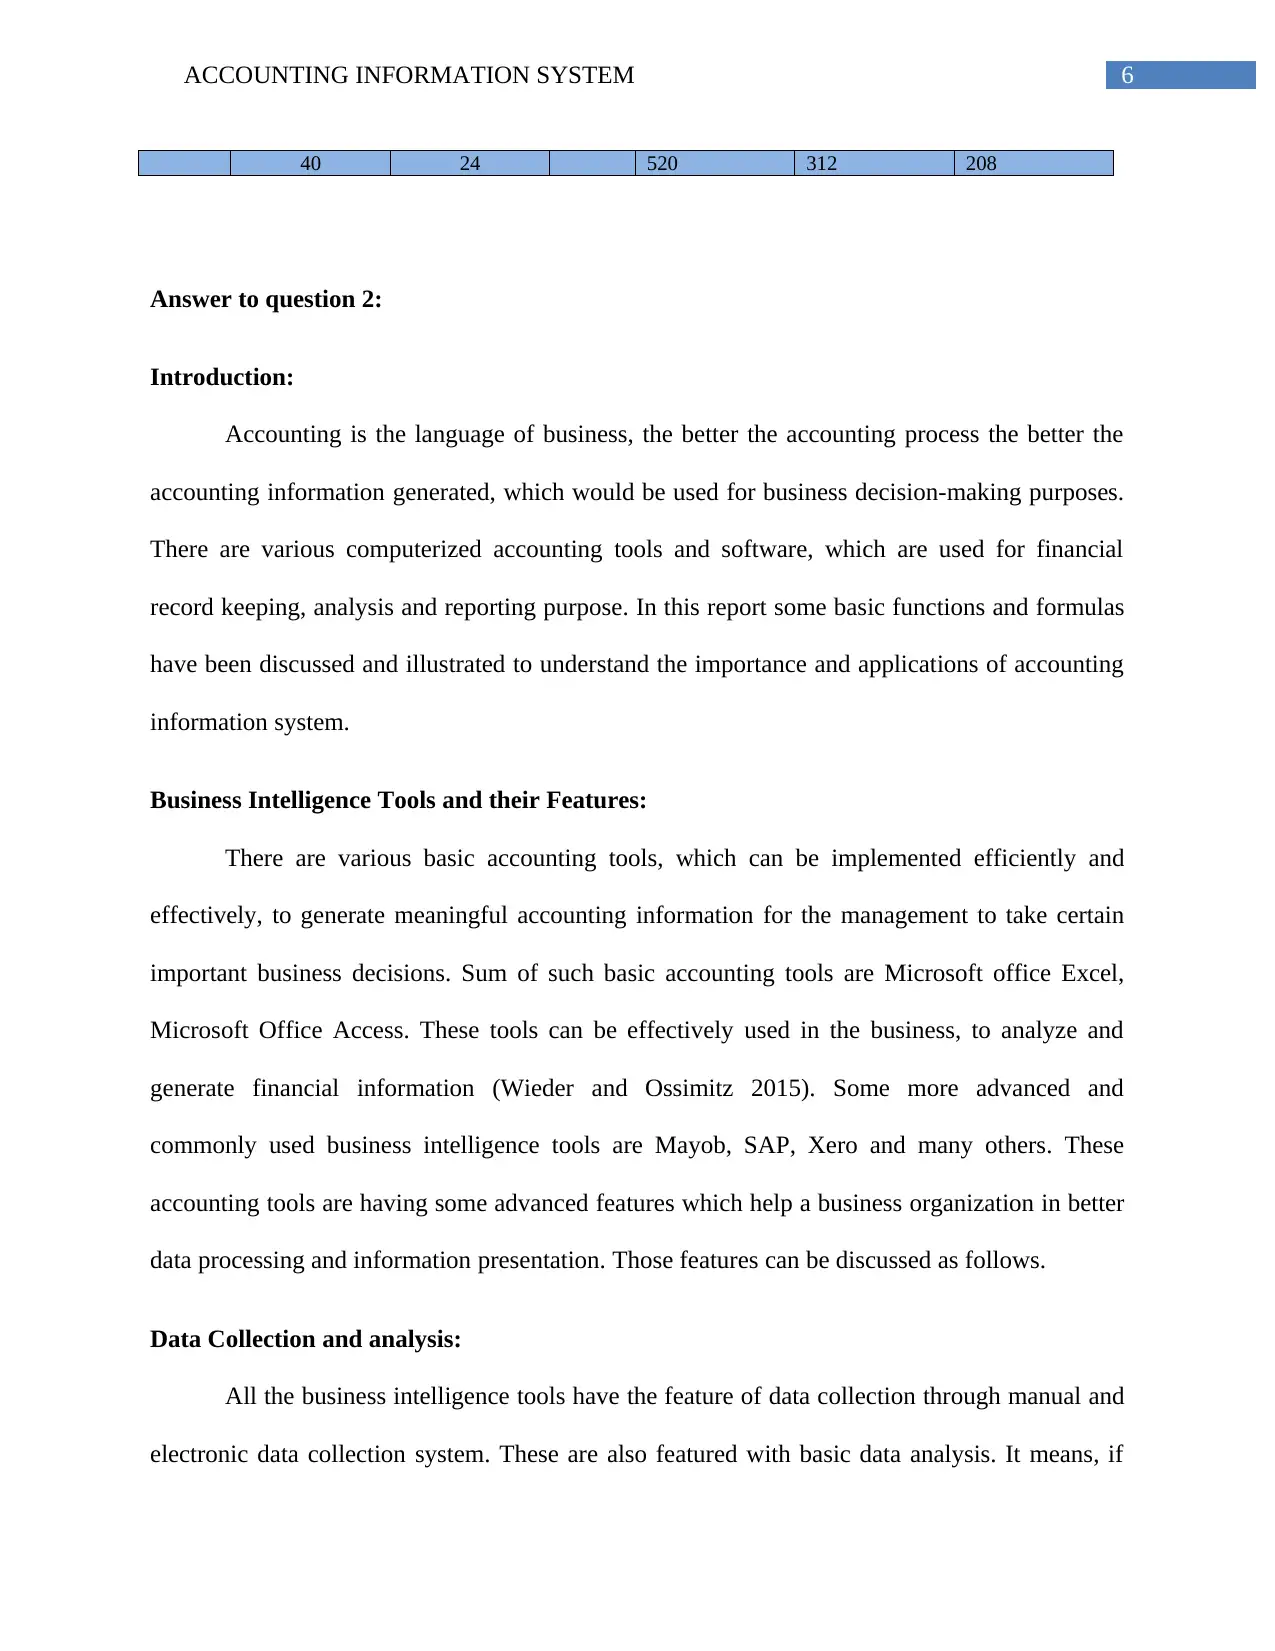
This assignment solution for ACC202, Accounting Information Systems, presents a comprehensive analysis of accounting principles using Microsoft Excel. The solution addresses two key questions. The first question demonstrates the application of Excel functions for financial analysis, including classification levels, hourly pay calculations, overtime pay, and employee bonus calculations. The second part explores the impact of emerging technologies such as Business Intelligence tools like Microsoft Office Excel, Microsoft Office Access, Mayob, SAP, and Xero, and their features on accounting and business decisions, including data collection, analysis, tracking, and interactive data visualizations. The solution also includes examples of data analysis using formulas like Days360 and Forecast, and how conditional formatting can be used to highlight important data points. The assignment showcases how Excel can be used to create customer ageing analysis and demand forecasting models. The document also includes a research report on the impact of emerging technologies on accounting and business decisions.
tabler-icon-diamond-filled.svg

Contribute Materials

Your contribution can guide someone’s learning journey. Share your documents today.
Document Page
Running head: ACCOUNTING INFORMATION SYSTEM
Accounting Information System
Name of the Student:
Name of the University:
Author’s Note:
tabler-icon-diamond-filled.svg

Secure Best Marks with AI Grader

Need help grading? Try our AI Grader for instant feedback on your assignments.
Document Page
1ACCOUNTING INFORMATION SYSTEM
Executive Summary:
This report aims at analyzing and understanding the accounting information and record
keeping system. Modern business is based on computerized and electronic data systems and
technologies. Accounting part of the business also not excluded from that revolution. There are
various applications of computerized tools and software, which helps in accurate record keeping
for accounting and analysis. In this report, some of such tools have been illustrated with practical
application in excel.
Document Page
2ACCOUNTING INFORMATION SYSTEM
Table of Contents
Answer to question 1:......................................................................................................................3
Application of functions in Excel:...............................................................................................3
Use of other Functions:................................................................................................................4
Answer to question 2:......................................................................................................................6
Introduction:................................................................................................................................6
Business Intelligence Tools and their Features:..........................................................................6
Data Collection and analysis:..................................................................................................6
Data Tracking:.........................................................................................................................7
Interactive Data Visualizations:...............................................................................................7
Conclusion:..................................................................................................................................8
References and bibliography:......................................................................................................9
Document Page
3ACCOUNTING INFORMATION SYSTEM
Answer to question 1:
Application of functions in Excel:
Classification Levels
Level Hourly Pay
1 30.00
2 40.00
3 50.00
4 60.00
5 65.00
6 70.00
Employee Name
Classification
Level
Hourly
Pay
Paris Holton 5 65.00
Ricky Mortini 4 60.00
Jennifer Leepoz 2 40.00
Selina Geemak 2 40.00
Willard Smith 1 30.00
Russell Creak 6 70.00
Rafael Nooderly 4 60.00
Novak Djoker 1 30.00
Lara Bangle 3 50.00
Kath Hudson 6 70.00
Employee Name
Hours
Worke
d
Regula
r Hours
Overtim
e Hours
Hourly
Pay
Base
Amount Over-time Total Pay
Name of Employee
Earning Maximum
Bonus
Jennifer Leepoz 41 35 6
$
40
$
1,640 $ 480
$
2,120
Kath Hudson 52 35 17
$
70
$
3,640 $ 1,360
$
5,000 Kath Hudson
Lara Bangle 40 35 5
$
50
$
2,000 $ 400
$
2,400
Novak Djoker 35 35 0
$
30
$
1,050 $ -
$
1,050
Paris Holton 45 35 10
$
65
$
2,925 $ 800
$
3,725
Rafael Nooderly 44 35 9
$
60
$
2,640 $ 720
$
3,360
Ricky Mortini 52 35 17
$
60
$
3,120 $ 1,360
$
4,480 Ricky Mortini
tabler-icon-diamond-filled.svg

Secure Best Marks with AI Grader

Need help grading? Try our AI Grader for instant feedback on your assignments.
Document Page
4ACCOUNTING INFORMATION SYSTEM
Russell Creak 34 34 0
$
70
$
2,380 $ -
$
2,380
Selina Geemak 30 30 0 $
40
$
1,200
$ - $
1,200
Willard Smith 39 35 4 $
30
$
1,170
$ 320 $
1,490
Total 412 344 68 $
21,765
$ 5,440 $
27,205
Maximum Overtime $ 1,360
Name of the Employee earning maximum overtime Kath Hudson
Ricky Mortini
Use of other Functions:
There are various other tools which can be used to analyze and generate meaningful information
for the management in excel. In this part, the formula “Days360” and “Forecast” have been used
for ascertaining the required results. In table Customers Ageing Analysis, basic hypothetical data
regarding the invoice number, outstanding amount, and date of invoice have been added, and in
the “Number of days outstanding” column, total number of days the bill is outstanding is
computed using the “Days360” function. Based on the minimum allowable period of 90 days and
an interest rate thereafter of 6% the defaulter status have been ascertained and am interest loss on
blocked working capital have been computed.
In the next part, a table has been inserted using some hypothetical data showing the price
and corresponding demand of a commodity. In the price column, a 2% inflation rate has been
assumed and applied. Based on the price and demand relationship for the last quarter ending on
March, the demands for the next quarter ending on June have been forecasted using the
“Forecast” formula.
Document Page
5ACCOUNTING INFORMATION SYSTEM
In the first table, using the conditional formatting function the employees working long
hours have been shown as blue colored data bars. In the same way products giving more profit
can be indicated through separate colors and formats.
Customers Ageing Analysis
Name of the
Customer
Invoice
Number
Outstanding
amount Invoice Date
Number of
days
outstanding
Interest Loss Status
Jennifer Leepoz INV0037
$
10,000 25-Feb-19 71 $ -
Kath Hudson INV0038
$
5,000 08-Jan-19 118
$
23.33 Defaulter
Lara Bangle INV0035
$
2,500 28-Feb-19 66 $ -
Novak Djoker INV0036
$
3,000 21-Dec-18 135
$
22.50 Defaulter
Paris Holton INV0041
$
8,000 10-Feb-19 86 $ -
Rafael Nooderly INV0042
$
6,520 30-Mar-19 36 $ -
Ricky Mortini INV0039
$
2,560 05-May-19 1 $ -
Russell Creak INV0040
$
3,650 12-Jan-19 114
$
14.60 Defaulter
Selina Geemak INV0043
$
4,000 24-Apr-19 12 $ -
Willard Smith INV0044
$
12,000 30-Apr-19 6 $ -
Demand Forecasting Model
Month Price Demand in Units
January 10.00 25000
February 10.20 22000
March 10.40 26000
April 10.61 25373
May 10.82 25911
June 11.04 26459
Produc
t Price per unit Cost per unit Units
Sold Sales Revenue Cost of sales Profit
A
$
10
$
8 20
$
200
$
160
$
40
B
$
20
$
14 68
$
1,360
$
952
$
408
C
$
30
$
26 21
$
630
$
546
$
84
D $ $ 13 $ $ $
Document Page
6ACCOUNTING INFORMATION SYSTEM
40 24 520 312 208
Answer to question 2:
Introduction:
Accounting is the language of business, the better the accounting process the better the
accounting information generated, which would be used for business decision-making purposes.
There are various computerized accounting tools and software, which are used for financial
record keeping, analysis and reporting purpose. In this report some basic functions and formulas
have been discussed and illustrated to understand the importance and applications of accounting
information system.
Business Intelligence Tools and their Features:
There are various basic accounting tools, which can be implemented efficiently and
effectively, to generate meaningful accounting information for the management to take certain
important business decisions. Sum of such basic accounting tools are Microsoft office Excel,
Microsoft Office Access. These tools can be effectively used in the business, to analyze and
generate financial information (Wieder and Ossimitz 2015). Some more advanced and
commonly used business intelligence tools are Mayob, SAP, Xero and many others. These
accounting tools are having some advanced features which help a business organization in better
data processing and information presentation. Those features can be discussed as follows.
Data Collection and analysis:
All the business intelligence tools have the feature of data collection through manual and
electronic data collection system. These are also featured with basic data analysis. It means, if
tabler-icon-diamond-filled.svg

Paraphrase This Document

Need a fresh take? Get an instant paraphrase of this document with our AI Paraphraser
Document Page
7ACCOUNTING INFORMATION SYSTEM
the basic inputs are given to these tools, it can process the data automatically and generate
information as per the requirements. All these tools have some functions through which the input
data can be provided to the package (Sauter 2014).
Data Tracking:
It can track data according to the data of transaction, date of entry or any other criteria.
This feature helps a business organization for ageing analysis of any information. It can track
data with reference to some pre set logic and references. Such as inventory system, in Mayob,
every inventory item is tracked starting from the opening balance, Purchase of inventory, Sales
of inventory and lastly presenting the closing inventory. It uses unique codes for each inventory
and pre set reference accounts for such tracking (Sauter 2014).
Interactive Data Visualizations:
Most of these Business Intelligence tools are having an advanced feature of presenting
information through some graphs and charts. This is known as interactive data visualization.
Such as in excel information can be presented in numeric figures as well as in charts and graphs.
It helps in better presentation of financial information. It becomes easier for the users of
information to interpret the information and to make decisions based on such information. The
interfaces of those tools are also based on graphical user interface. One can easily know which
icon is meant for which purpose (Zhu, Aouad and Lutter 2014). Most of these tools have a
dashboard or a gateway, where from all the actions can be taken in data processing. In the
dashboard also the present status of some key parameters are shown in numeric figures as well as
in graphs. For instance, in the Xero accounting software, balances in bank account, receivables,
and payables balances are shown in the dashboard with a small bar chart also (Zhu, Aouad and
Lutter 2014).
Document Page
8ACCOUNTING INFORMATION SYSTEM
Conclusion:
From the above discussions it can be concluded that, business intelligence tools are some
improved and advanced computerized analysis package, which can process millions of data
quickly and with accuracy. Application of such tools in the business purpose, can eliminate
human effort to a large extent and it can help in better data processing and information
presentation.
Document Page
9ACCOUNTING INFORMATION SYSTEM
References and bibliography:
Brandão, A., Pereira, E., Esteves, M., Portela, F., Santos, M., Abelha, A. and Machado, J., 2016.
A benchmarking analysis of open-source business intelligence tools in healthcare
environments. Information, 7(4), p.57.
Sauter, V.L., 2014. Decision support systems for business intelligence. John Wiley & Sons.
Wieder, B. and Ossimitz, M.L., 2015. The impact of Business Intelligence on the quality of
decision making–a mediation model. Procedia Computer Science, 64, pp.1163-1171.
Wu, D.D., Chen, S.H. and Olson, D.L., 2014. Business intelligence in risk management: Some
recent progresses. Information Sciences, 256, pp.1-7.
Zhu, Y., Aouad, M.B. and Lutter, S., Business Objects Software Ltd, 2014. Systems and methods
for accessing a nosql database using business intelligence tools. U.S. Patent Application
13/755,203.
chevron_up_icon
1 out of 10
circle_padding
hide_on_mobile
zoom_out_icon
logo.png

Your All-in-One AI-Powered Toolkit for Academic Success.

Available 24*7 on WhatsApp / Email

[object Object]