CISM4000 Accounting Information Systems: Excel & Case Study Analysis
VerifiedAdded on 2022/09/25
|12
|2397
|27
Report
AI Summary
This assignment report for Accounting Information Systems (CISM4000) presents a comprehensive analysis of accounting principles and practices. The report begins with an Excel-based analysis, including payroll table construction and the application of functions like INDEX MATCH and IF. It then delves into the growth of business intelligence, examining trends in big data and the features of business intelligence tools like Executive Dashboards and Interactive Reports. The assignment also includes a case study on the Enron scandal, discussing the ethical code of conduct in business operations, the causes of Enron's downfall, and the subsequent regulations introduced, such as the Sarbanes-Oxley Act. The report emphasizes the importance of ethical practices, accounting standards, and the role of regulatory bodies in maintaining transparency and accountability in the financial market.
Running head: ACCOUNTING INFORMATION SYSTEM
Accounting Information System
Name of the Student
Name of the University
Author Note
Accounting Information System
Name of the Student
Name of the University
Author Note
Paraphrase This Document
Need a fresh take? Get an instant paraphrase of this document with our AI Paraphraser
1ACCOUNTING INFORMATION SYSTEM
Table of Contents
Question 1:.......................................................................................................................................2
2. Portraying the Payroll table:....................................................................................................2
3. Discussing, justifying and illustrating two more functions that can be included to help with
the decision-making process:.......................................................................................................2
Question 2:.......................................................................................................................................3
1. Describing the growth of business intelligence in the past few decades (Analysis of the
growing trend of business intelligence of previous years):.........................................................3
2. Briefly illustrating at least 2 features of commonly used business intelligence tools that
support the business decision-making:........................................................................................6
Executive Dashboard:..................................................................................................................6
Interactive Reports:......................................................................................................................7
Question 3........................................................................................................................................7
Regulations Brought in After the Scandal...................................................................................8
Reference.......................................................................................................................................10
2ACCOUNTING INFORMATION SYSTEM
Question 1:
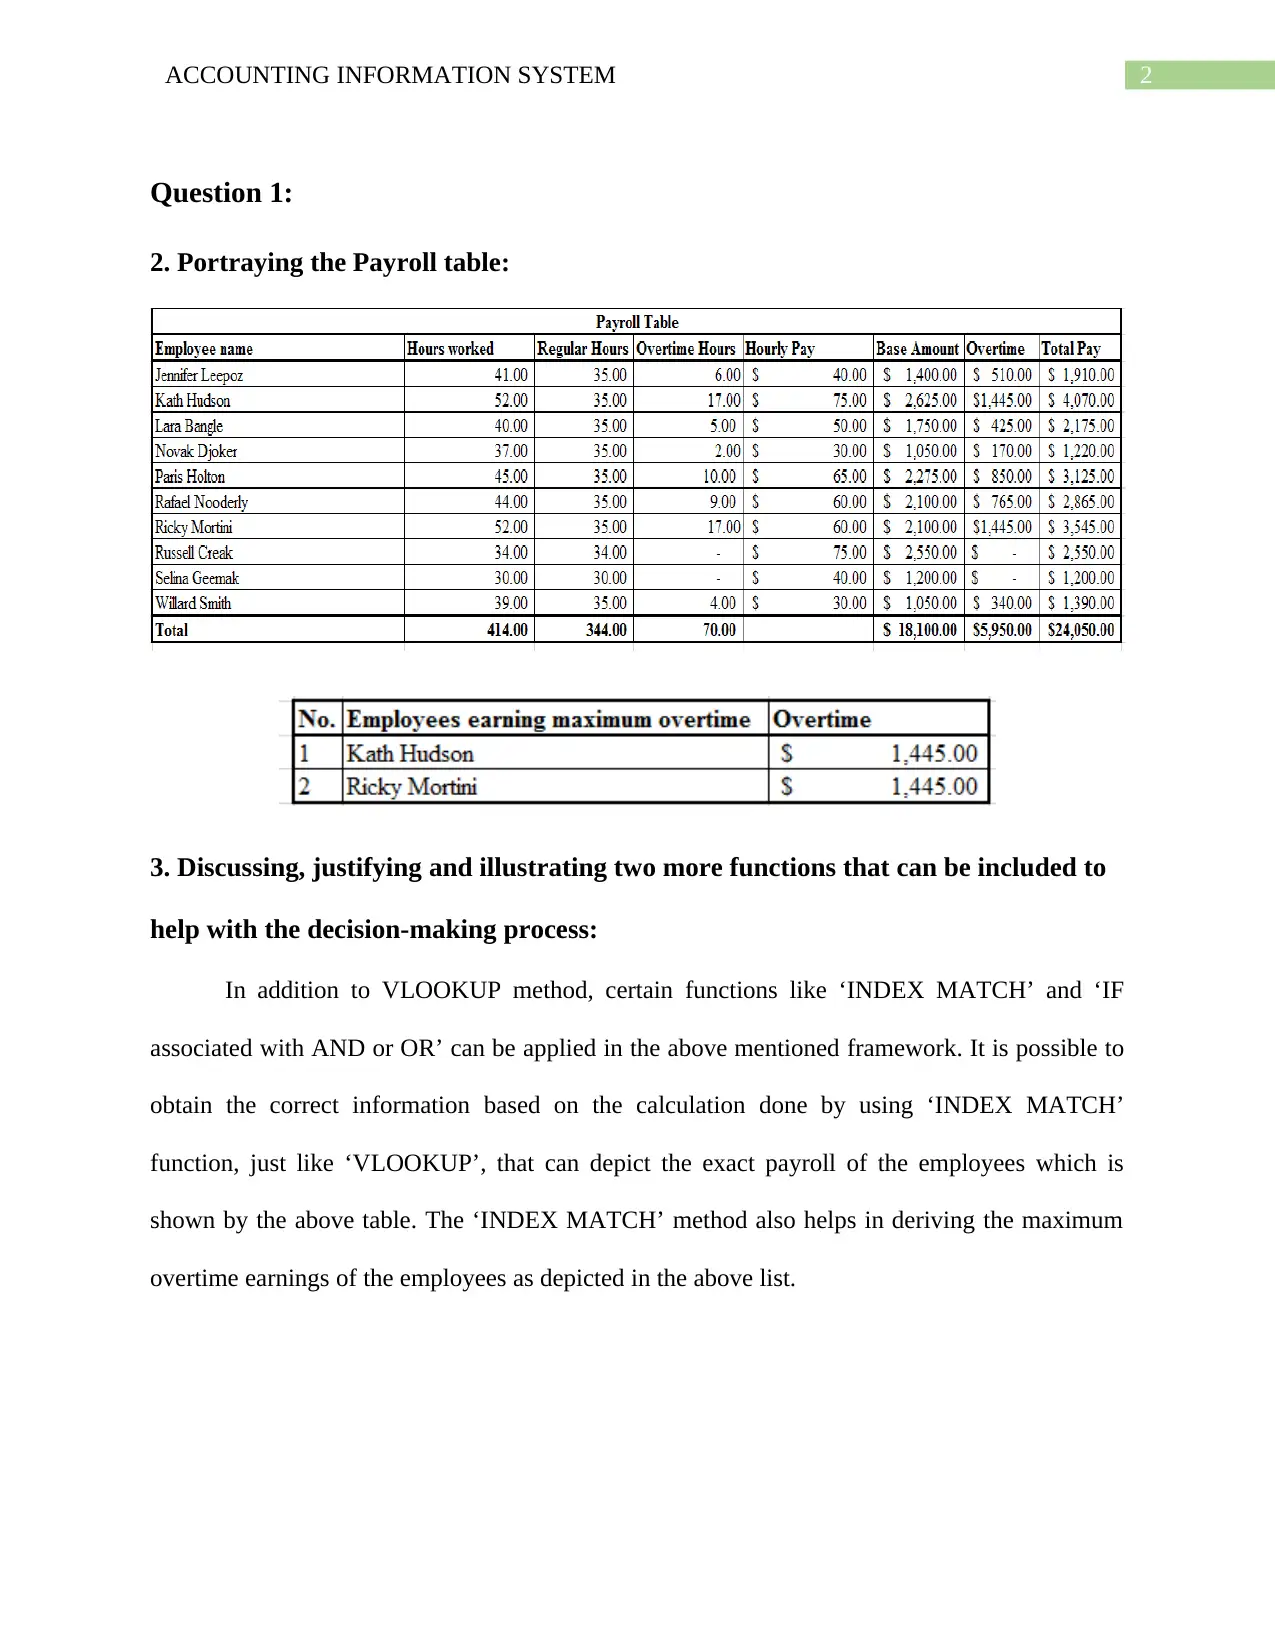
2. Portraying the Payroll table:
3. Discussing, justifying and illustrating two more functions that can be included to
help with the decision-making process:
In addition to VLOOKUP method, certain functions like ‘INDEX MATCH’ and ‘IF
associated with AND or OR’ can be applied in the above mentioned framework. It is possible to
obtain the correct information based on the calculation done by using ‘INDEX MATCH’
function, just like ‘VLOOKUP’, that can depict the exact payroll of the employees which is
shown by the above table. The ‘INDEX MATCH’ method also helps in deriving the maximum
overtime earnings of the employees as depicted in the above list.
Question 1:
2. Portraying the Payroll table:
3. Discussing, justifying and illustrating two more functions that can be included to
help with the decision-making process:
In addition to VLOOKUP method, certain functions like ‘INDEX MATCH’ and ‘IF
associated with AND or OR’ can be applied in the above mentioned framework. It is possible to
obtain the correct information based on the calculation done by using ‘INDEX MATCH’
function, just like ‘VLOOKUP’, that can depict the exact payroll of the employees which is
shown by the above table. The ‘INDEX MATCH’ method also helps in deriving the maximum
overtime earnings of the employees as depicted in the above list.
⊘ This is a preview!⊘
Do you want full access?
Subscribe today to unlock all pages.
Trusted by 1+ million students worldwide
3ACCOUNTING INFORMATION SYSTEM
Question 2:
1. Describing the growth of business intelligence in the past few decades (Analysis
of the growing trend of business intelligence of previous years):
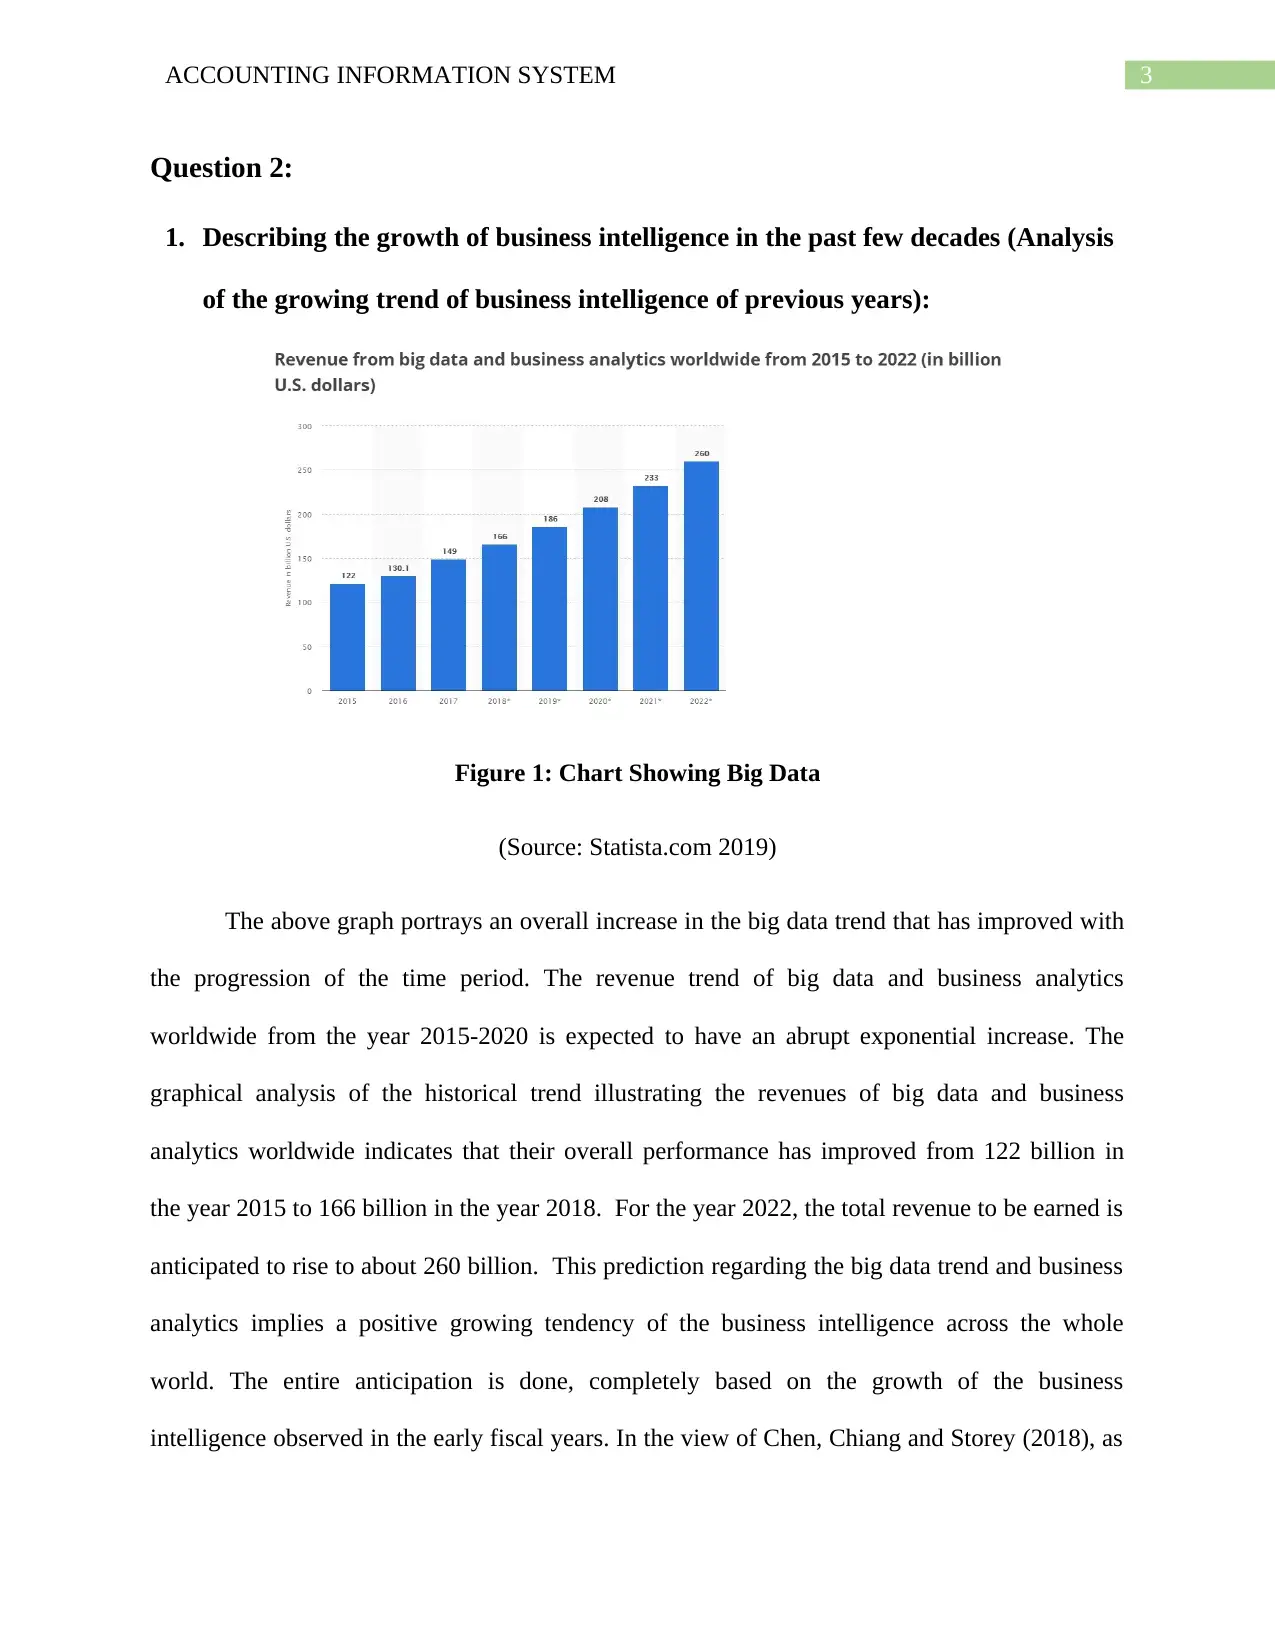
Figure 1: Chart Showing Big Data
(Source: Statista.com 2019)
The above graph portrays an overall increase in the big data trend that has improved with
the progression of the time period. The revenue trend of big data and business analytics
worldwide from the year 2015-2020 is expected to have an abrupt exponential increase. The
graphical analysis of the historical trend illustrating the revenues of big data and business
analytics worldwide indicates that their overall performance has improved from 122 billion in
the year 2015 to 166 billion in the year 2018. For the year 2022, the total revenue to be earned is
anticipated to rise to about 260 billion. This prediction regarding the big data trend and business
analytics implies a positive growing tendency of the business intelligence across the whole
world. The entire anticipation is done, completely based on the growth of the business
intelligence observed in the early fiscal years. In the view of Chen, Chiang and Storey (2018), as
Question 2:
1. Describing the growth of business intelligence in the past few decades (Analysis
of the growing trend of business intelligence of previous years):
Figure 1: Chart Showing Big Data
(Source: Statista.com 2019)
The above graph portrays an overall increase in the big data trend that has improved with
the progression of the time period. The revenue trend of big data and business analytics
worldwide from the year 2015-2020 is expected to have an abrupt exponential increase. The
graphical analysis of the historical trend illustrating the revenues of big data and business
analytics worldwide indicates that their overall performance has improved from 122 billion in
the year 2015 to 166 billion in the year 2018. For the year 2022, the total revenue to be earned is
anticipated to rise to about 260 billion. This prediction regarding the big data trend and business
analytics implies a positive growing tendency of the business intelligence across the whole
world. The entire anticipation is done, completely based on the growth of the business
intelligence observed in the early fiscal years. In the view of Chen, Chiang and Storey (2018), as
Paraphrase This Document
Need a fresh take? Get an instant paraphrase of this document with our AI Paraphraser
4ACCOUNTING INFORMATION SYSTEM
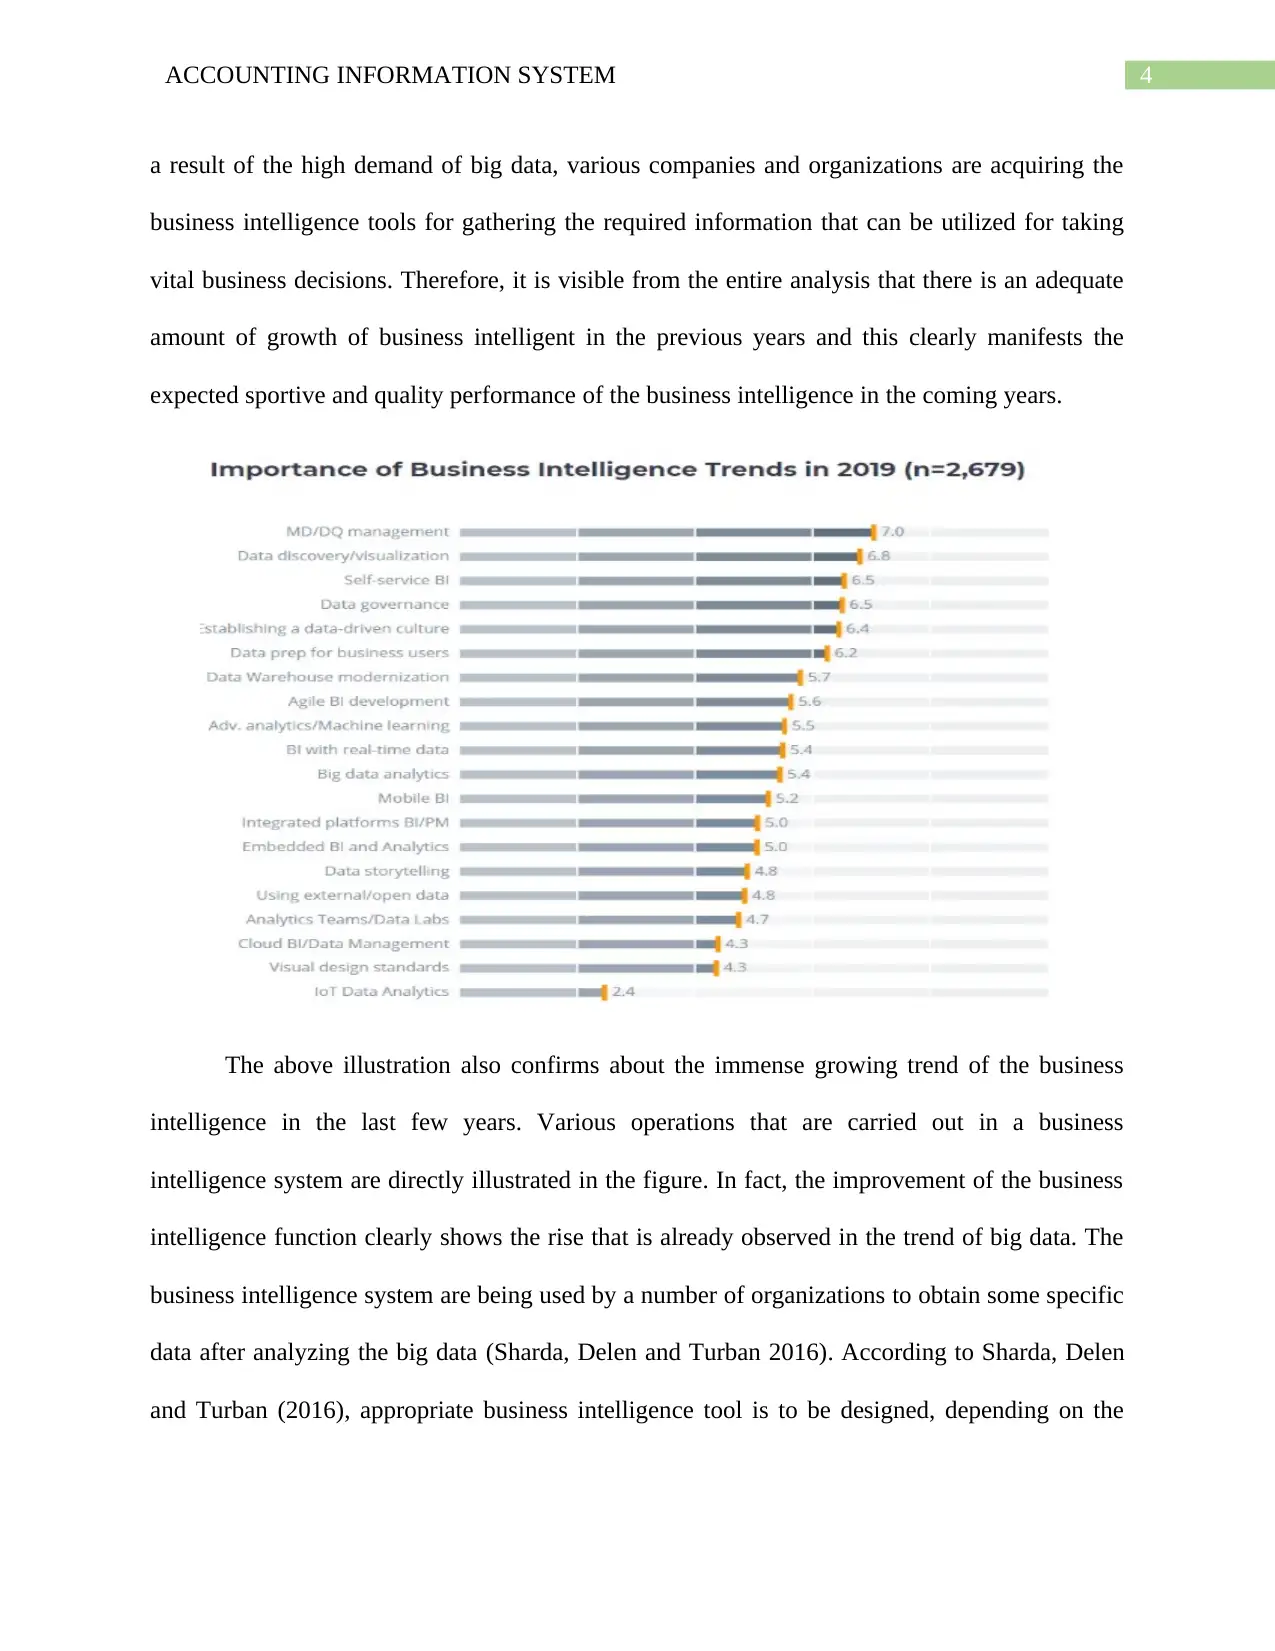
a result of the high demand of big data, various companies and organizations are acquiring the
business intelligence tools for gathering the required information that can be utilized for taking
vital business decisions. Therefore, it is visible from the entire analysis that there is an adequate
amount of growth of business intelligent in the previous years and this clearly manifests the
expected sportive and quality performance of the business intelligence in the coming years.
The above illustration also confirms about the immense growing trend of the business
intelligence in the last few years. Various operations that are carried out in a business
intelligence system are directly illustrated in the figure. In fact, the improvement of the business
intelligence function clearly shows the rise that is already observed in the trend of big data. The
business intelligence system are being used by a number of organizations to obtain some specific
data after analyzing the big data (Sharda, Delen and Turban 2016). According to Sharda, Delen
and Turban (2016), appropriate business intelligence tool is to be designed, depending on the
5ACCOUNTING INFORMATION SYSTEM
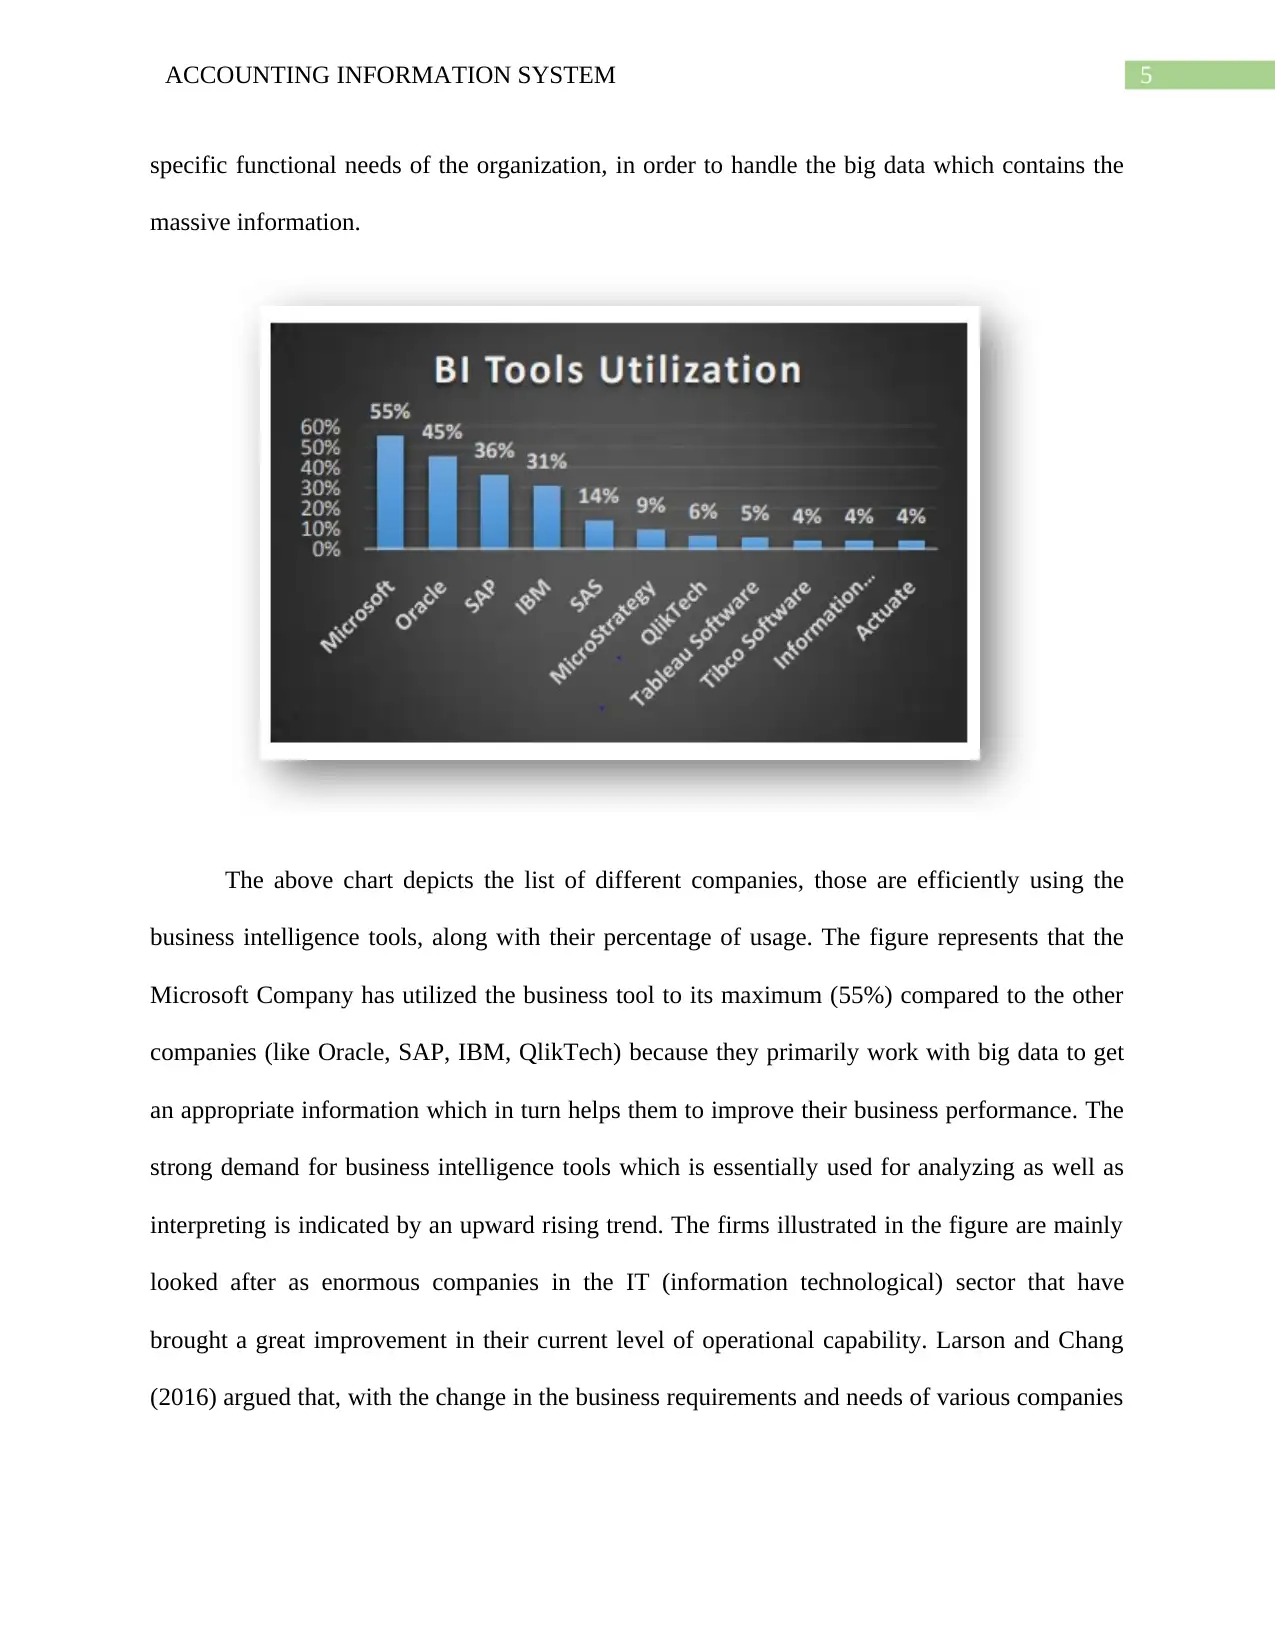
specific functional needs of the organization, in order to handle the big data which contains the
massive information.
The above chart depicts the list of different companies, those are efficiently using the
business intelligence tools, along with their percentage of usage. The figure represents that the
Microsoft Company has utilized the business tool to its maximum (55%) compared to the other
companies (like Oracle, SAP, IBM, QlikTech) because they primarily work with big data to get
an appropriate information which in turn helps them to improve their business performance. The
strong demand for business intelligence tools which is essentially used for analyzing as well as
interpreting is indicated by an upward rising trend. The firms illustrated in the figure are mainly
looked after as enormous companies in the IT (information technological) sector that have
brought a great improvement in their current level of operational capability. Larson and Chang
(2016) argued that, with the change in the business requirements and needs of various companies
⊘ This is a preview!⊘
Do you want full access?
Subscribe today to unlock all pages.
Trusted by 1+ million students worldwide
6ACCOUNTING INFORMATION SYSTEM
along with the passage of time, the business intelligence tools have also undergone certain
changes and improvements
2. Briefly illustrating at least 2 features of commonly used business intelligence tools
that support the business decision-making:
There are certain features which are specific to the business intelligence tools that assists
the organizations to undertake accurate and good decisions. The features of the tools are fairly
particular in nature and enables a company to derive suitable information, those are essential for
their better performance in addition of giving supporting their process. Organizations and
companies use the business intelligence tools for their decision-making process by adequate
modelling, analyzing and interpreting (Laursen and Thorlund 2016). Executive Dashboard and
Interactive Reports are two significant features of business intelligence system that the
companies use for their decision making process depending on the obtained information. The
two note-worthy features utilized by business intelligence tools are explained below:
Executive Dashboard:
The executive dashboards presents necessary real time data to the organizations that play
an important role in the process of company’s decision making. It gives scope to the
organizations to measure the urgent information, where the response time of external as well as
internal events are minimized. In addition to this, the executive dashboard also enables the
owners to search and find out the vital performance indicators, besides providing general
information. Laursen and Thorlund (2016) state that the dashboard helps in yielding relevant
information by constructing an immediate process for recognizing information those are not
relevant for any particular company in making the required decision in accurate way.
Paraphrase This Document
Need a fresh take? Get an instant paraphrase of this document with our AI Paraphraser
7ACCOUNTING INFORMATION SYSTEM
Interactive Reports:
Interactive report is another significant feature of business intelligence system, in
addition to the Executive Dashboard that has been discussed previously. The interactive reports
assist in converting the massive information of big data into concise form, thereby supplying
proper knowledge to the company for fruitful decision taking. The report helps the owners to use
the information directly, after analyzing the information obtained from big data with the aid
business intelligence tools (Larson and Chang 2016). Thorough evaluation of various aspects
derived from the report are done by utilizing business intelligence tools along with critical
analysis of data to get the necessary information essential for the user. The overall analysis of the
collected data is conducted with the help of regression and moving average system. Moreover,
analysis of relevantly large amount of data is possible by this tools that are directly examined,
scanned, scrutinized and evaluated to trace out, whether there is any anomaly or peculiarity in
the data set. The interactive report thoroughly examines each and every section of the data for
ensuring higher level of data accuracy that can be used for further data analysis for supporting
the process of decision taking of any organization.
Question 3
The ethical code of conduct in the operation of a business is very important in business
and can effectively help the business to maintain ethical standards in the operational process of
the business. The case of Enron which is covered in the assessment would be showing the
downfall of the company which is Enron. The story of Enron shows a company which was
considered to be one of the growing companies in the business and then how the company fell
within a short period of time. The code of conduct is considered to be important for ethically
8ACCOUNTING INFORMATION SYSTEM
managing the operations of the business and also ensuring that a systematic code of Conduct was
introduced in the business.
Enron was a fast-developing company which was formed in 1985 by merging the
business of Houston Natural Gas and InterNorth. The company was considered to be one
growing companies in the country. The downfall of the company started when the senior
management of the company and the staff of executives of the business effectively covered the
losses and debts which the company incurred from failed deals and projects (Eckhaus and
Sheaffer 2018). The staff members of the business using accounting loops, special purpose
entities and poor financial health of the business. The business was engaged in off balance sheet
transaction which shows appropriate presentation of the balance sheet of the business but the
actual case was not the same. The business had systematically covered its losses over the years
so that it can portray appropriate financial statements and thereby protect the market valuation of
the business. The business also pressurized the audit firm of Anderson to ignore the issue and
provide an appropriate audit opinion to the company. It is for these reasons that led to the
downfall of the business and ultimately to the dissolution of the business (Bishop 2013). It was
when the scandal was discovered that the share price of the business was one freefall which
ultimately led to the bankruptcy of the business. One of the major reasons which can be
identified for the downfall of the business of Enron is poor accounting policies of the business
and unethical practices which was followed in the business. In addition to this, the audit
procedure which was conducted on the business of Enron revealed that there were significant
risks associated with the business but the auditor ignored the same. The management and auditor
of Enron faced criminal charges and strict regulations were also brought about in the operations
of similar businesses.
⊘ This is a preview!⊘
Do you want full access?
Subscribe today to unlock all pages.
Trusted by 1+ million students worldwide
9ACCOUNTING INFORMATION SYSTEM
Regulations Brought in After the Scandal
The collapse of Enron severely affects the financial market and also affected the
shareholders and employees of the business. In order to combat the situation in the market,
Sarbanes-Oxley Act was introduced which aimed to ensure that the severe consequence was
faced by businesses which were engaged in destroying, altering or fabricating the financial
statements of the business with the intention of defrauding the shareholders of the business. The
Financial Accounting Standard Board substantially enhanced the ethical requirements which a
business needed to follow (Ft.com. 2019). In addition to this, more power was provided to the
audit committee for ensuring that no risk is faced by the auditor which investigating the books of
accounts of the business. In addition to this, more powers and independence was provided to the
board of directors of the business so that they can effectively monitor the operations of the
business and also avoid the loopholes which affect the accounting process as a whole. It was
after the Enron scandal that the focus was shifted to ethical practices in the operations of the
business and emphasis was provided on implementation of APES 110 in a business so that the
integrity and accountability can be maintained in the operational process of the business.
Therefore, it can be said that the scandal of Enron brought about significant regulations in
the market and the focus was to stop corporate and accounting frauds which affect the
shareholders and employees. In addition to this, severe penalty was also introduced by the
government with a view point of discouraging any such behavior in the business environment. In
addition to this, major government bodies were empowered to ensure that such an incident did
not take place in future (Exactearth.com. 2019). The role of Financial Accounting Standard
Board became important for regulating the accounting process and treatment which were
Paraphrase This Document
Need a fresh take? Get an instant paraphrase of this document with our AI Paraphraser
10ACCOUNTING INFORMATION SYSTEM
followed by the business and it was also the role of the accounting board that transparency and
accountability was maintained in the operational process of the business.
Reference
Bishop, W.H., 2013. The role of ethics in 21st century organizations. Journal of Business
Ethics, 118(3), pp.635-637.
Eckhaus, E. and Sheaffer, Z., 2018. Managerial hubris detection: the case of Enron. Risk
Management, 20(4), pp.304-325.
Exactearth.com. 2019. Code of Ethics. [online] Available at: https://www.exactearth.com/code-
of-ethics [Accessed 28 Aug. 2019].
Ft.com. 2019. Enron’s fall raised the bar in regulation | Financial Times. [online] Available at:
https://www.ft.com/content/9790ea78-1aa9-11e1-ae14-00144feabdc0 [Accessed 28 Aug. 2019].
Larson, D. and Chang, V., 2016. A review and future direction of agile, business intelligence,
analytics and data science. International Journal of Information Management, 36(5), pp.700-
710.
Laursen, G.H. and Thorlund, J., 2016. Business analytics for managers: Taking business
intelligence beyond reporting. John Wiley & Sons.
Sharda, R., Delen, D. and Turban, E., 2016. Business intelligence, analytics, and data science: a
managerial perspective. Pearson.
11ACCOUNTING INFORMATION SYSTEM
Statista.com. 2019. Global big data and business analytics revenue 2015-2022 | Statistic.
[online] Statista. Available at: https://www.statista.com/statistics/551501/worldwide-big-data-
business-analytics-revenue/ [Accessed 3 Jan. 2019].
Statista.com. 2019. Global big data and business analytics revenue 2015-2022 | Statistic.
[online] Statista. Available at: https://www.statista.com/statistics/551501/worldwide-big-data-
business-analytics-revenue/ [Accessed 3 Jan. 2019].
⊘ This is a preview!⊘
Do you want full access?
Subscribe today to unlock all pages.
Trusted by 1+ million students worldwide
1 out of 12
Related Documents


Your All-in-One AI-Powered Toolkit for Academic Success.
+13062052269
info@desklib.com
Available 24*7 on WhatsApp / Email
![[object Object]](/_next/static/media/star-bottom.7253800d.svg)
Unlock your academic potential
Copyright © 2020–2026 A2Z Services. All Rights Reserved. Developed and managed by ZUCOL.