Accounting and Finance Report: Capital Structure Analysis of ANZ Bank

Verified

Added on  2023/05/27

|14
|2499
|313
Report
AI Summary
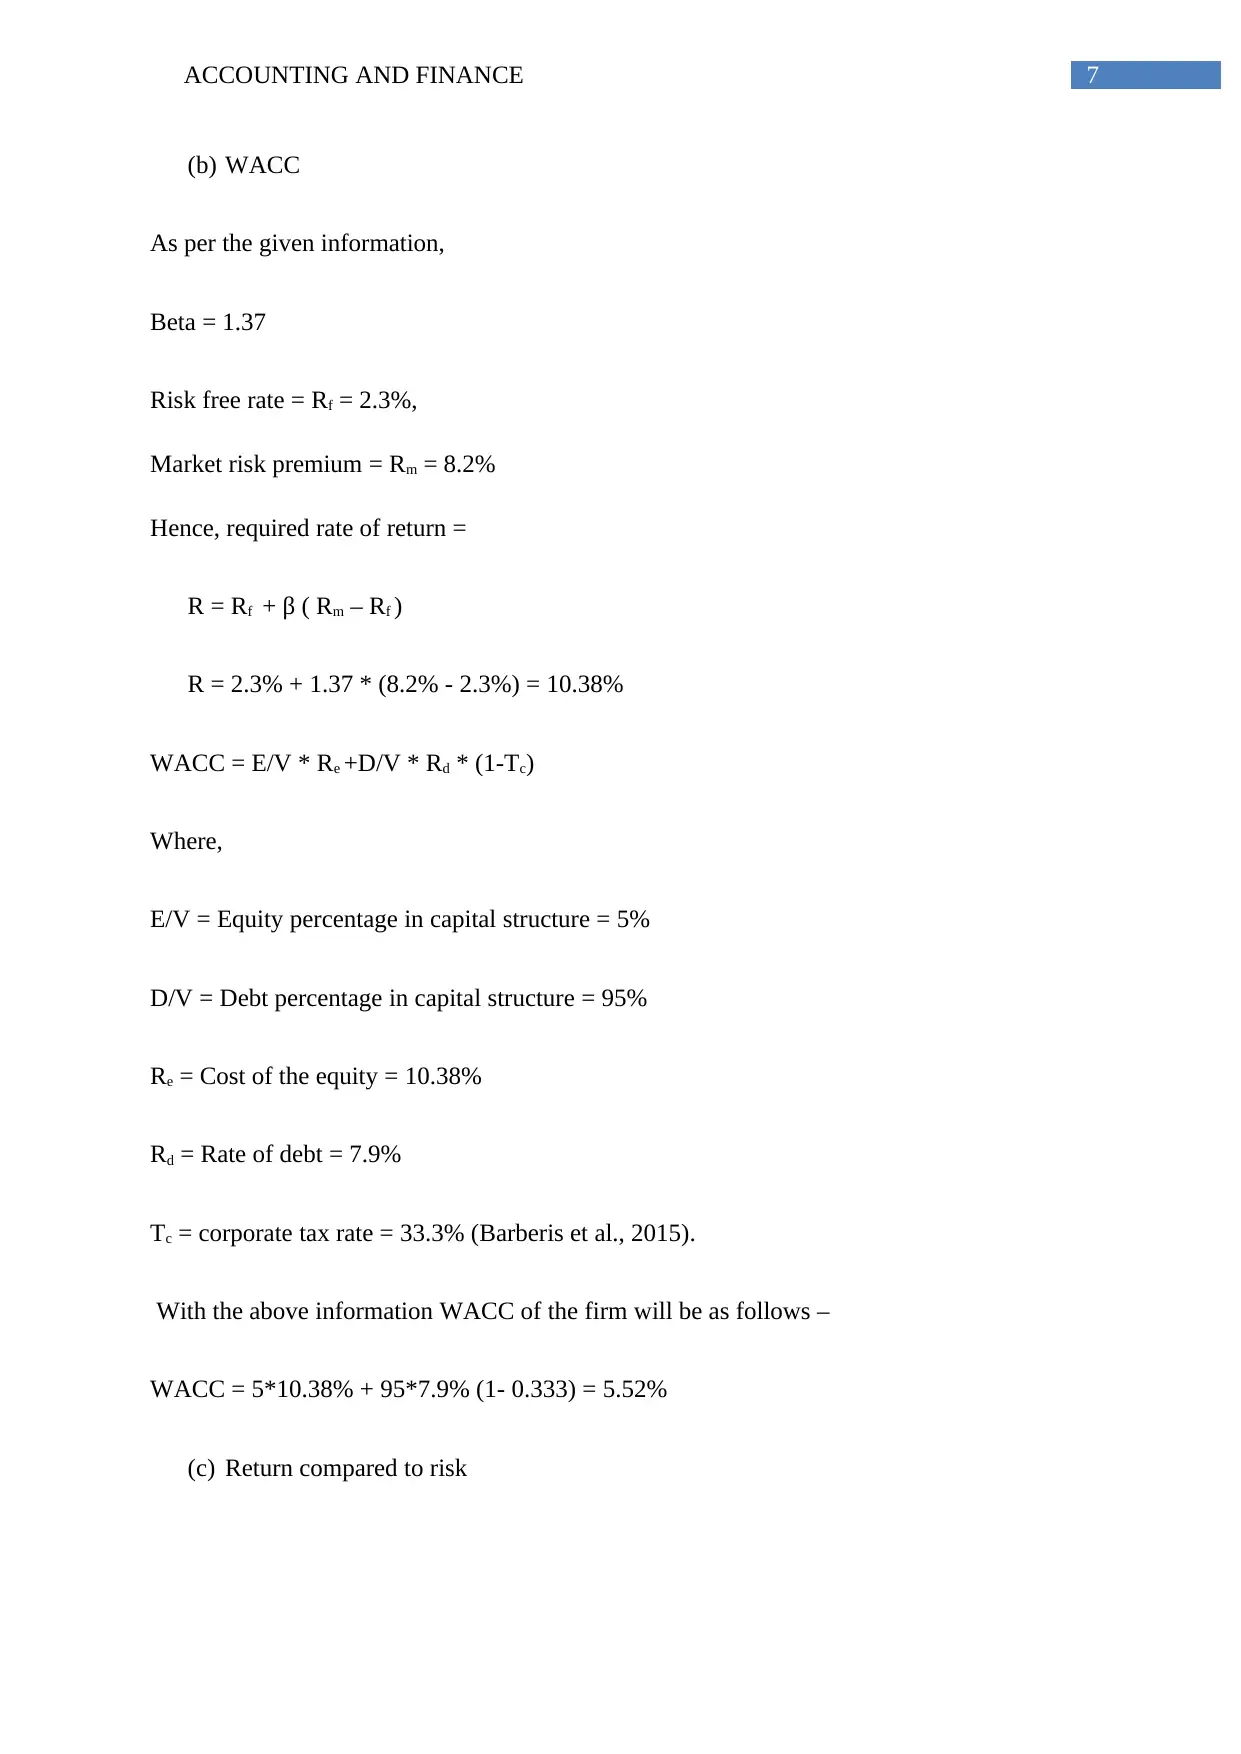
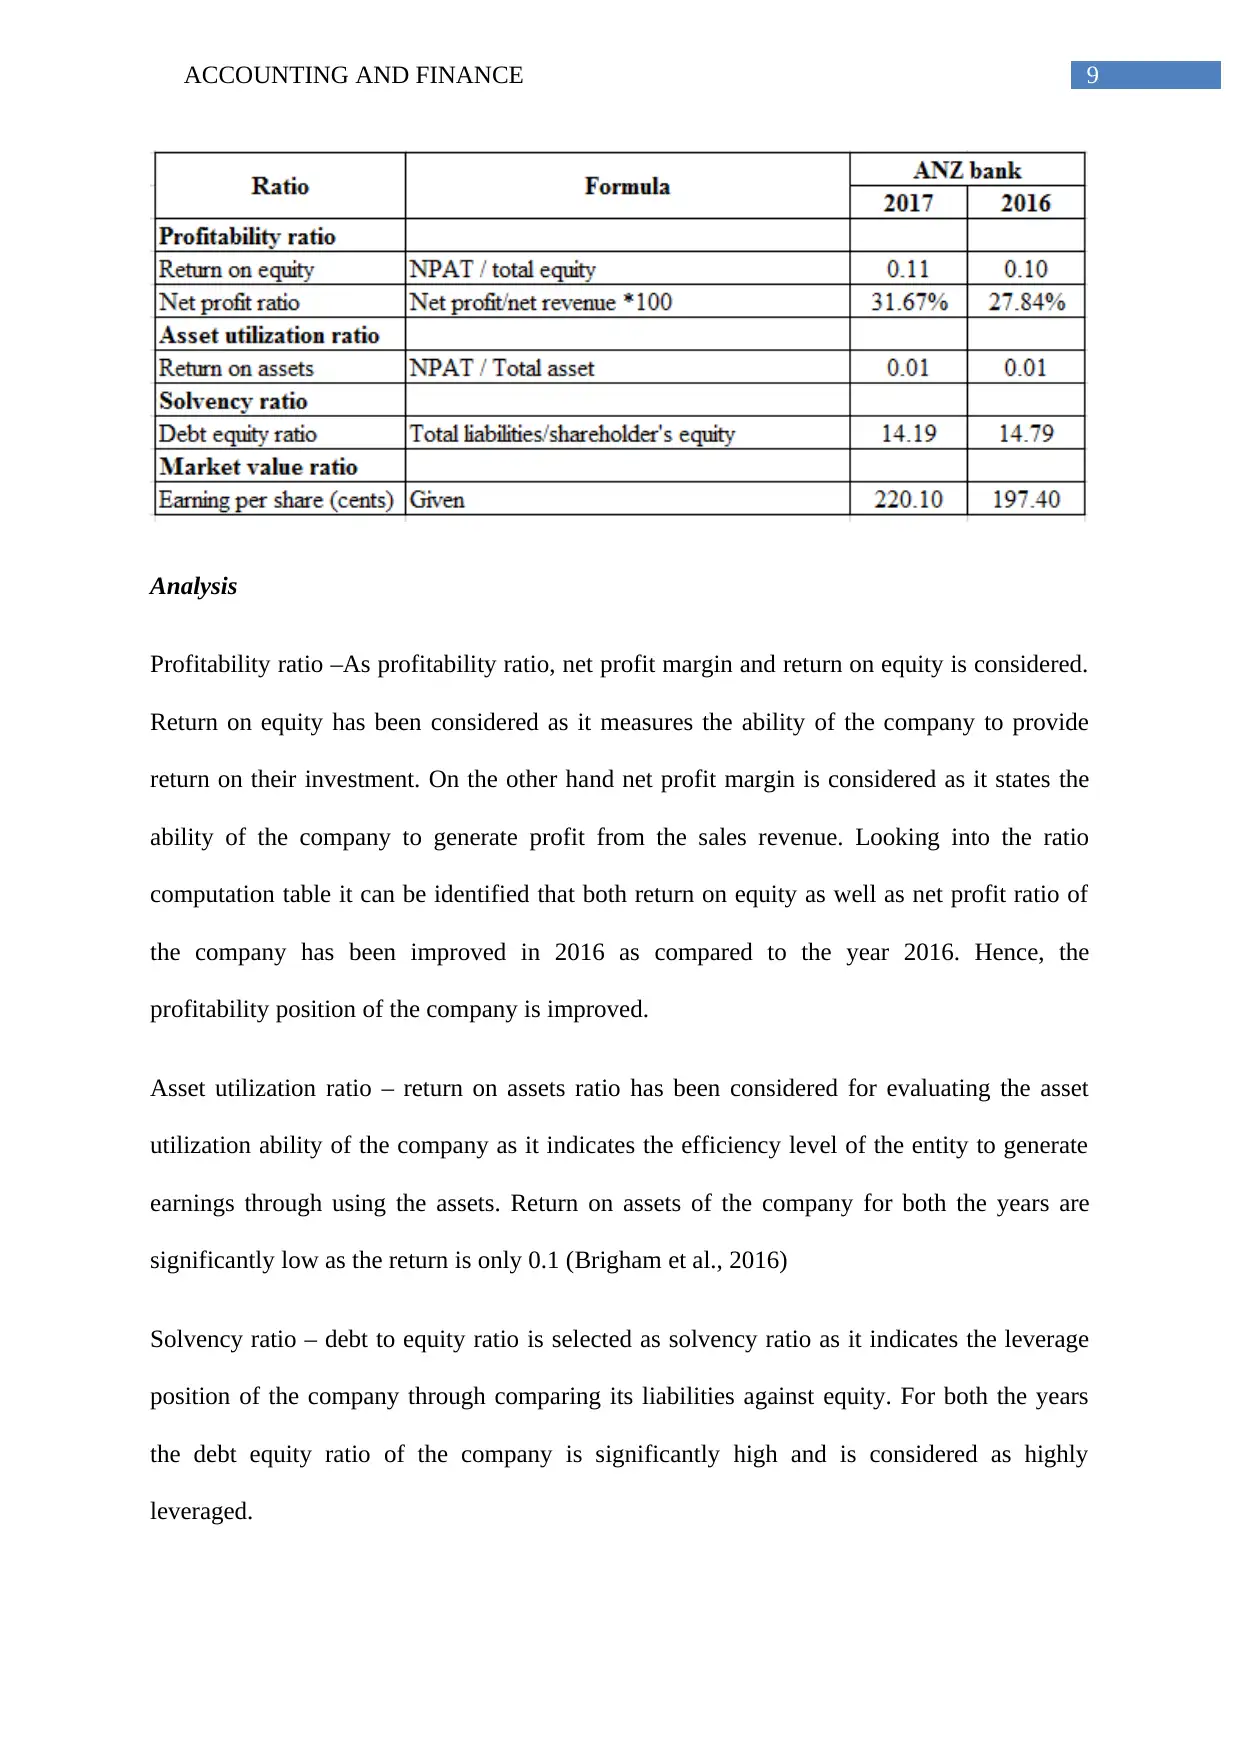
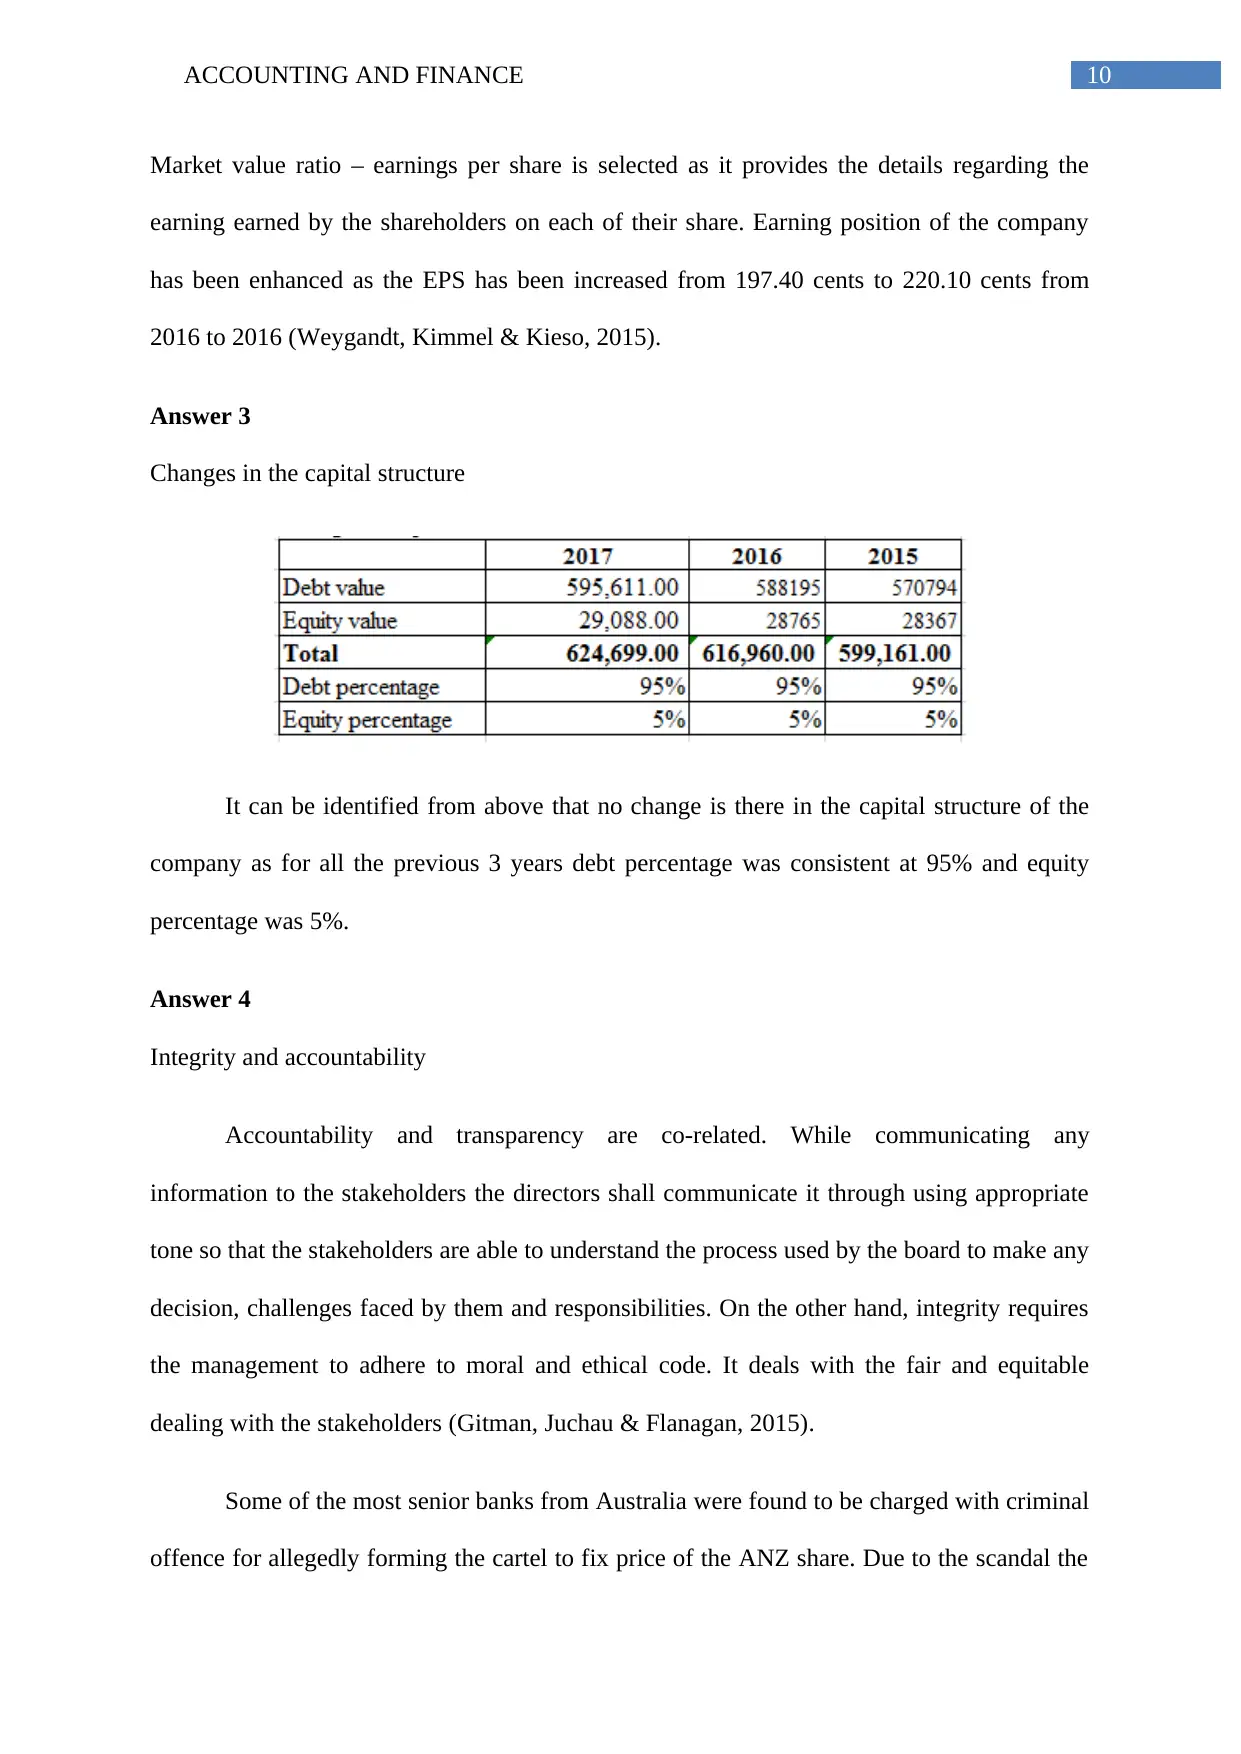
This report provides a comprehensive financial analysis of ANZ Bank, focusing on its capital structure and ability to maximize shareholder wealth. It computes the weighted average cost of capital (WACC) and uses the CAPM to assess whether the firm provides appropriate returns relative to its risk. The report analyzes the bank's financial performance through various ratios, including profitability, asset utilization, solvency, and market value ratios, comparing them across different years and against a competitor. The report also examines the bank's adherence to integrity and accountability standards, referencing instances where the bank faced charges and scandals, impacting its share price and raising concerns about its operational risk management. The analysis concludes that while the bank showed improvements in profitability, its solvency and efficiency positions remained unchanged, and its share performance underperformed, highlighting the need for better management and adherence to ethical standards. Desklib offers more solved assignments and resources for students.
Document Page
Running head: ACCOUNTING AND FINANCE
Accounting and finance
Name of the student
Name of the university
Student ID
Author note
tabler-icon-diamond-filled.svg

Secure Best Marks with AI Grader

Need help grading? Try our AI Grader for instant feedback on your assignments.
Document Page
1ACCOUNTING AND FINANCE
Table of Contents
Part A.........................................................................................................................................2
Requirement (a)......................................................................................................................2
Requirement (b).....................................................................................................................3
Requirement (c)......................................................................................................................5
Part B..........................................................................................................................................6
Executive summary................................................................................................................6
Introduction............................................................................................................................6
Answer 1................................................................................................................................6
Answer 2................................................................................................................................8
Answer 3..............................................................................................................................10
Answer 4..............................................................................................................................10
Conclusion............................................................................................................................11
Reference..................................................................................................................................12
Document Page
2ACCOUNTING AND FINANCE
Part A
Requirement (a)
1. After tax cash flows
From the above table it can be identified that the after tax cash flows amounted to $
34,213,332.19.
2. Net present value (NPV)
NPV is value of all the future cash flows whether negative or positive, over the entire
life of the investment that is discounted to present value. It is the form of intrinsic valuation
and is extensively used across the accounting and finance to determine the value of a project,
new venture or cost reduction programme. It is used for determining the worth of the
investment project or series of cash flows. Apart from factoring of all the costs and revenues,
NPV also takes into account timing of each cash flow that can have great impact on present
value of the investment (Boyd, Epanchin-Niell & Siikamäki, 2015). Generally, if the NPV is
positive the project is accepted and on the contrary, if the NPV is negative the project is not
Document Page
3ACCOUNTING AND FINANCE
accepted. Looking into the above table it can be recognised that NPV of the project is $
11,590,351. Therefore, the project can be accepted as the NPV is positive.
3. Payback period
Payback period determines the time taken by the project to recover the amount of
initial investment. Payback period analysis assists the company to compare the alternative
opportunities available for investment and deciding upon the project that recover the initial
investment in shorter period of time, if the entity has preference for shorter period (Chandra,
2017). From the given scenario the calculated payback period is 0.86 years that is the initial
investment will be recovered in 0.86 years.
4. Profitability index
It is the index that attempts for identifying relationship among costs and benefits of
the proposed project. This tool is useful for ranking the projects as it allows quantifying the
value generated for per unit of the investment. Profitability index for the above project is
2.40. As the PI is more than 1, it shall be accepted (DeFusco et al., 2015).
5. Viability of the project
Taking into consideration all the above mentioned measures it can be recognised that
after tax cash flows and NPV of the project is positive, payback period is 0.86 years and PI is
more than 1. Hence, from all the aspects it can be stated that the project is viable ( Gaudard,
2015).
Requirement (b)
(i) After tax cash flows with 10% increase in sales
tabler-icon-diamond-filled.svg

Secure Best Marks with AI Grader

Need help grading? Try our AI Grader for instant feedback on your assignments.
Document Page
4ACCOUNTING AND FINANCE
(ii) After tax cash flows with 10% decrease in sales
(iii) Comment on findings
From the above it can be recognised that the after tax cash flow is $ 37,522,165.41
when the sales level is 10% more than the estimation. On the other hand, after tax cash flow
Document Page
5ACCOUNTING AND FINANCE
is $ 30,904,498.97 when the sales level is 10% less than the estimation. Hence, the cash flow
is highest when sales level is 10% more than the estimation.
(iv) Importance of after tax cash flows
After tax cash flow is considered as an important measure as it considers the tax
impact on the profits. It is used for determining cash flow of investment undertaken by the
company. Hence, it can be used to measure the cash flows that will be available from the
project after payment of tax.
Requirement (c)
If full payment is made at the time of purchase the payment will be $ 71,25,000 after
discount of 5%. If payment is made on monthly basis the payment requirement is $
71,06,724. If the payment is made on quarterly basis the payment requirement is $ 69,06,360.
Hence, the entity shall choose quarterly payment option as the payment requirement under
this method is lowest.
Document Page
6ACCOUNTING AND FINANCE
Part B
Executive summary
Aim of the report is to focus on the capital structure of ANZ bank and analysing
whether the firm is able to maximise the generation of wealth for the shareholders. The report
will compute the weighted average cost of capital and using the CAPM it will analyse
whether the firm is providing appropriate return as compared to risk. The report will further
analyse the financial performance of the firm through financial ratios. Further, it will consider
whether the firm is complying with the requirement of integrity and accountability.
Introduction
ANZ is the publicly listed entity that was incorporated in Australia on 14th July 1977.
Various segments of the bank includes wealth Australia, institutional, Australia, New
Zealand, technology, operations, service, Asia Retail & Pacific and group centre. It offers
numerous banking as well as financial products and services. Apart from that it offers
mortgages, flexible facilities, personal loans, home loans, commercial and business loans,
investment services, overdrafts, rural finances, house, boats, contents, car, firm and
equipment, credit card payment and business (Anz.com, 2019).
Answer 1
(a) Capital structure
Capital structure of the company inclusive of debt and equity is as follows –
tabler-icon-diamond-filled.svg

Paraphrase This Document

Need a fresh take? Get an instant paraphrase of this document with our AI Paraphraser
Document Page
7ACCOUNTING AND FINANCE
(b) WACC
As per the given information,
Beta = 1.37
Risk free rate = Rf = 2.3%,
Market risk premium = Rm = 8.2%
Hence, required rate of return =
R = Rf + β ( Rm – Rf )
R = 2.3% + 1.37 * (8.2% - 2.3%) = 10.38%
WACC = E/V * Re +D/V * Rd * (1-Tc)
Where,
E/V = Equity percentage in capital structure = 5%
D/V = Debt percentage in capital structure = 95%
Re = Cost of the equity = 10.38%
Rd = Rate of debt = 7.9%
Tc = corporate tax rate = 33.3% (Barberis et al., 2015).
With the above information WACC of the firm will be as follows –
WACC = 5*10.38% + 95*7.9% (1- 0.333) = 5.52%
(c) Return compared to risk
Document Page
8ACCOUNTING AND FINANCE
In accordance with the CAPM the expected return is 10.38% whereas the actual return
computed from the stock is 1.50%. Therefore, it is recognised that the stock of the company
is underperforming and not generating appropriate return as compared to the given risk
(In.finance.yahoo.com, 2019).
(d) Comparison of capital structure with competitor
One of the main competitors of ANZ bank is the Westpac Bank that is one of the
major banks in Australia.
Westpac Bank’s capital structure –
If the capital structure of ANZ bank is compared with the capital structure of Westpac
bank it can be identified that both the firms are highly dependent on debt financing as
compared to equity. However, ANZ bank is slightly more dependent on debt as compared to
Westpac Bank as its debt percentage of ANZ bank is 95% and for Westpac bank it is 94%
(Westpac.com.au, 2019).
Answer 2
Ratio analysis
Document Page
9ACCOUNTING AND FINANCE
Analysis
Profitability ratio –As profitability ratio, net profit margin and return on equity is considered.
Return on equity has been considered as it measures the ability of the company to provide
return on their investment. On the other hand net profit margin is considered as it states the
ability of the company to generate profit from the sales revenue. Looking into the ratio
computation table it can be identified that both return on equity as well as net profit ratio of
the company has been improved in 2016 as compared to the year 2016. Hence, the
profitability position of the company is improved.
Asset utilization ratio – return on assets ratio has been considered for evaluating the asset
utilization ability of the company as it indicates the efficiency level of the entity to generate
earnings through using the assets. Return on assets of the company for both the years are
significantly low as the return is only 0.1 (Brigham et al., 2016)
Solvency ratio – debt to equity ratio is selected as solvency ratio as it indicates the leverage
position of the company through comparing its liabilities against equity. For both the years
the debt equity ratio of the company is significantly high and is considered as highly
leveraged.
tabler-icon-diamond-filled.svg

Secure Best Marks with AI Grader

Need help grading? Try our AI Grader for instant feedback on your assignments.
Document Page
10ACCOUNTING AND FINANCE
Market value ratio – earnings per share is selected as it provides the details regarding the
earning earned by the shareholders on each of their share. Earning position of the company
has been enhanced as the EPS has been increased from 197.40 cents to 220.10 cents from
2016 to 2016 (Weygandt, Kimmel & Kieso, 2015).
Answer 3
Changes in the capital structure
It can be identified from above that no change is there in the capital structure of the
company as for all the previous 3 years debt percentage was consistent at 95% and equity
percentage was 5%.
Answer 4
Integrity and accountability
Accountability and transparency are co-related. While communicating any
information to the stakeholders the directors shall communicate it through using appropriate
tone so that the stakeholders are able to understand the process used by the board to make any
decision, challenges faced by them and responsibilities. On the other hand, integrity requires
the management to adhere to moral and ethical code. It deals with the fair and equitable
dealing with the stakeholders (Gitman, Juchau & Flanagan, 2015).
Some of the most senior banks from Australia were found to be charged with criminal
offence for allegedly forming the cartel to fix price of the ANZ share. Due to the scandal the
Document Page
11ACCOUNTING AND FINANCE
share price of ANZ bank were dropped by 1.70% and were trading at $ 29.64 in the market. It
took the bank one year time to regain its share value at A$ 32.58 (Minnis & Sutherland,
2017). Further, the bank was concerned that they may lose the financial license owing to the
fact that the bank staffs were providing personal financial service illegally and were selling
superannuation product ‘Smart Choice and Pension by ANZ’ key finding of the Royal
Commission regarding the scandal were – (i) while providing the financial services bank
staffs ignored basic standards for complying with honesty (ii) lenders wanted to earn profit
over all other facts (iii) transaction basis were formed to mainly confuse indigenous
customers and (iv) were disinclined towards to basic changes applicable for small business
laws with regard to lending (ABC News, 2018). Hence, considering the above facts it can be
stated that the firm was not successful in managing operational risk as it violated the integrity
and accountability concept.
Conclusion
From the above discussion it can be concluded that the except the profitability aspect
the company did not make any improvement regarding its solvency position and efficiency
position. Further, the share of the company was underperforming in the market. More over
the management of the company was unable to maintain integrity and accountability concept
while running the business.
Document Page
12ACCOUNTING AND FINANCE
Reference
ABC News. (2018). Greed and dishonesty in the pursuit of profit: The banks according to
Hayne. Retrieved 17 January 2019, from
https://www.abc.net.au/news/2018-09-28/bank-royal-commission-kenneth-hayne-
key-findings/10317752
Anz.com. (2019). ANZ - About ANZ - ANZ Corporate Information - Company Profile.
Retrieved 17 January 2019, from
http://www.anz.com/australia/aboutanz/corporateinformation/company.asp
Barberis, N., Greenwood, R., Jin, L., & Shleifer, A. (2015). X-CAPM: An extrapolative
capital asset pricing model. Journal of financial economics, 115(1), 1-24.
Boyd, J., Epanchin-Niell, R., & Siikamäki, J. (2015). Conservation planning: a review of
return on investment analysis. Review of Environmental Economics and Policy, 9(1),
23-42.
Brigham, E. F., Ehrhardt, M. C., Nason, R. R., & Gessaroli, J. (2016). Financial Managment:
Theory And Practice, Canadian Edition. Nelson Education.
Chandra, P. (2017). Investment analysis and portfolio management. McGraw-Hill Education.
DeFusco, R. A., McLeavey, D. W., Pinto, J. E., Anson, M. J., & Runkle, D. E.
(2015). Quantitative investment analysis. John Wiley & Sons.
Gaudard, L. (2015). Pumped-storage project: A short to long term investment analysis
including climate change. Renewable and Sustainable Energy Reviews, 49, 91-99.
Gitman, L. J., Juchau, R., & Flanagan, J. (2015). Principles of managerial finance. Pearson
Higher Education AU.
tabler-icon-diamond-filled.svg

Paraphrase This Document

Need a fresh take? Get an instant paraphrase of this document with our AI Paraphraser
Document Page
13ACCOUNTING AND FINANCE
In.finance.yahoo.com. (2019). Yahoo is now a part of Oath. Retrieved 14 January 2019, from
https://in.finance.yahoo.com/
Minnis, M., & Sutherland, A. (2017). Financial statements as monitoring mechanisms:
Evidence from small commercial loans. Journal of Accounting Research, 55(1), 197-
233.
Westpac.com.au. (2019). Westpac - Personal, Business and Corporate Banking. Retrieved 17
January 2019, from https://www.westpac.com.au/
Weygandt, J. J., Kimmel, P. D., & Kieso, D. E. (2015). Financial & managerial accounting.
John Wiley & Sons.
chevron_up_icon
1 out of 14
circle_padding
hide_on_mobile
zoom_out_icon
logo.png

Your All-in-One AI-Powered Toolkit for Academic Success.

Available 24*7 on WhatsApp / Email

[object Object]