Accounting & Finance Assignment Solution - University Name, Semester 1
VerifiedAdded on  2020/03/02
|9
|1563
|93
Homework Assignment
AI Summary
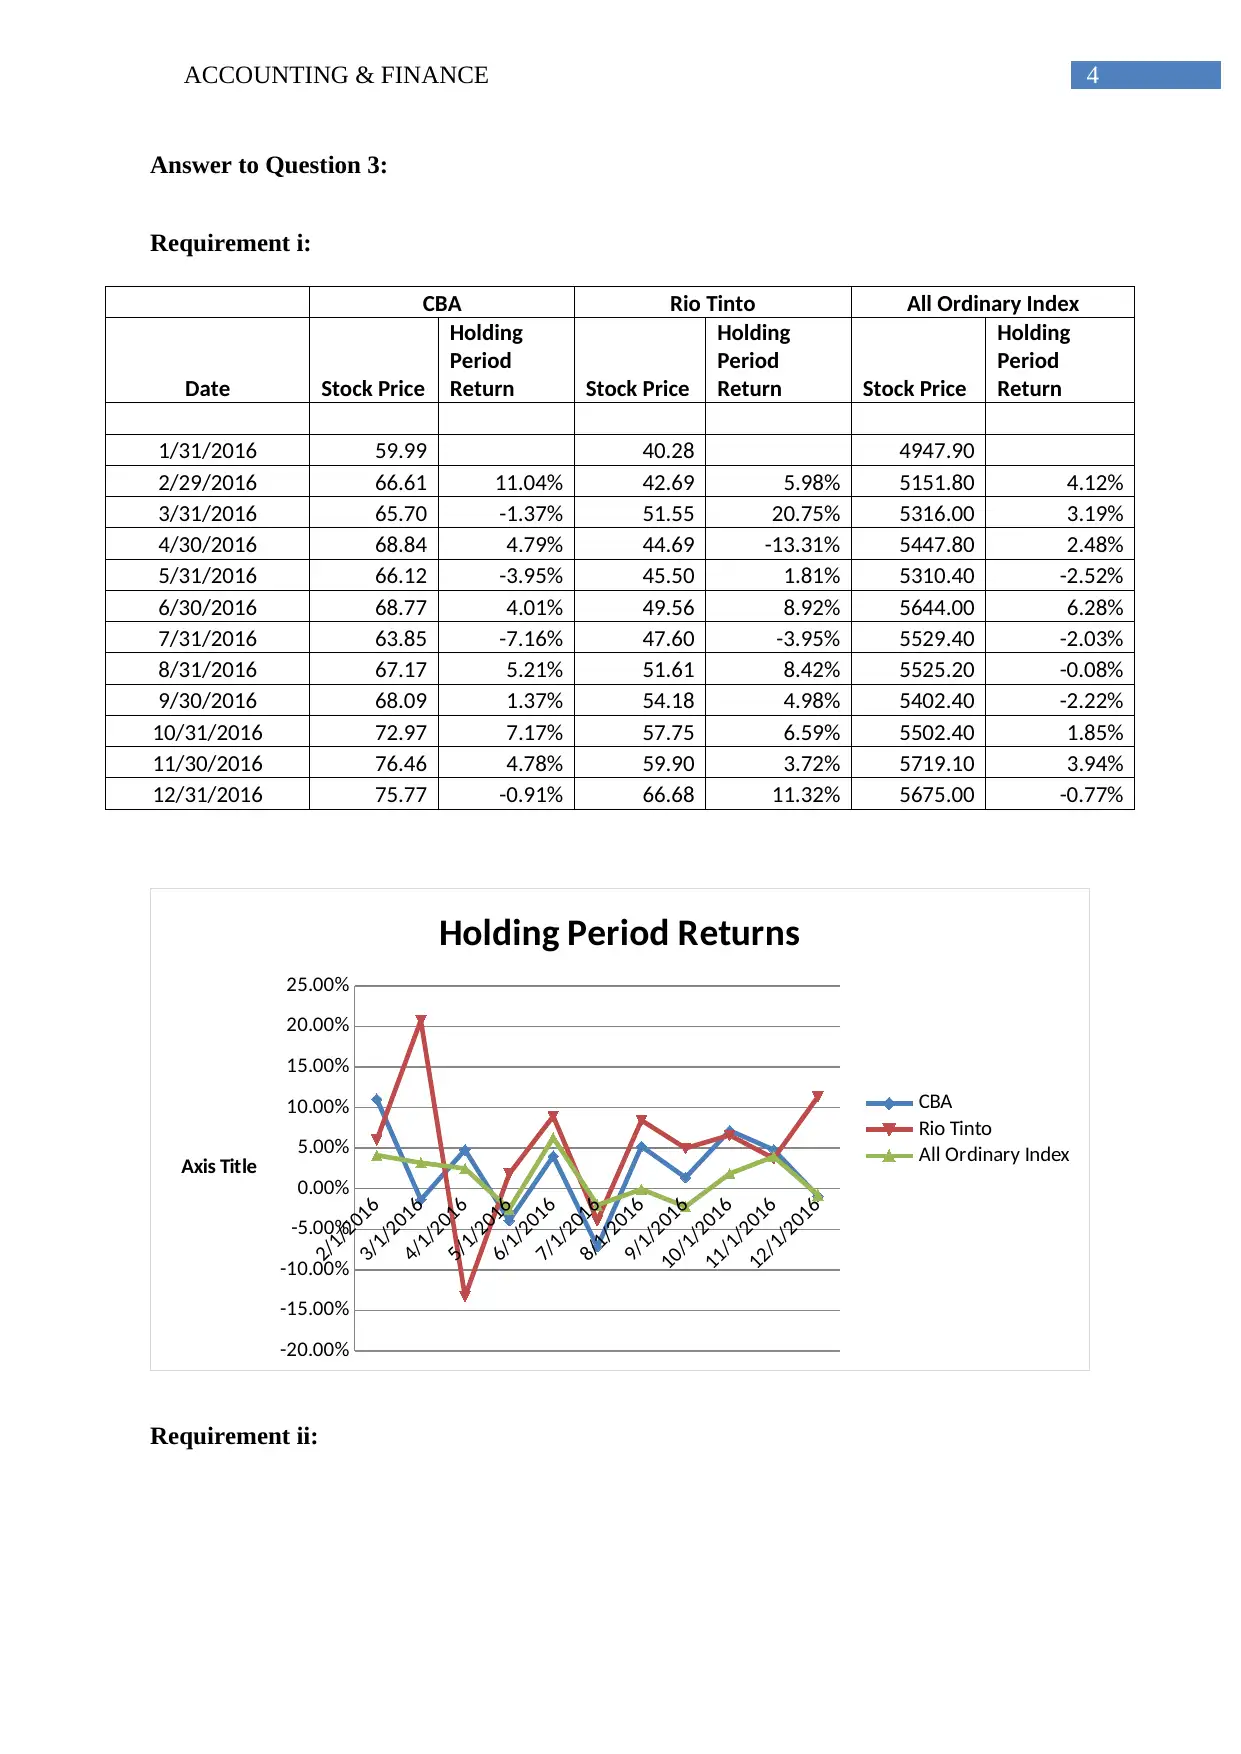
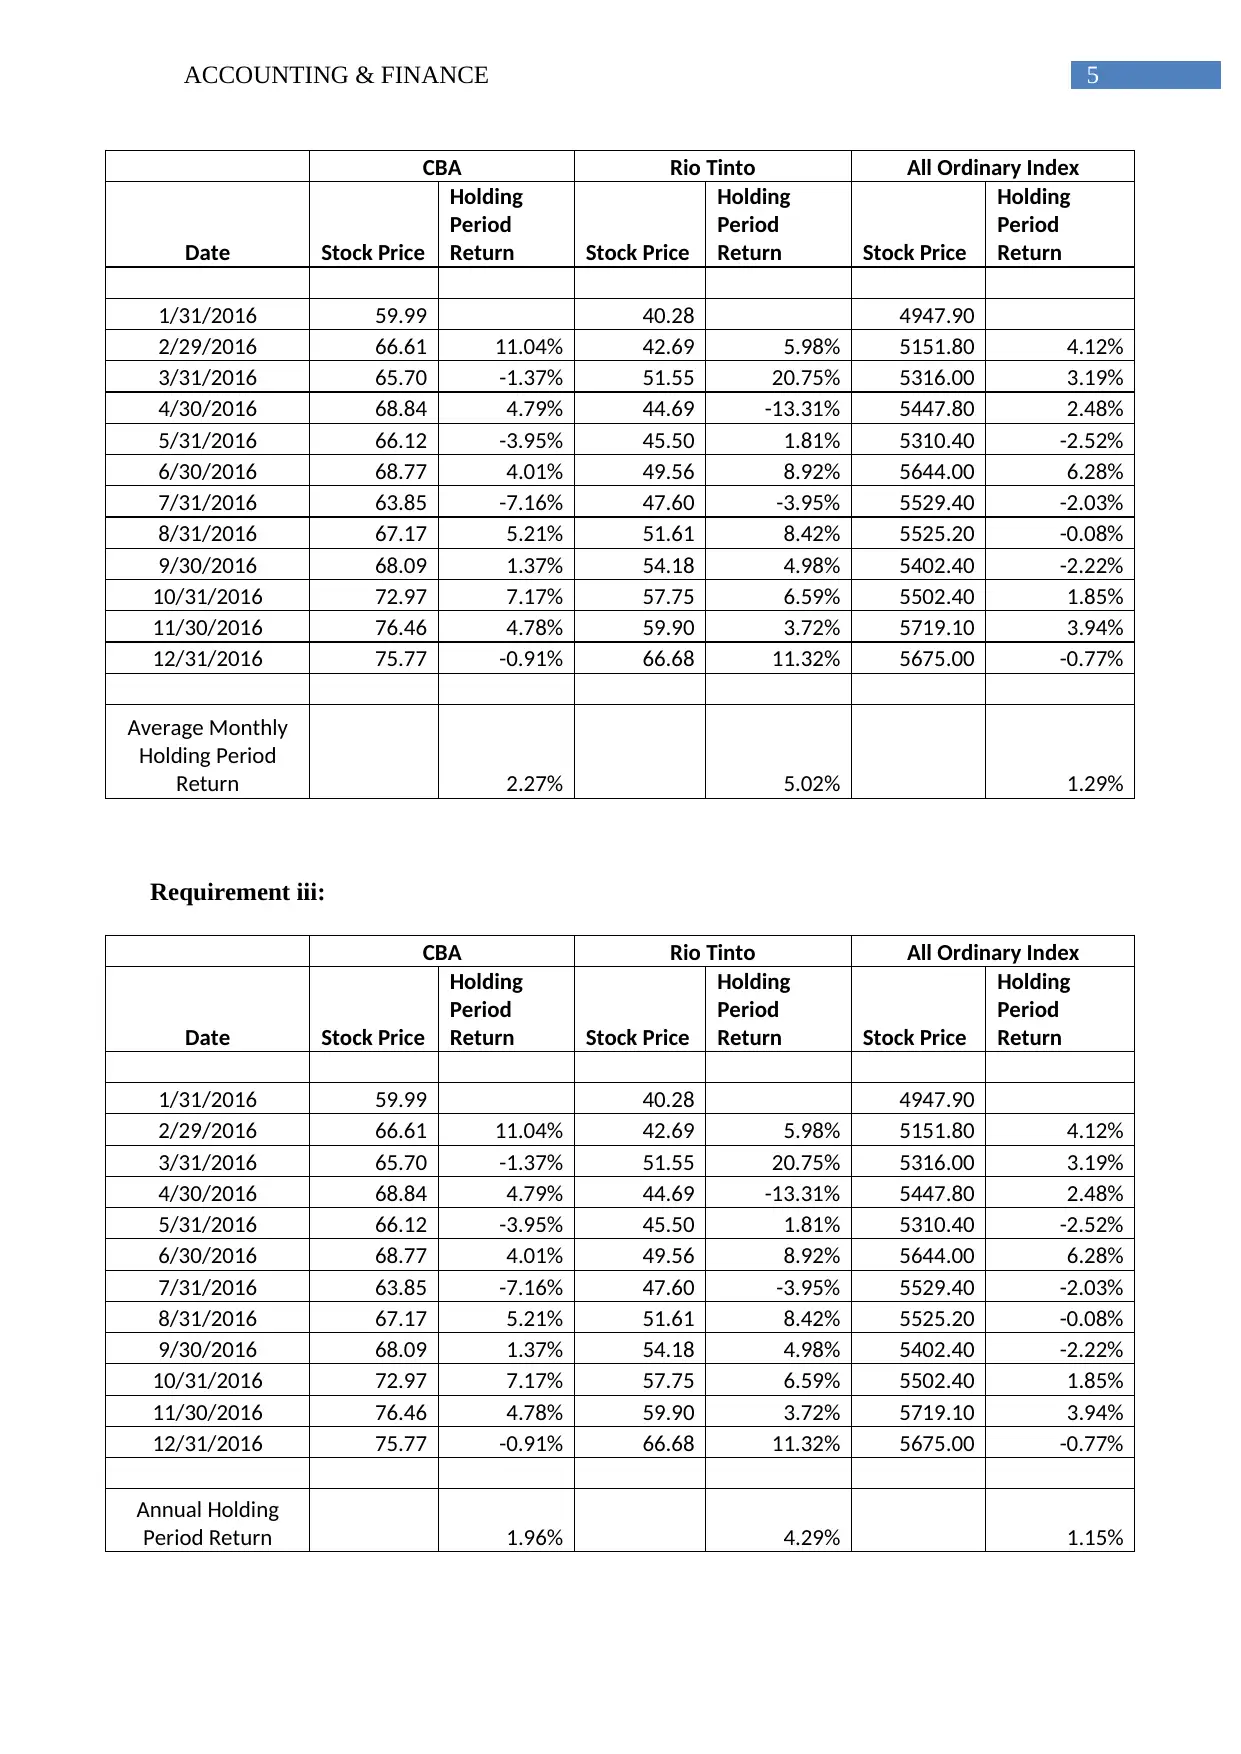
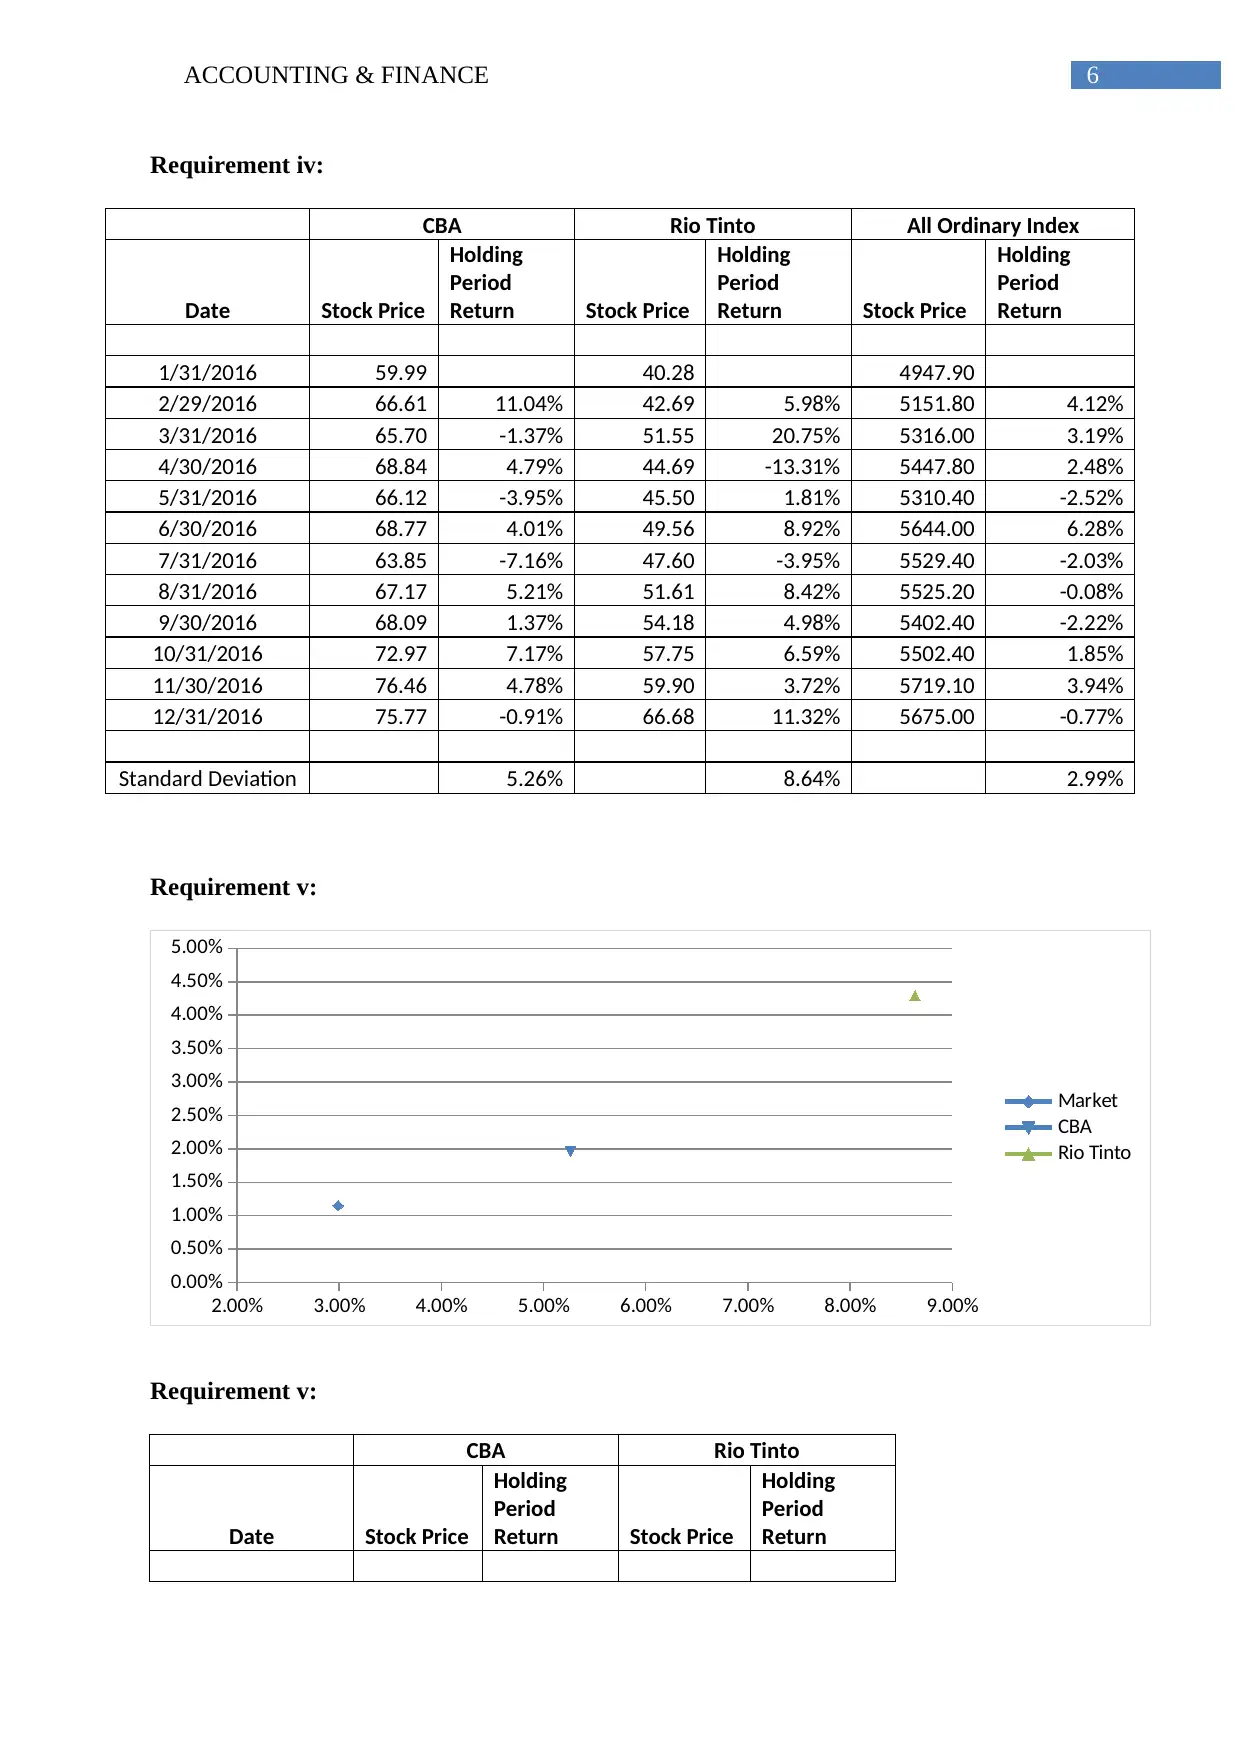
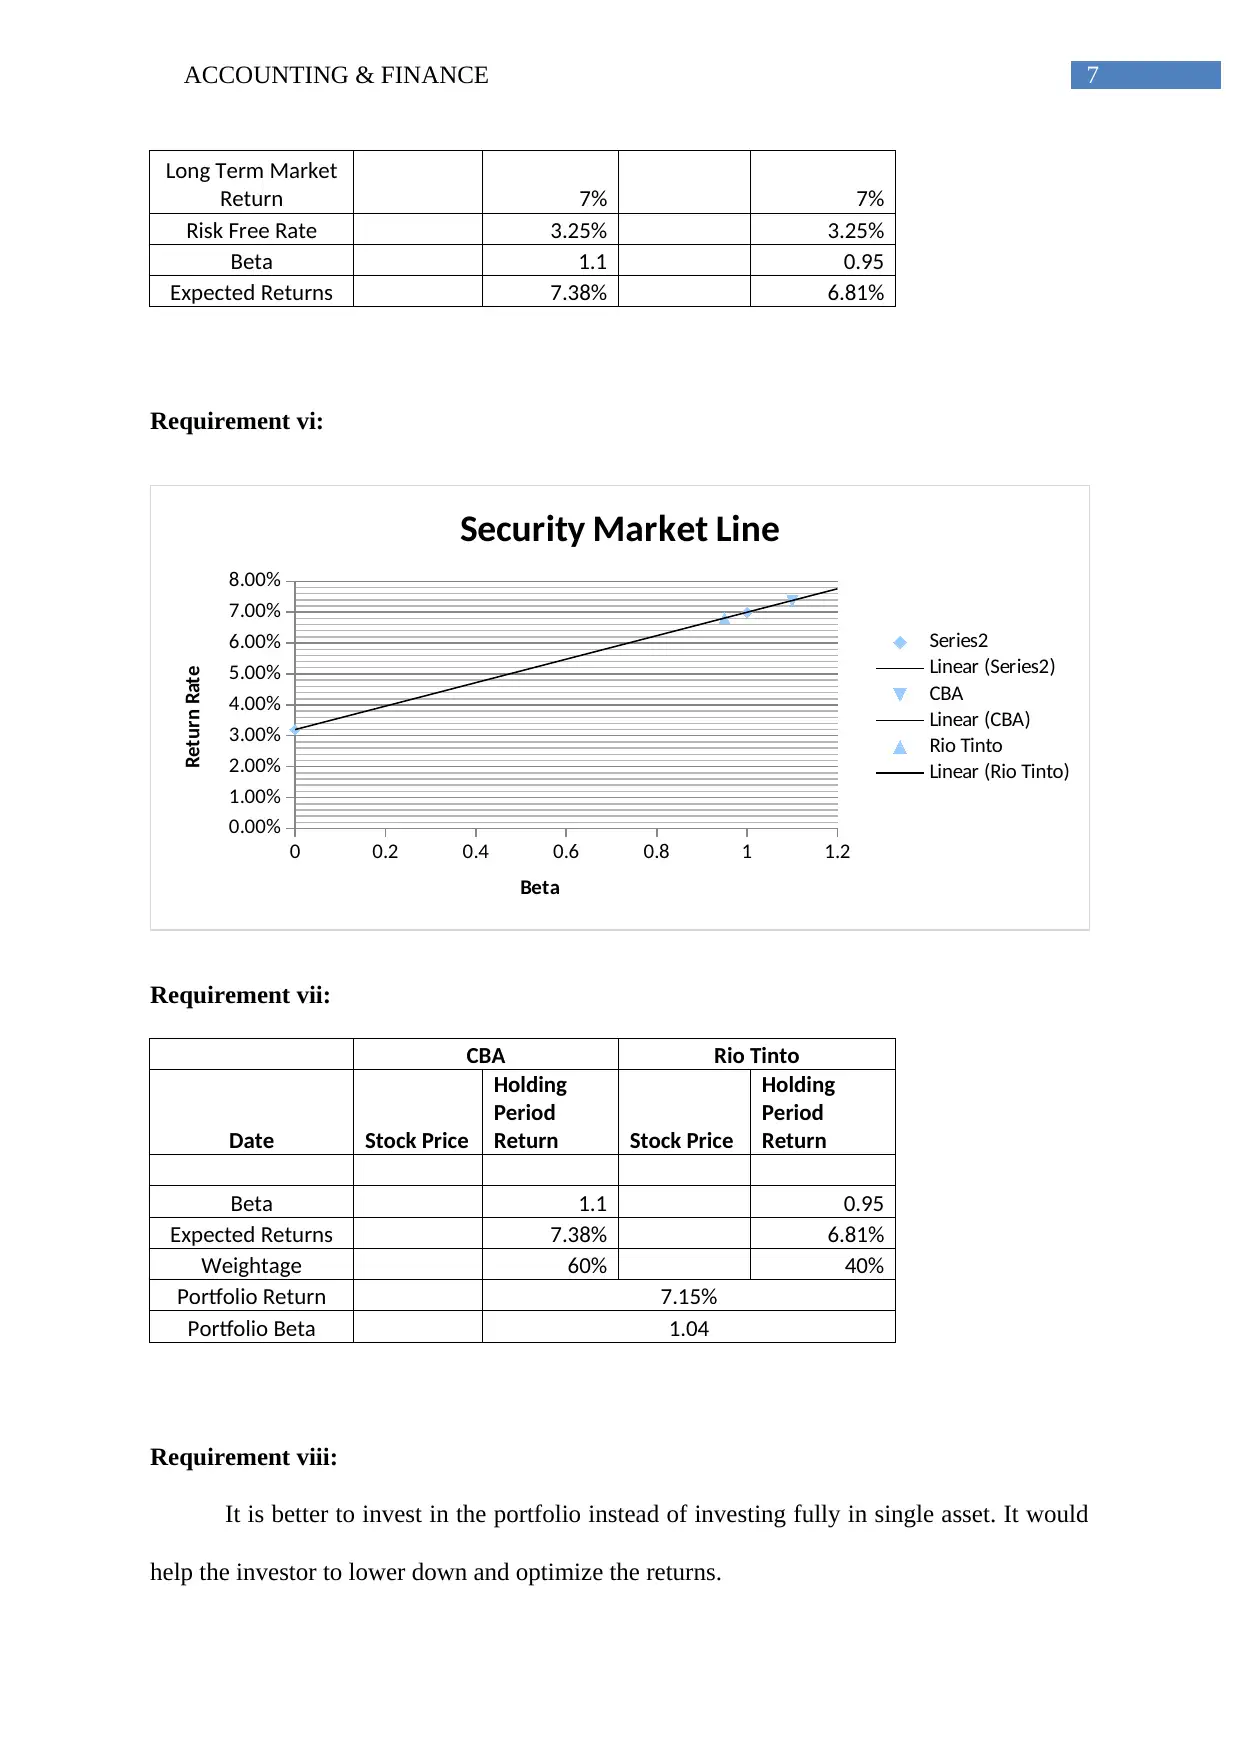
This assignment solution for an Accounting & Finance course delves into key financial concepts. It begins by contrasting the objectives of profit maximization and shareholder wealth maximization, emphasizing the long-term value creation inherent in the latter. The solution then explores the behavior of risk-averse investors and their investment choices, highlighting the trade-offs between risk and return. The core of the assignment involves a detailed analysis of stock performance data for CBA, Rio Tinto, and an All Ordinary Index. The solution includes calculations of holding period returns, average monthly and annual returns, and standard deviations. Furthermore, it applies the Capital Asset Pricing Model (CAPM) to estimate expected returns, and culminates in a portfolio analysis, determining portfolio returns and beta. The assignment concludes with a recommendation to diversify investments through a portfolio approach.

Running head: ACCOUNTING & FINANCE
Accounting & Finance
Name of the University
Name of the student
Authors note
Accounting & Finance
Name of the University
Name of the student
Authors note
Paraphrase This Document
Need a fresh take? Get an instant paraphrase of this document with our AI Paraphraser

1ACCOUNTING & FINANCE
Table of Contents
Answer to Question 2:................................................................................................................2
Requirement 1:.......................................................................................................................2
Requirement 2:.......................................................................................................................3
Answer to Question 3:................................................................................................................4
Requirement i:........................................................................................................................4
Requirement ii:.......................................................................................................................4
Requirement iii:......................................................................................................................5
Requirement iv:......................................................................................................................6
Requirement v:.......................................................................................................................6
Requirement vi:......................................................................................................................7
Requirement vii:.....................................................................................................................7
Requirement viii:....................................................................................................................7
Reference:..................................................................................................................................8

2ACCOUNTING & FINANCE
Answer to Question 2:
Requirement 1:
The concept of maximization of shareholders wealth is that it focuses on enhancing
the overall value of business instead of focusing on short-terms benefits or returns. On other
hand, concept of maximization of profit is essentially a short-term approach that does not
lead to increased value of business. The main objective of maximizing the wealth of
shareholders is that it results in efficiently allocating capital and maximizing the return on
capital. The concept is related with increasing the shareholders wealth by increasing the
business value (Bae et al., 2014).
Maximizing the wealth of shareholders is one of the universally accepted objectives
of any organization. The concept of maximizing the wealth of shareholders came into being
after the concept of profit maximization. Value of shareholders would improve with the
increase in price of shares that is regarded as the net worth business function. The drawbacks
of maximization of profit model are obviated by the employment of model of wealth
maximization. Capital investments made by organization should be able to generate return
that is more than the required rates of return such investments made such that this would lead
to maximizing the wealth of shareholders. However, an increase in profit of organization
indirectly increases the wealth of shareholders. This is so because this would generate higher
dividend payment to shareholders that would involve long-term pay offs to customers.
Maximization of wealth of shareholders is the responsibility of management by
allocating resources in way that would help in generating highest returns and at the same time
mitigating the risks. A detailed and in depth analysis if cash flow associated with investments
is required to be conducted by management.
⊘ This is a preview!⊘
Do you want full access?
Subscribe today to unlock all pages.

Trusted by 1+ million students worldwide

3ACCOUNTING & FINANCE
Requirement 2:
Risk aversing investors are one when they are face with two investment decisions,
they would prefer the investments with lower risks. Their portfolio comprise of assets that
does not carry any risks and generates a fixed income. Such types of investors prefer making
investments in government bonds, treasury bills, fixed deposits and certificate of deposits that
generates lower rate of return. However, they often lose out on higher return by not making
investments in capital assets that has the opportunity of providing investors with higher
return. They often lag behind investing in right investment vehicle and are not able to
participate in the market (Deguest et al., 2013).
Making an investment in lower return and risk free assets deprive them of advantage
that is generated from growth of market and higher level of profits. The establishment of
relationship volatility and high level of profits is difficult for such investors. Making
investments in risky assets would provide long-term benefits to investor seeking investment
in such assets. Expected returns for investors are lower for investors who are willing to take
additional risks on their investments. There always exists trade off between risk and returns
generated by investments. Investment with lower risk generates lower return and investments
with higher risks generate higher returns. Apprehension of investors investing in risky assets
is mainly because of the fall in stock value in market. Tax advantage is the main benefits of
making investment in capital market assets (Harlow & Brown, 2016).
It is essential for corporate managers to make optimum allocation between risky
assets and risk free assets. Some additional costs are involved in making investments in long-
term assets and strategies that should be adopted by organization is incorporating the level of
tolerable risks and generates desirable level of returns. However, it can be said that
investments in risky asset leads to increased business risks and therefore, corporate managers
should not always undertake investments in risk free assets.
Paraphrase This Document
Need a fresh take? Get an instant paraphrase of this document with our AI Paraphraser

4ACCOUNTING & FINANCE
Answer to Question 3:
Requirement i:
CBA Rio Tinto All Ordinary Index
Date Stock Price
Holding
Period
Return Stock Price
Holding
Period
Return Stock Price
Holding
Period
Return
1/31/2016 59.99 40.28 4947.90
2/29/2016 66.61 11.04% 42.69 5.98% 5151.80 4.12%
3/31/2016 65.70 -1.37% 51.55 20.75% 5316.00 3.19%
4/30/2016 68.84 4.79% 44.69 -13.31% 5447.80 2.48%
5/31/2016 66.12 -3.95% 45.50 1.81% 5310.40 -2.52%
6/30/2016 68.77 4.01% 49.56 8.92% 5644.00 6.28%
7/31/2016 63.85 -7.16% 47.60 -3.95% 5529.40 -2.03%
8/31/2016 67.17 5.21% 51.61 8.42% 5525.20 -0.08%
9/30/2016 68.09 1.37% 54.18 4.98% 5402.40 -2.22%
10/31/2016 72.97 7.17% 57.75 6.59% 5502.40 1.85%
11/30/2016 76.46 4.78% 59.90 3.72% 5719.10 3.94%
12/31/2016 75.77 -0.91% 66.68 11.32% 5675.00 -0.77%
2/1/2016
3/1/2016
4/1/2016
5/1/2016
6/1/2016
7/1/2016
8/1/2016
9/1/2016
10/1/2016
11/1/2016
12/1/2016
-20.00%
-15.00%
-10.00%
-5.00%
0.00%
5.00%
10.00%
15.00%
20.00%
25.00%
Holding Period Returns
CBA
Rio Tinto
All Ordinary Index
Axis Title
Requirement ii:

5ACCOUNTING & FINANCE
CBA Rio Tinto All Ordinary Index
Date Stock Price
Holding
Period
Return Stock Price
Holding
Period
Return Stock Price
Holding
Period
Return
1/31/2016 59.99 40.28 4947.90
2/29/2016 66.61 11.04% 42.69 5.98% 5151.80 4.12%
3/31/2016 65.70 -1.37% 51.55 20.75% 5316.00 3.19%
4/30/2016 68.84 4.79% 44.69 -13.31% 5447.80 2.48%
5/31/2016 66.12 -3.95% 45.50 1.81% 5310.40 -2.52%
6/30/2016 68.77 4.01% 49.56 8.92% 5644.00 6.28%
7/31/2016 63.85 -7.16% 47.60 -3.95% 5529.40 -2.03%
8/31/2016 67.17 5.21% 51.61 8.42% 5525.20 -0.08%
9/30/2016 68.09 1.37% 54.18 4.98% 5402.40 -2.22%
10/31/2016 72.97 7.17% 57.75 6.59% 5502.40 1.85%
11/30/2016 76.46 4.78% 59.90 3.72% 5719.10 3.94%
12/31/2016 75.77 -0.91% 66.68 11.32% 5675.00 -0.77%
Average Monthly
Holding Period
Return 2.27% 5.02% 1.29%
Requirement iii:
CBA Rio Tinto All Ordinary Index
Date Stock Price
Holding
Period
Return Stock Price
Holding
Period
Return Stock Price
Holding
Period
Return
1/31/2016 59.99 40.28 4947.90
2/29/2016 66.61 11.04% 42.69 5.98% 5151.80 4.12%
3/31/2016 65.70 -1.37% 51.55 20.75% 5316.00 3.19%
4/30/2016 68.84 4.79% 44.69 -13.31% 5447.80 2.48%
5/31/2016 66.12 -3.95% 45.50 1.81% 5310.40 -2.52%
6/30/2016 68.77 4.01% 49.56 8.92% 5644.00 6.28%
7/31/2016 63.85 -7.16% 47.60 -3.95% 5529.40 -2.03%
8/31/2016 67.17 5.21% 51.61 8.42% 5525.20 -0.08%
9/30/2016 68.09 1.37% 54.18 4.98% 5402.40 -2.22%
10/31/2016 72.97 7.17% 57.75 6.59% 5502.40 1.85%
11/30/2016 76.46 4.78% 59.90 3.72% 5719.10 3.94%
12/31/2016 75.77 -0.91% 66.68 11.32% 5675.00 -0.77%
Annual Holding
Period Return 1.96% 4.29% 1.15%
CBA Rio Tinto All Ordinary Index
Date Stock Price
Holding
Period
Return Stock Price
Holding
Period
Return Stock Price
Holding
Period
Return
1/31/2016 59.99 40.28 4947.90
2/29/2016 66.61 11.04% 42.69 5.98% 5151.80 4.12%
3/31/2016 65.70 -1.37% 51.55 20.75% 5316.00 3.19%
4/30/2016 68.84 4.79% 44.69 -13.31% 5447.80 2.48%
5/31/2016 66.12 -3.95% 45.50 1.81% 5310.40 -2.52%
6/30/2016 68.77 4.01% 49.56 8.92% 5644.00 6.28%
7/31/2016 63.85 -7.16% 47.60 -3.95% 5529.40 -2.03%
8/31/2016 67.17 5.21% 51.61 8.42% 5525.20 -0.08%
9/30/2016 68.09 1.37% 54.18 4.98% 5402.40 -2.22%
10/31/2016 72.97 7.17% 57.75 6.59% 5502.40 1.85%
11/30/2016 76.46 4.78% 59.90 3.72% 5719.10 3.94%
12/31/2016 75.77 -0.91% 66.68 11.32% 5675.00 -0.77%
Average Monthly
Holding Period
Return 2.27% 5.02% 1.29%
Requirement iii:
CBA Rio Tinto All Ordinary Index
Date Stock Price
Holding
Period
Return Stock Price
Holding
Period
Return Stock Price
Holding
Period
Return
1/31/2016 59.99 40.28 4947.90
2/29/2016 66.61 11.04% 42.69 5.98% 5151.80 4.12%
3/31/2016 65.70 -1.37% 51.55 20.75% 5316.00 3.19%
4/30/2016 68.84 4.79% 44.69 -13.31% 5447.80 2.48%
5/31/2016 66.12 -3.95% 45.50 1.81% 5310.40 -2.52%
6/30/2016 68.77 4.01% 49.56 8.92% 5644.00 6.28%
7/31/2016 63.85 -7.16% 47.60 -3.95% 5529.40 -2.03%
8/31/2016 67.17 5.21% 51.61 8.42% 5525.20 -0.08%
9/30/2016 68.09 1.37% 54.18 4.98% 5402.40 -2.22%
10/31/2016 72.97 7.17% 57.75 6.59% 5502.40 1.85%
11/30/2016 76.46 4.78% 59.90 3.72% 5719.10 3.94%
12/31/2016 75.77 -0.91% 66.68 11.32% 5675.00 -0.77%
Annual Holding
Period Return 1.96% 4.29% 1.15%
⊘ This is a preview!⊘
Do you want full access?
Subscribe today to unlock all pages.

Trusted by 1+ million students worldwide

6ACCOUNTING & FINANCE
Requirement iv:
CBA Rio Tinto All Ordinary Index
Date Stock Price
Holding
Period
Return Stock Price
Holding
Period
Return Stock Price
Holding
Period
Return
1/31/2016 59.99 40.28 4947.90
2/29/2016 66.61 11.04% 42.69 5.98% 5151.80 4.12%
3/31/2016 65.70 -1.37% 51.55 20.75% 5316.00 3.19%
4/30/2016 68.84 4.79% 44.69 -13.31% 5447.80 2.48%
5/31/2016 66.12 -3.95% 45.50 1.81% 5310.40 -2.52%
6/30/2016 68.77 4.01% 49.56 8.92% 5644.00 6.28%
7/31/2016 63.85 -7.16% 47.60 -3.95% 5529.40 -2.03%
8/31/2016 67.17 5.21% 51.61 8.42% 5525.20 -0.08%
9/30/2016 68.09 1.37% 54.18 4.98% 5402.40 -2.22%
10/31/2016 72.97 7.17% 57.75 6.59% 5502.40 1.85%
11/30/2016 76.46 4.78% 59.90 3.72% 5719.10 3.94%
12/31/2016 75.77 -0.91% 66.68 11.32% 5675.00 -0.77%
Standard Deviation 5.26% 8.64% 2.99%
Requirement v:
2.00% 3.00% 4.00% 5.00% 6.00% 7.00% 8.00% 9.00%
0.00%
0.50%
1.00%
1.50%
2.00%
2.50%
3.00%
3.50%
4.00%
4.50%
5.00%
Market
CBA
Rio Tinto
Requirement v:
CBA Rio Tinto
Date Stock Price
Holding
Period
Return Stock Price
Holding
Period
Return
Paraphrase This Document
Need a fresh take? Get an instant paraphrase of this document with our AI Paraphraser

7ACCOUNTING & FINANCE
Long Term Market
Return 7% 7%
Risk Free Rate 3.25% 3.25%
Beta 1.1 0.95
Expected Returns 7.38% 6.81%
Requirement vi:
0 0.2 0.4 0.6 0.8 1 1.2
0.00%
1.00%
2.00%
3.00%
4.00%
5.00%
6.00%
7.00%
8.00%
Security Market Line
Series2
Linear (Series2)
CBA
Linear (CBA)
Rio Tinto
Linear (Rio Tinto)
Beta
Return Rate
Requirement vii:
CBA Rio Tinto
Date Stock Price
Holding
Period
Return Stock Price
Holding
Period
Return
Beta 1.1 0.95
Expected Returns 7.38% 6.81%
Weightage 60% 40%
Portfolio Return 7.15%
Portfolio Beta 1.04
Requirement viii:
It is better to invest in the portfolio instead of investing fully in single asset. It would
help the investor to lower down and optimize the returns.

8ACCOUNTING & FINANCE
Reference:
Bae, G. I., Kim, W. C., & Mulvey, J. M. (2014). Dynamic asset allocation for varied financial
markets under regime switching framework. European Journal of Operational
Research, 234(2), 450-458.
Deguest, R., Martellini, L., & Meucci, A. (2013). Risk parity and beyond-from asset
allocation to risk allocation decisions.
Harlow, W. V., & Brown, K. C. (2016). Market Risk, Mortality Risk, and Sustainable
Retirement Asset Allocation: A Downside Risk Perspective. Journal of Investment
Management, 14(2), 5-32.
⊘ This is a preview!⊘
Do you want full access?
Subscribe today to unlock all pages.

Trusted by 1+ million students worldwide
1 out of 9
Related Documents

Your All-in-One AI-Powered Toolkit for Academic Success.
 +13062052269
info@desklib.com
Available 24*7 on WhatsApp / Email
Unlock your academic potential
Copyright © 2020–2025 A2Z Services. All Rights Reserved. Developed and managed by ZUCOL.