Accounting and Finance for Executives (UUAC5300) Assignment 2 Solution
VerifiedAdded on 2021/06/18
|11
|2866
|103
Homework Assignment
AI Summary
This assignment solution for Accounting and Finance for Executives (UUAC5300) covers a range of financial analysis topics. It begins with ratio analysis, examining liquidity, quick, and asset turnover ratios, and discusses their implications for a company's financial health. The solution also includes a discussion of additional ratios such as profit margin and debt-to-equity. Furthermore, it presents a trend analysis of sales and profit after tax, evaluating the company's performance over several years. The assignment further calculates and analyzes profitability, financial stability, and asset utilization ratios for New Zealand Post Group. It also addresses the importance of cash flow from operating activities in financial decision-making. Finally, the solution provides schedules for expected cash receipts from debtors, a cash budget, and sales and purchase budgets, demonstrating practical applications of financial planning and control.

ACCOUNTING AND FINANCE
FOR EXECUTIVES –
UUAC5300
Assignment - 2
FOR EXECUTIVES –
UUAC5300
Assignment - 2
Paraphrase This Document
Need a fresh take? Get an instant paraphrase of this document with our AI Paraphraser
Contents
Solution – 1.1 (a).........................................................................................................................................2
Solution – 1.1 (b).........................................................................................................................................3
Solution – 1.1 (c)..........................................................................................................................................4
Solution – 1.2 (a).........................................................................................................................................5
Solution – 1.2 (b).........................................................................................................................................5
Solution – 1.3 (a).........................................................................................................................................6
Analysis of above ratios...........................................................................................................................6
Solution – 1.3 (b).........................................................................................................................................7
Solution – 2.1 (a).........................................................................................................................................8
Solution – 2.1 (b).........................................................................................................................................8
Solution – 2.1 (c)..........................................................................................................................................8
Solution – 2.2 (a).........................................................................................................................................9
Solution – 2.2 (b).........................................................................................................................................9
Solution – 2.2 (c)..........................................................................................................................................9
Solution – 2.2 (d).......................................................................................................................................10
References:................................................................................................................................................11
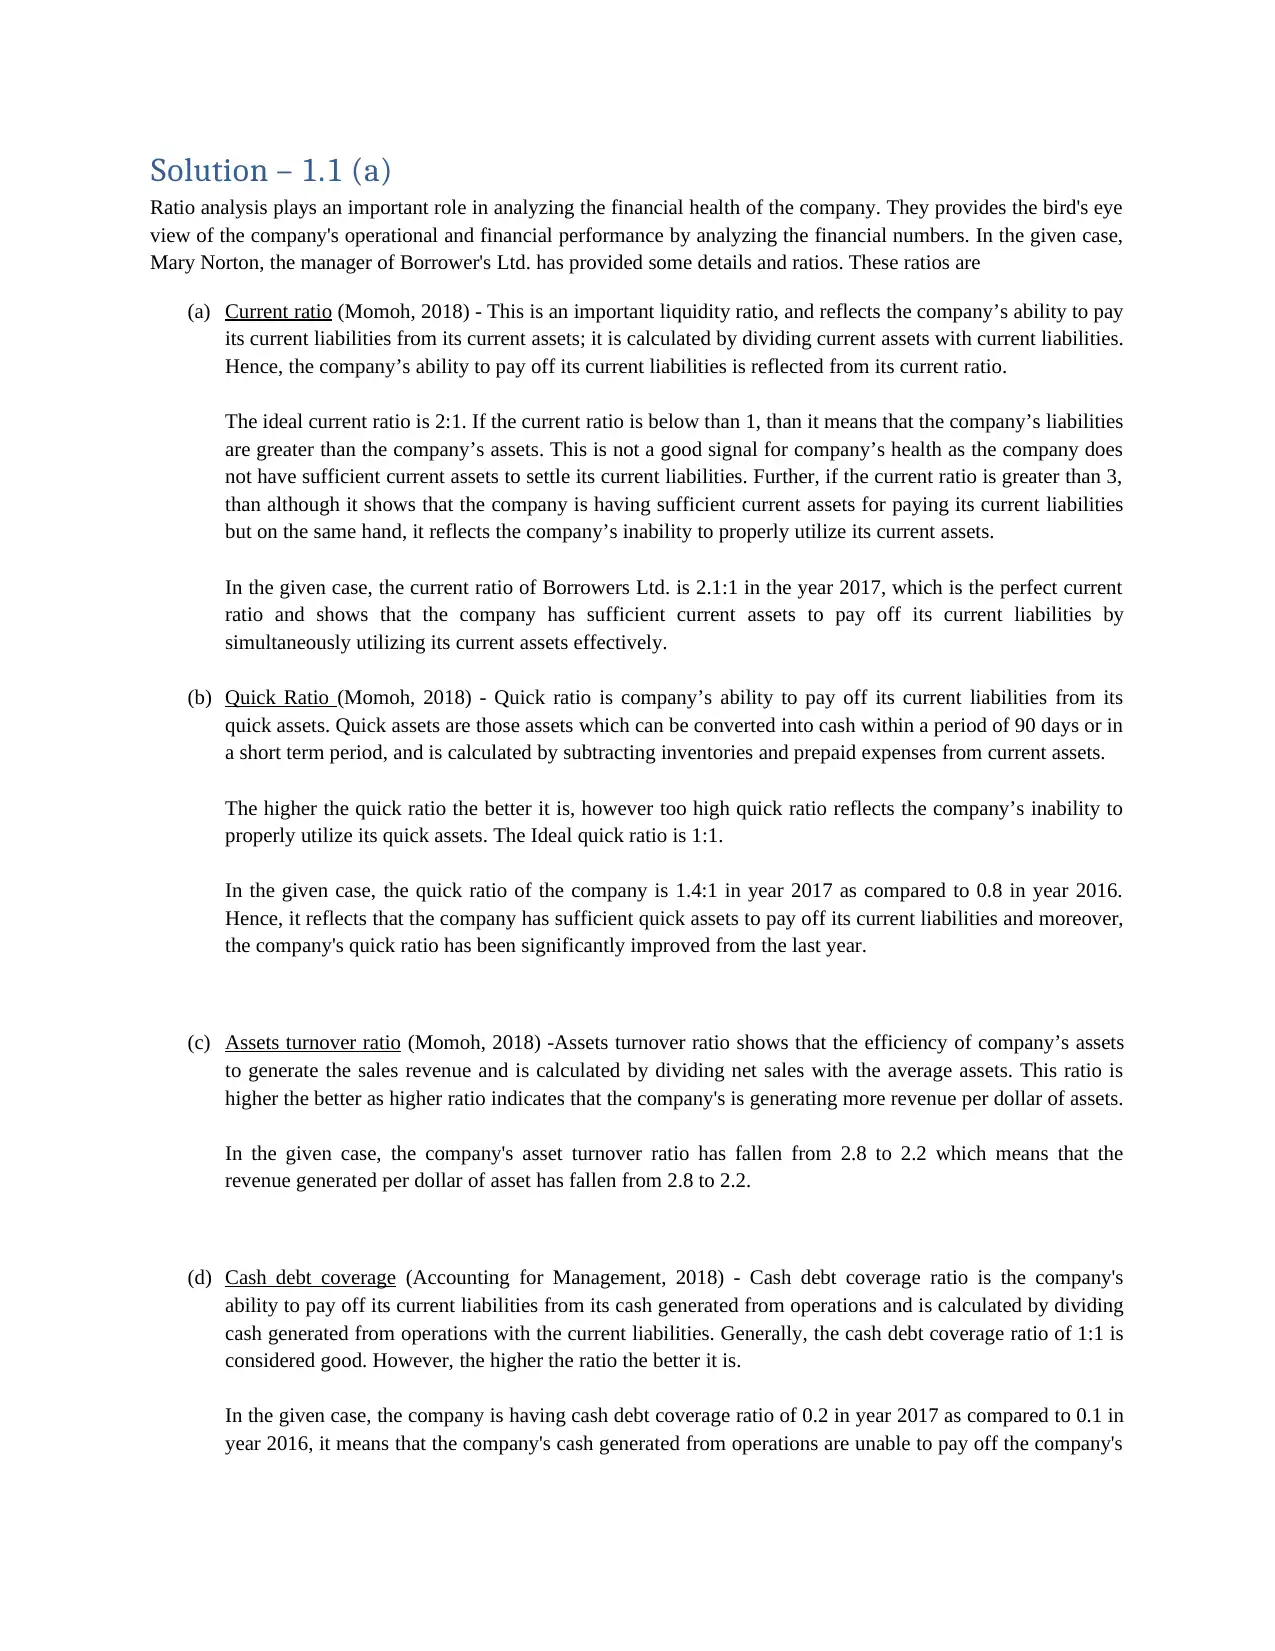
Solution – 1.1 (a)
Ratio analysis plays an important role in analyzing the financial health of the company. They provides the bird's eye
view of the company's operational and financial performance by analyzing the financial numbers. In the given case,
Mary Norton, the manager of Borrower's Ltd. has provided some details and ratios. These ratios are
(a) Current ratio (Momoh, 2018) - This is an important liquidity ratio, and reflects the company’s ability to pay
its current liabilities from its current assets; it is calculated by dividing current assets with current liabilities.
Hence, the company’s ability to pay off its current liabilities is reflected from its current ratio.
The ideal current ratio is 2:1. If the current ratio is below than 1, than it means that the company’s liabilities
are greater than the company’s assets. This is not a good signal for company’s health as the company does
not have sufficient current assets to settle its current liabilities. Further, if the current ratio is greater than 3,
than although it shows that the company is having sufficient current assets for paying its current liabilities
but on the same hand, it reflects the company’s inability to properly utilize its current assets.
In the given case, the current ratio of Borrowers Ltd. is 2.1:1 in the year 2017, which is the perfect current
ratio and shows that the company has sufficient current assets to pay off its current liabilities by
simultaneously utilizing its current assets effectively.
(b) Quick Ratio (Momoh, 2018) - Quick ratio is company’s ability to pay off its current liabilities from its
quick assets. Quick assets are those assets which can be converted into cash within a period of 90 days or in
a short term period, and is calculated by subtracting inventories and prepaid expenses from current assets.
The higher the quick ratio the better it is, however too high quick ratio reflects the company’s inability to
properly utilize its quick assets. The Ideal quick ratio is 1:1.
In the given case, the quick ratio of the company is 1.4:1 in year 2017 as compared to 0.8 in year 2016.
Hence, it reflects that the company has sufficient quick assets to pay off its current liabilities and moreover,
the company's quick ratio has been significantly improved from the last year.
(c) Assets turnover ratio (Momoh, 2018) -Assets turnover ratio shows that the efficiency of company’s assets
to generate the sales revenue and is calculated by dividing net sales with the average assets. This ratio is
higher the better as higher ratio indicates that the company's is generating more revenue per dollar of assets.
In the given case, the company's asset turnover ratio has fallen from 2.8 to 2.2 which means that the
revenue generated per dollar of asset has fallen from 2.8 to 2.2.
(d) Cash debt coverage (Accounting for Management, 2018) - Cash debt coverage ratio is the company's
ability to pay off its current liabilities from its cash generated from operations and is calculated by dividing
cash generated from operations with the current liabilities. Generally, the cash debt coverage ratio of 1:1 is
considered good. However, the higher the ratio the better it is.
In the given case, the company is having cash debt coverage ratio of 0.2 in year 2017 as compared to 0.1 in
year 2016, it means that the company's cash generated from operations are unable to pay off the company's
⊘ This is a preview!⊘
Do you want full access?
Subscribe today to unlock all pages.
Trusted by 1+ million students worldwide
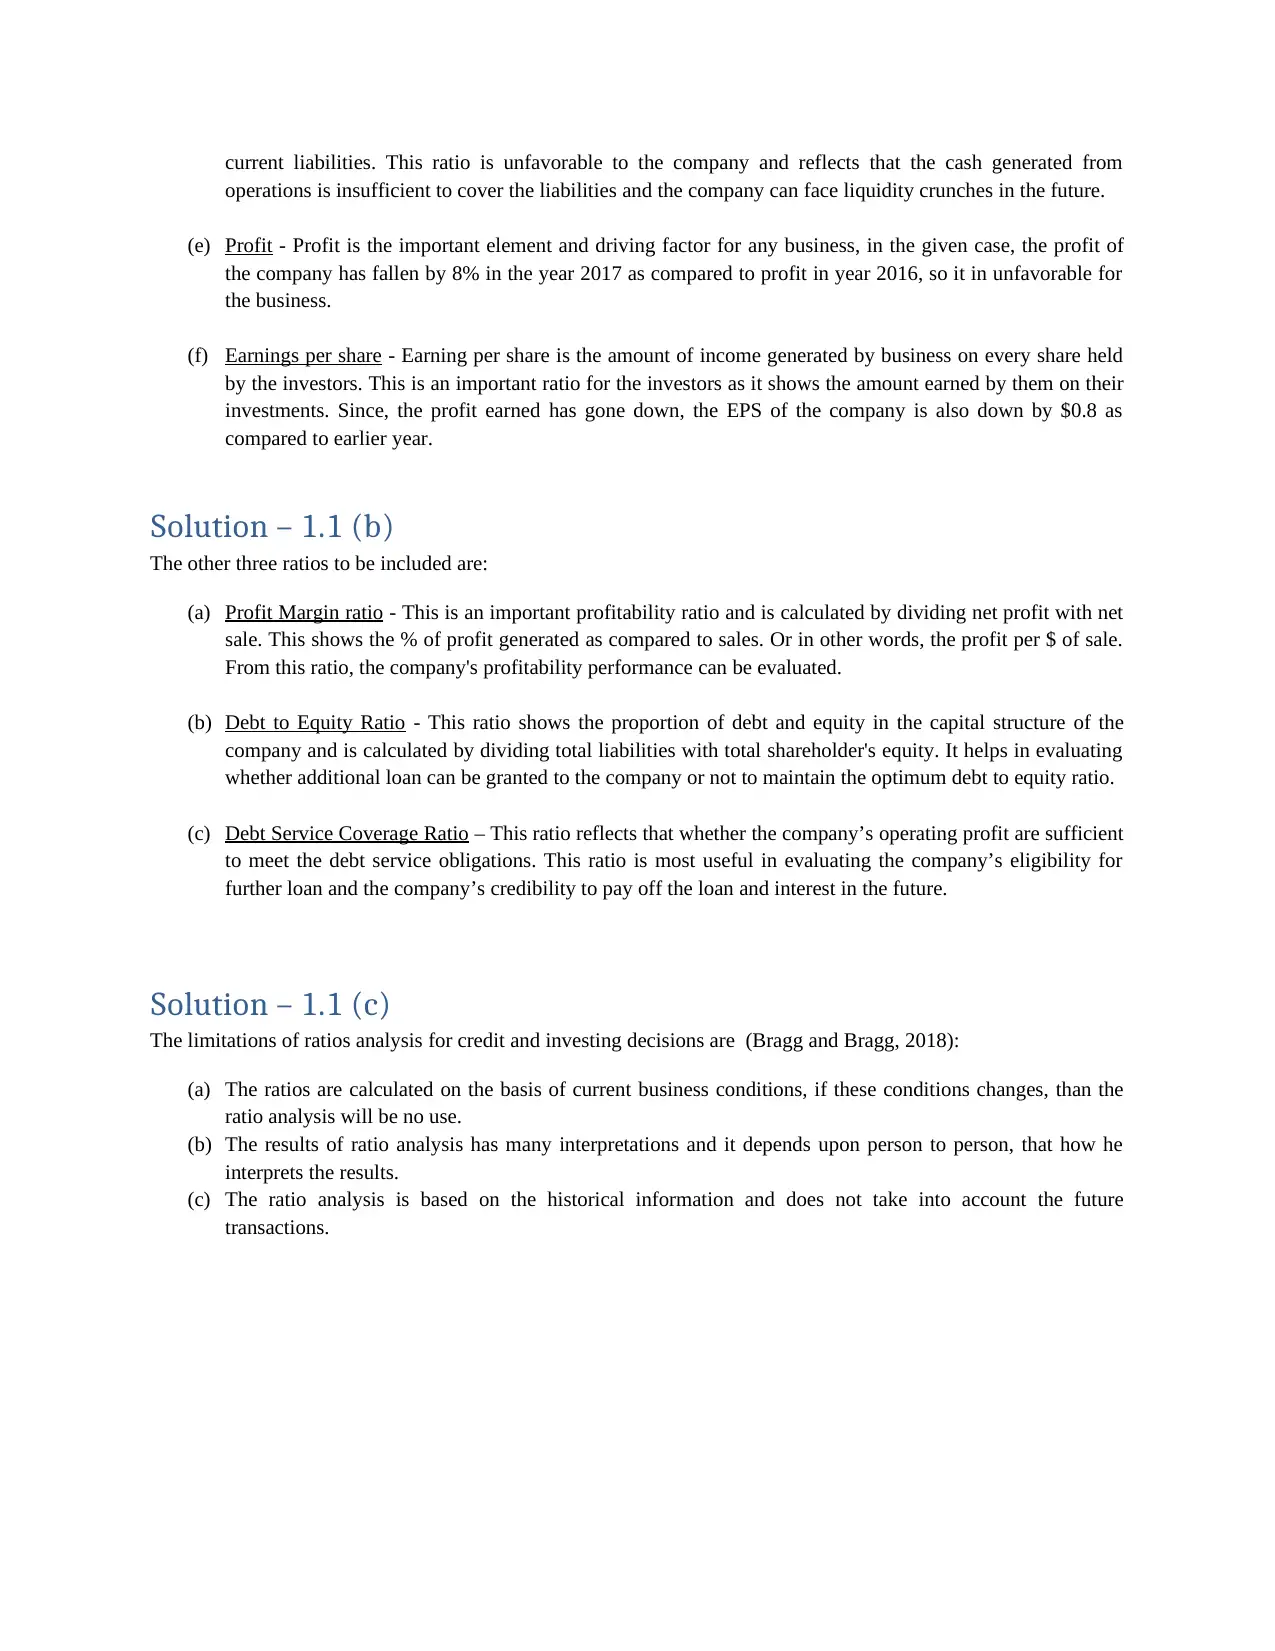
current liabilities. This ratio is unfavorable to the company and reflects that the cash generated from
operations is insufficient to cover the liabilities and the company can face liquidity crunches in the future.
(e) Profit - Profit is the important element and driving factor for any business, in the given case, the profit of
the company has fallen by 8% in the year 2017 as compared to profit in year 2016, so it in unfavorable for
the business.
(f) Earnings per share - Earning per share is the amount of income generated by business on every share held
by the investors. This is an important ratio for the investors as it shows the amount earned by them on their
investments. Since, the profit earned has gone down, the EPS of the company is also down by $0.8 as
compared to earlier year.
Solution – 1.1 (b)
The other three ratios to be included are:
(a) Profit Margin ratio - This is an important profitability ratio and is calculated by dividing net profit with net
sale. This shows the % of profit generated as compared to sales. Or in other words, the profit per $ of sale.
From this ratio, the company's profitability performance can be evaluated.
(b) Debt to Equity Ratio - This ratio shows the proportion of debt and equity in the capital structure of the
company and is calculated by dividing total liabilities with total shareholder's equity. It helps in evaluating
whether additional loan can be granted to the company or not to maintain the optimum debt to equity ratio.
(c) Debt Service Coverage Ratio – This ratio reflects that whether the company’s operating profit are sufficient
to meet the debt service obligations. This ratio is most useful in evaluating the company’s eligibility for
further loan and the company’s credibility to pay off the loan and interest in the future.
Solution – 1.1 (c)
The limitations of ratios analysis for credit and investing decisions are (Bragg and Bragg, 2018):
(a) The ratios are calculated on the basis of current business conditions, if these conditions changes, than the
ratio analysis will be no use.
(b) The results of ratio analysis has many interpretations and it depends upon person to person, that how he
interprets the results.
(c) The ratio analysis is based on the historical information and does not take into account the future
transactions.
Paraphrase This Document
Need a fresh take? Get an instant paraphrase of this document with our AI Paraphraser
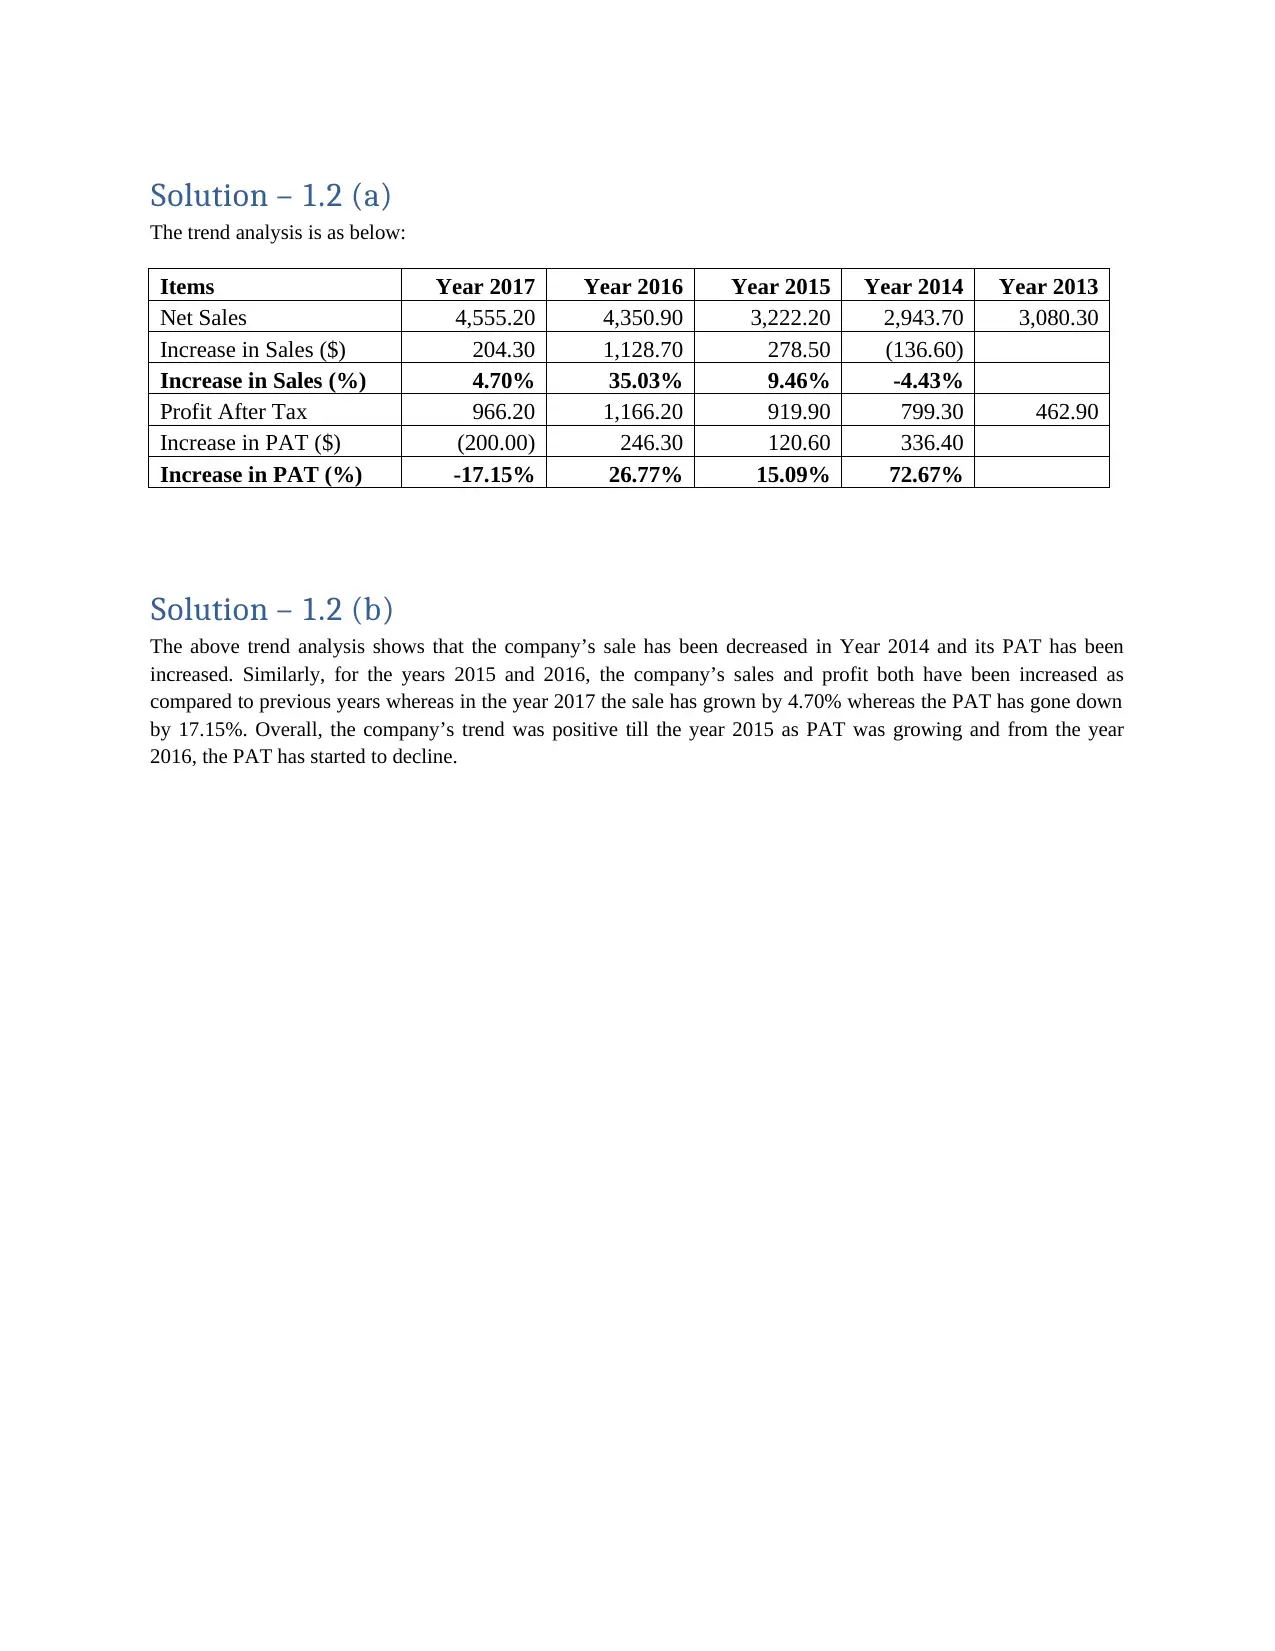
Solution – 1.2 (a)
The trend analysis is as below:
Items Year 2017 Year 2016 Year 2015 Year 2014 Year 2013
Net Sales 4,555.20 4,350.90 3,222.20 2,943.70 3,080.30
Increase in Sales ($) 204.30 1,128.70 278.50 (136.60)
Increase in Sales (%) 4.70% 35.03% 9.46% -4.43%
Profit After Tax 966.20 1,166.20 919.90 799.30 462.90
Increase in PAT ($) (200.00) 246.30 120.60 336.40
Increase in PAT (%) -17.15% 26.77% 15.09% 72.67%
Solution – 1.2 (b)
The above trend analysis shows that the company’s sale has been decreased in Year 2014 and its PAT has been
increased. Similarly, for the years 2015 and 2016, the company’s sales and profit both have been increased as
compared to previous years whereas in the year 2017 the sale has grown by 4.70% whereas the PAT has gone down
by 17.15%. Overall, the company’s trend was positive till the year 2015 as PAT was growing and from the year
2016, the PAT has started to decline.
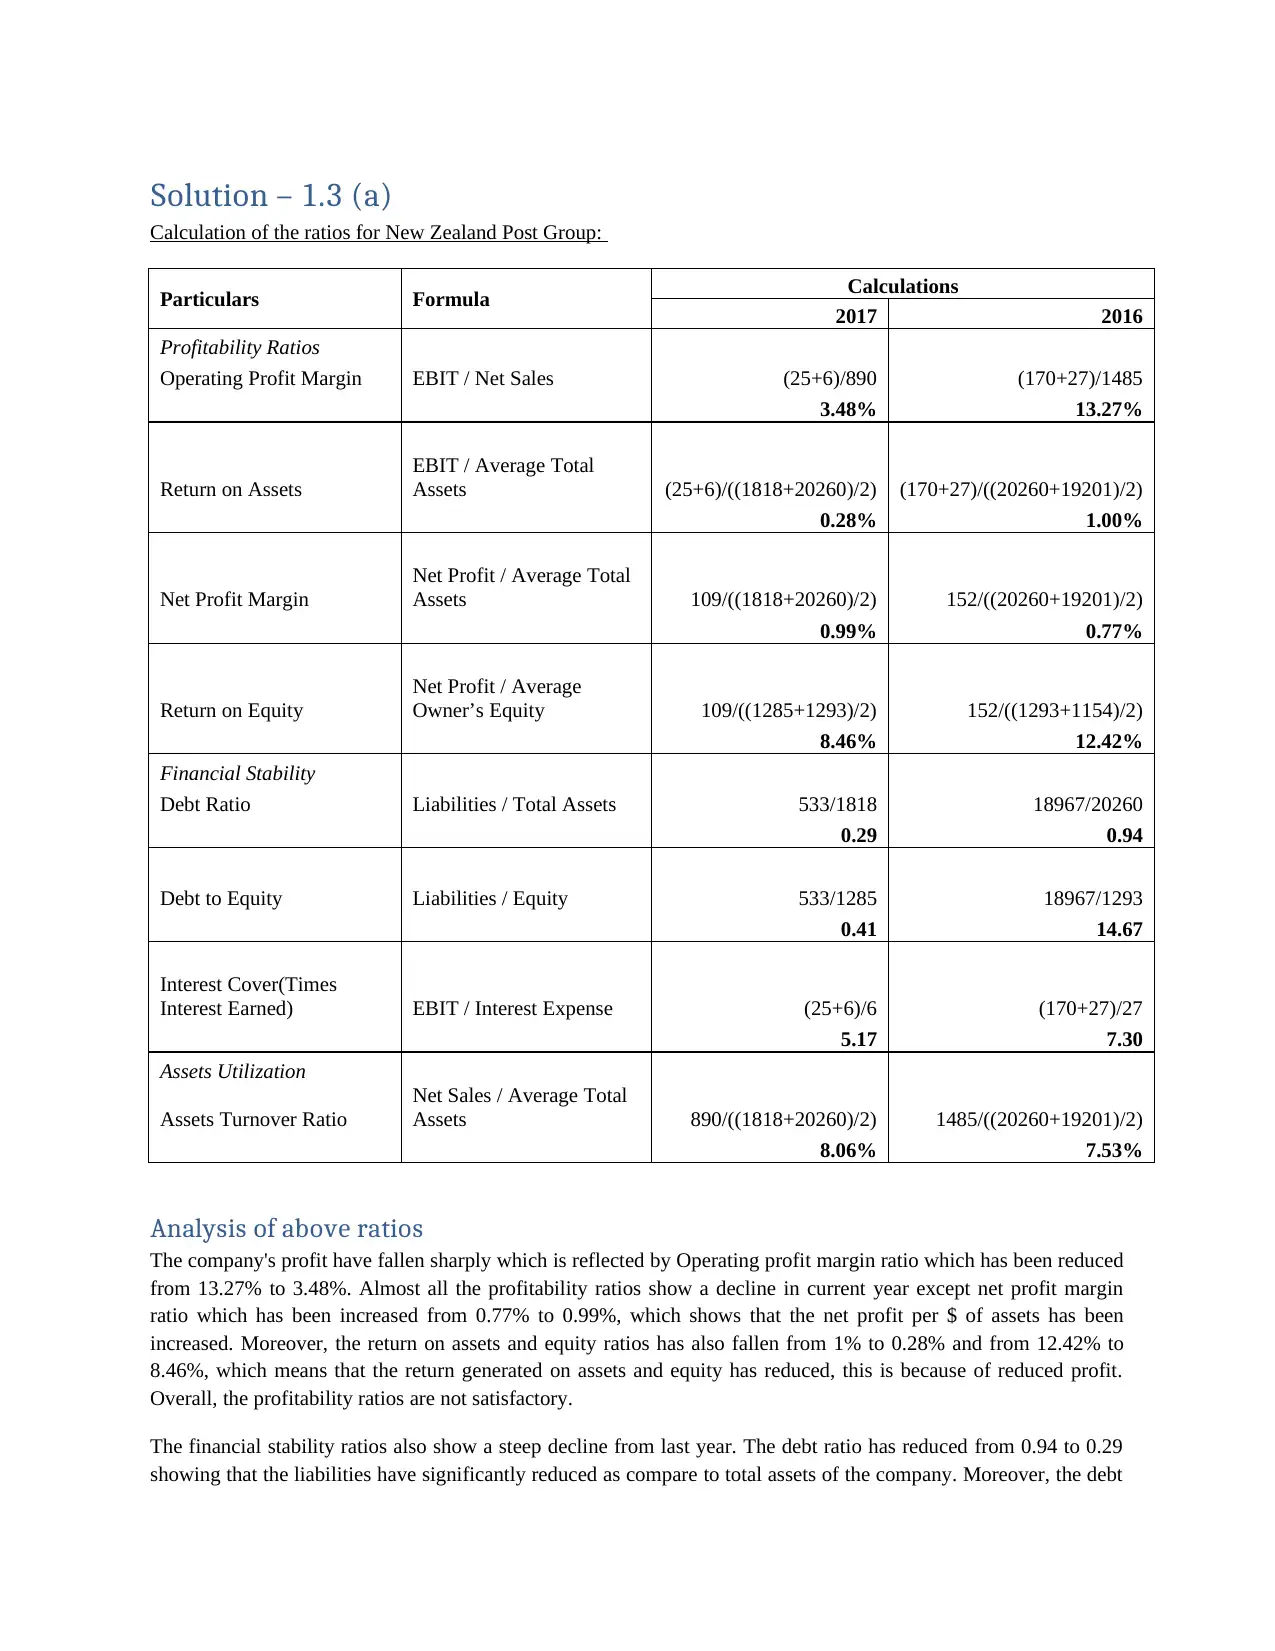
Solution – 1.3 (a)
Calculation of the ratios for New Zealand Post Group:
Particulars Formula Calculations
2017 2016
Profitability Ratios
Operating Profit Margin EBIT / Net Sales (25+6)/890 (170+27)/1485
3.48% 13.27%
Return on Assets
EBIT / Average Total
Assets (25+6)/((1818+20260)/2) (170+27)/((20260+19201)/2)
0.28% 1.00%
Net Profit Margin
Net Profit / Average Total
Assets 109/((1818+20260)/2) 152/((20260+19201)/2)
0.99% 0.77%
Return on Equity
Net Profit / Average
Owner’s Equity 109/((1285+1293)/2) 152/((1293+1154)/2)
8.46% 12.42%
Financial Stability
Debt Ratio Liabilities / Total Assets 533/1818 18967/20260
0.29 0.94
Debt to Equity Liabilities / Equity 533/1285 18967/1293
0.41 14.67
Interest Cover(Times
Interest Earned) EBIT / Interest Expense (25+6)/6 (170+27)/27
5.17 7.30
Assets Utilization
Assets Turnover Ratio
Net Sales / Average Total
Assets 890/((1818+20260)/2) 1485/((20260+19201)/2)
8.06% 7.53%
Analysis of above ratios
The company's profit have fallen sharply which is reflected by Operating profit margin ratio which has been reduced
from 13.27% to 3.48%. Almost all the profitability ratios show a decline in current year except net profit margin
ratio which has been increased from 0.77% to 0.99%, which shows that the net profit per $ of assets has been
increased. Moreover, the return on assets and equity ratios has also fallen from 1% to 0.28% and from 12.42% to
8.46%, which means that the return generated on assets and equity has reduced, this is because of reduced profit.
Overall, the profitability ratios are not satisfactory.
The financial stability ratios also show a steep decline from last year. The debt ratio has reduced from 0.94 to 0.29
showing that the liabilities have significantly reduced as compare to total assets of the company. Moreover, the debt
⊘ This is a preview!⊘
Do you want full access?
Subscribe today to unlock all pages.
Trusted by 1+ million students worldwide
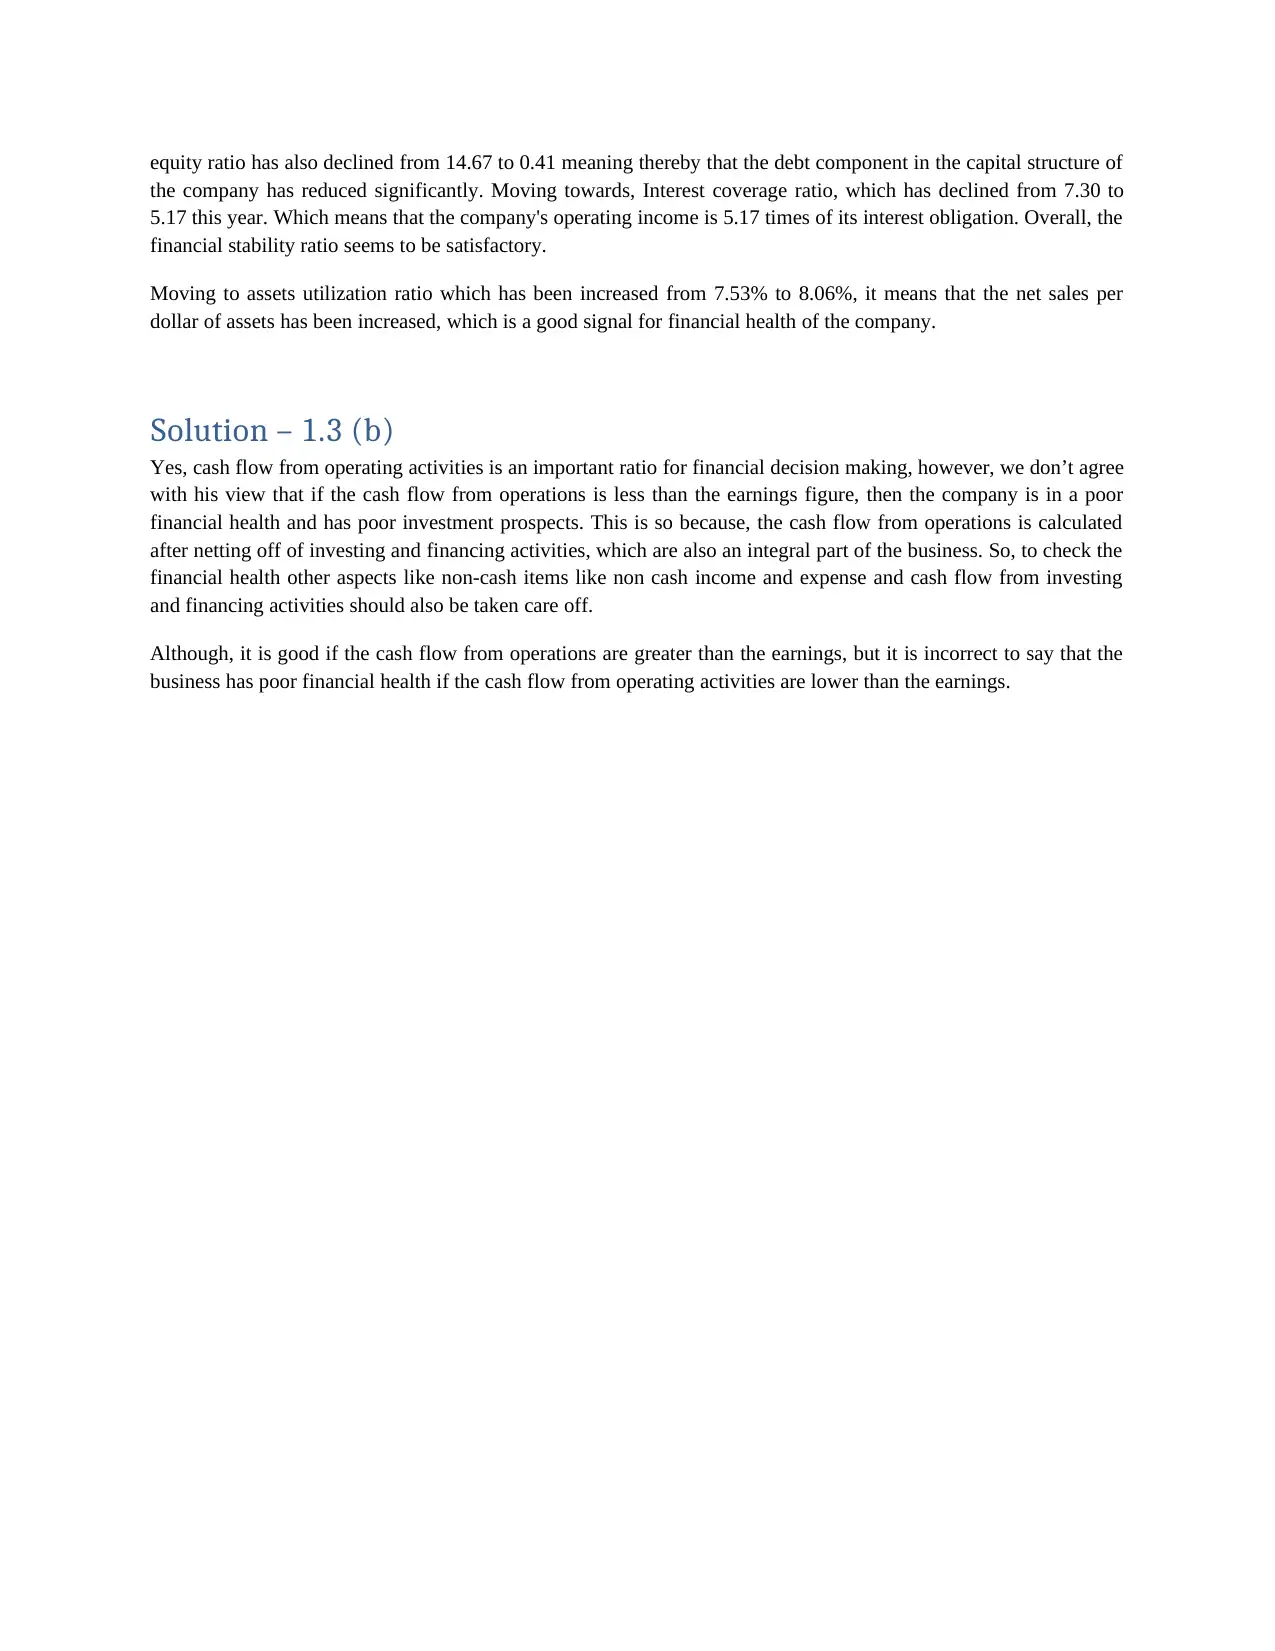
equity ratio has also declined from 14.67 to 0.41 meaning thereby that the debt component in the capital structure of
the company has reduced significantly. Moving towards, Interest coverage ratio, which has declined from 7.30 to
5.17 this year. Which means that the company's operating income is 5.17 times of its interest obligation. Overall, the
financial stability ratio seems to be satisfactory.
Moving to assets utilization ratio which has been increased from 7.53% to 8.06%, it means that the net sales per
dollar of assets has been increased, which is a good signal for financial health of the company.
Solution – 1.3 (b)
Yes, cash flow from operating activities is an important ratio for financial decision making, however, we don’t agree
with his view that if the cash flow from operations is less than the earnings figure, then the company is in a poor
financial health and has poor investment prospects. This is so because, the cash flow from operations is calculated
after netting off of investing and financing activities, which are also an integral part of the business. So, to check the
financial health other aspects like non-cash items like non cash income and expense and cash flow from investing
and financing activities should also be taken care off.
Although, it is good if the cash flow from operations are greater than the earnings, but it is incorrect to say that the
business has poor financial health if the cash flow from operating activities are lower than the earnings.
Paraphrase This Document
Need a fresh take? Get an instant paraphrase of this document with our AI Paraphraser
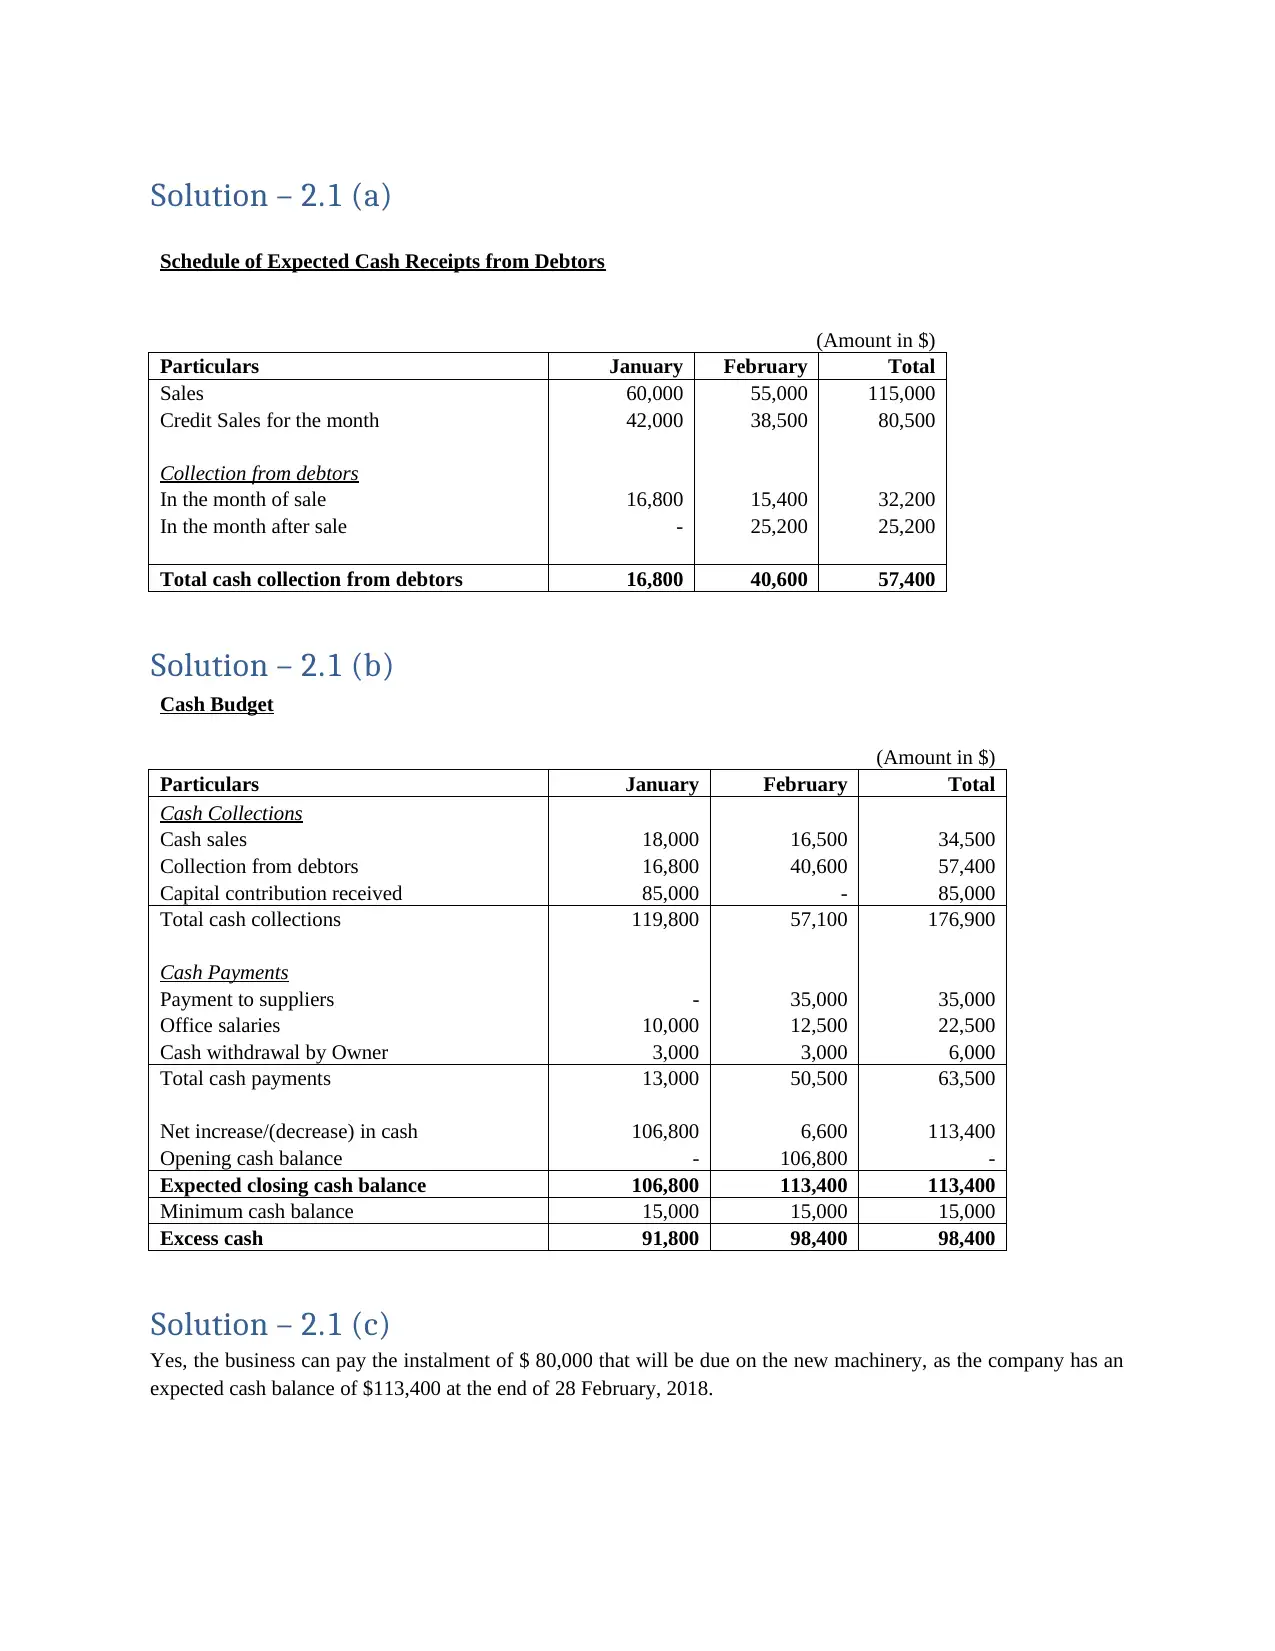
Solution – 2.1 (a)
Schedule of Expected Cash Receipts from Debtors
(Amount in $)
Particulars January February Total
Sales 60,000 55,000 115,000
Credit Sales for the month 42,000 38,500 80,500
Collection from debtors
In the month of sale 16,800 15,400 32,200
In the month after sale - 25,200 25,200
Total cash collection from debtors 16,800 40,600 57,400
Solution – 2.1 (b)
Cash Budget
(Amount in $)
Particulars January February Total
Cash Collections
Cash sales 18,000 16,500 34,500
Collection from debtors 16,800 40,600 57,400
Capital contribution received 85,000 - 85,000
Total cash collections 119,800 57,100 176,900
Cash Payments
Payment to suppliers - 35,000 35,000
Office salaries 10,000 12,500 22,500
Cash withdrawal by Owner 3,000 3,000 6,000
Total cash payments 13,000 50,500 63,500
Net increase/(decrease) in cash 106,800 6,600 113,400
Opening cash balance - 106,800 -
Expected closing cash balance 106,800 113,400 113,400
Minimum cash balance 15,000 15,000 15,000
Excess cash 91,800 98,400 98,400
Solution – 2.1 (c)
Yes, the business can pay the instalment of $ 80,000 that will be due on the new machinery, as the company has an
expected cash balance of $113,400 at the end of 28 February, 2018.
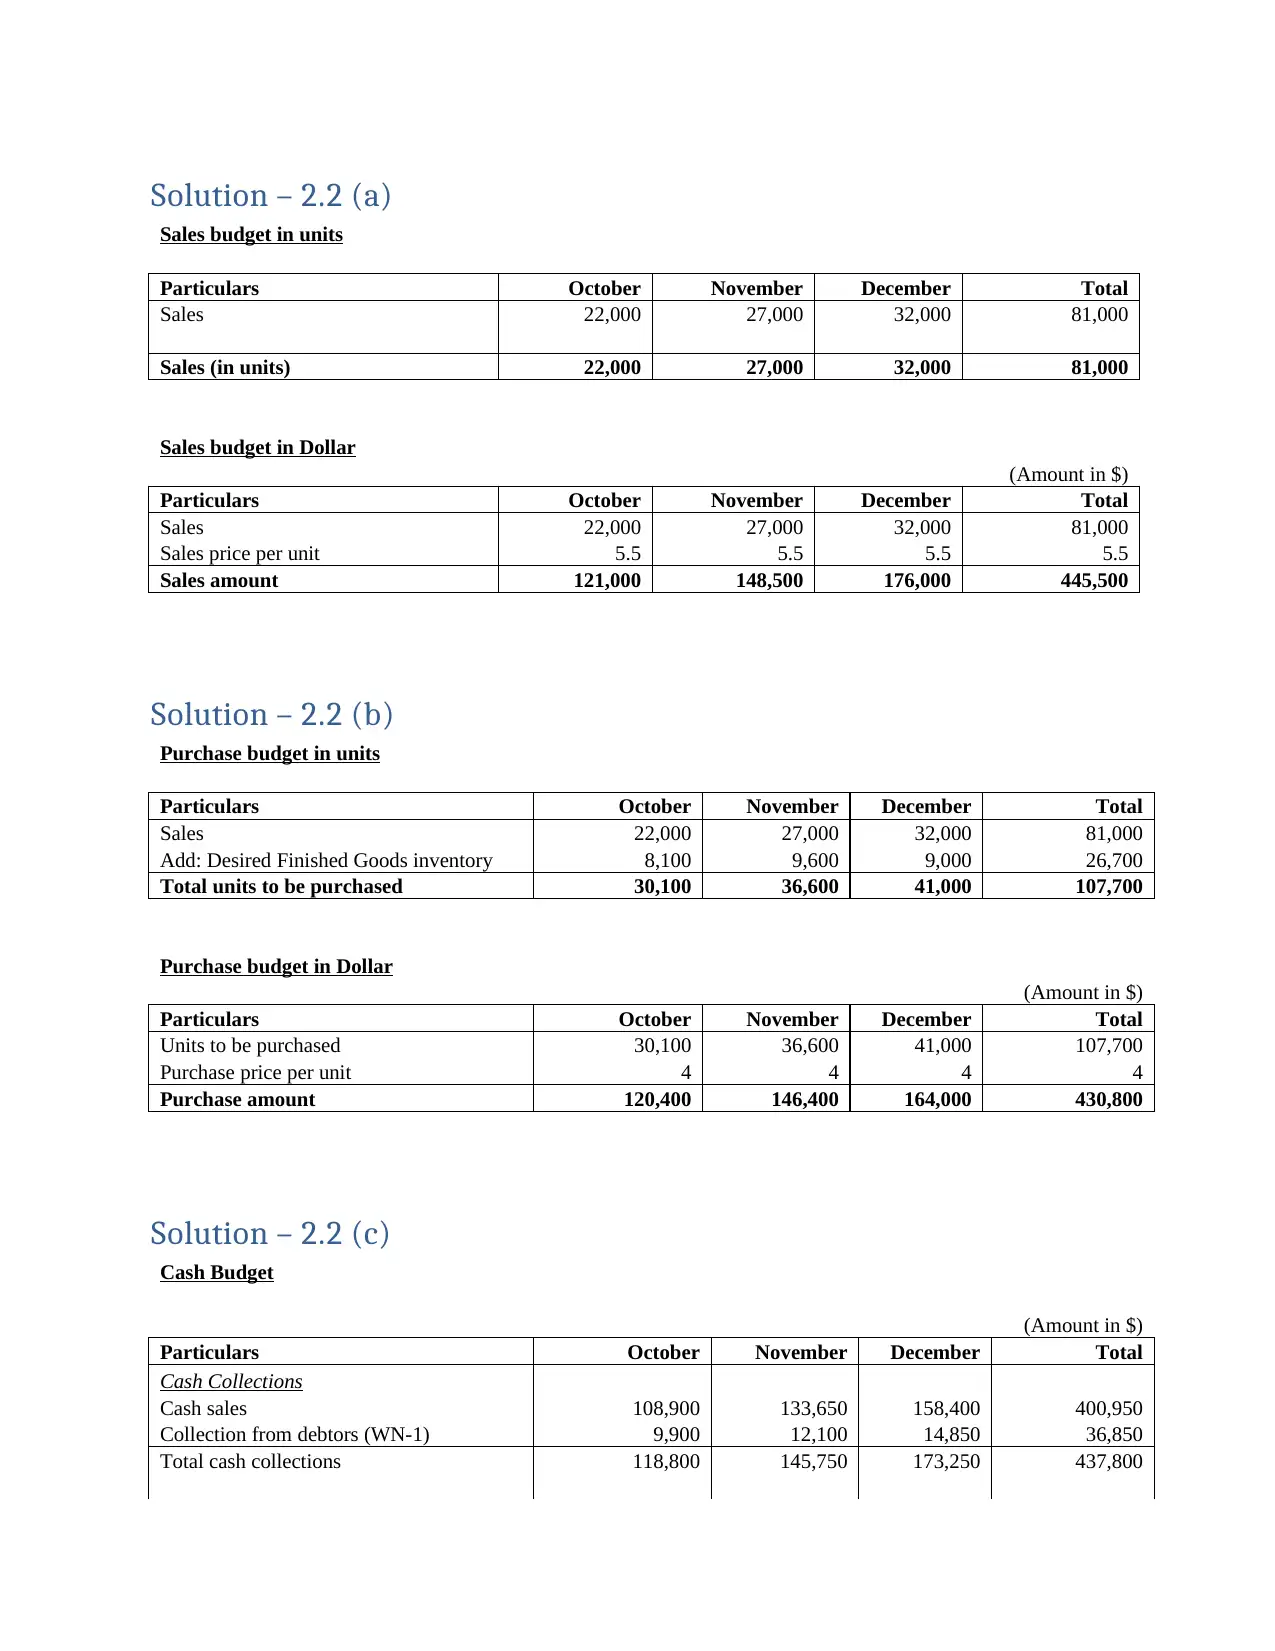
Solution – 2.2 (a)
Sales budget in units
Particulars October November December Total
Sales 22,000 27,000 32,000 81,000
Sales (in units) 22,000 27,000 32,000 81,000
Sales budget in Dollar
(Amount in $)
Particulars October November December Total
Sales 22,000 27,000 32,000 81,000
Sales price per unit 5.5 5.5 5.5 5.5
Sales amount 121,000 148,500 176,000 445,500
Solution – 2.2 (b)
Purchase budget in units
Particulars October November December Total
Sales 22,000 27,000 32,000 81,000
Add: Desired Finished Goods inventory 8,100 9,600 9,000 26,700
Total units to be purchased 30,100 36,600 41,000 107,700
Purchase budget in Dollar
(Amount in $)
Particulars October November December Total
Units to be purchased 30,100 36,600 41,000 107,700
Purchase price per unit 4 4 4 4
Purchase amount 120,400 146,400 164,000 430,800
Solution – 2.2 (c)
Cash Budget
(Amount in $)
Particulars October November December Total
Cash Collections
Cash sales 108,900 133,650 158,400 400,950
Collection from debtors (WN-1) 9,900 12,100 14,850 36,850
Total cash collections 118,800 145,750 173,250 437,800
⊘ This is a preview!⊘
Do you want full access?
Subscribe today to unlock all pages.
Trusted by 1+ million students worldwide
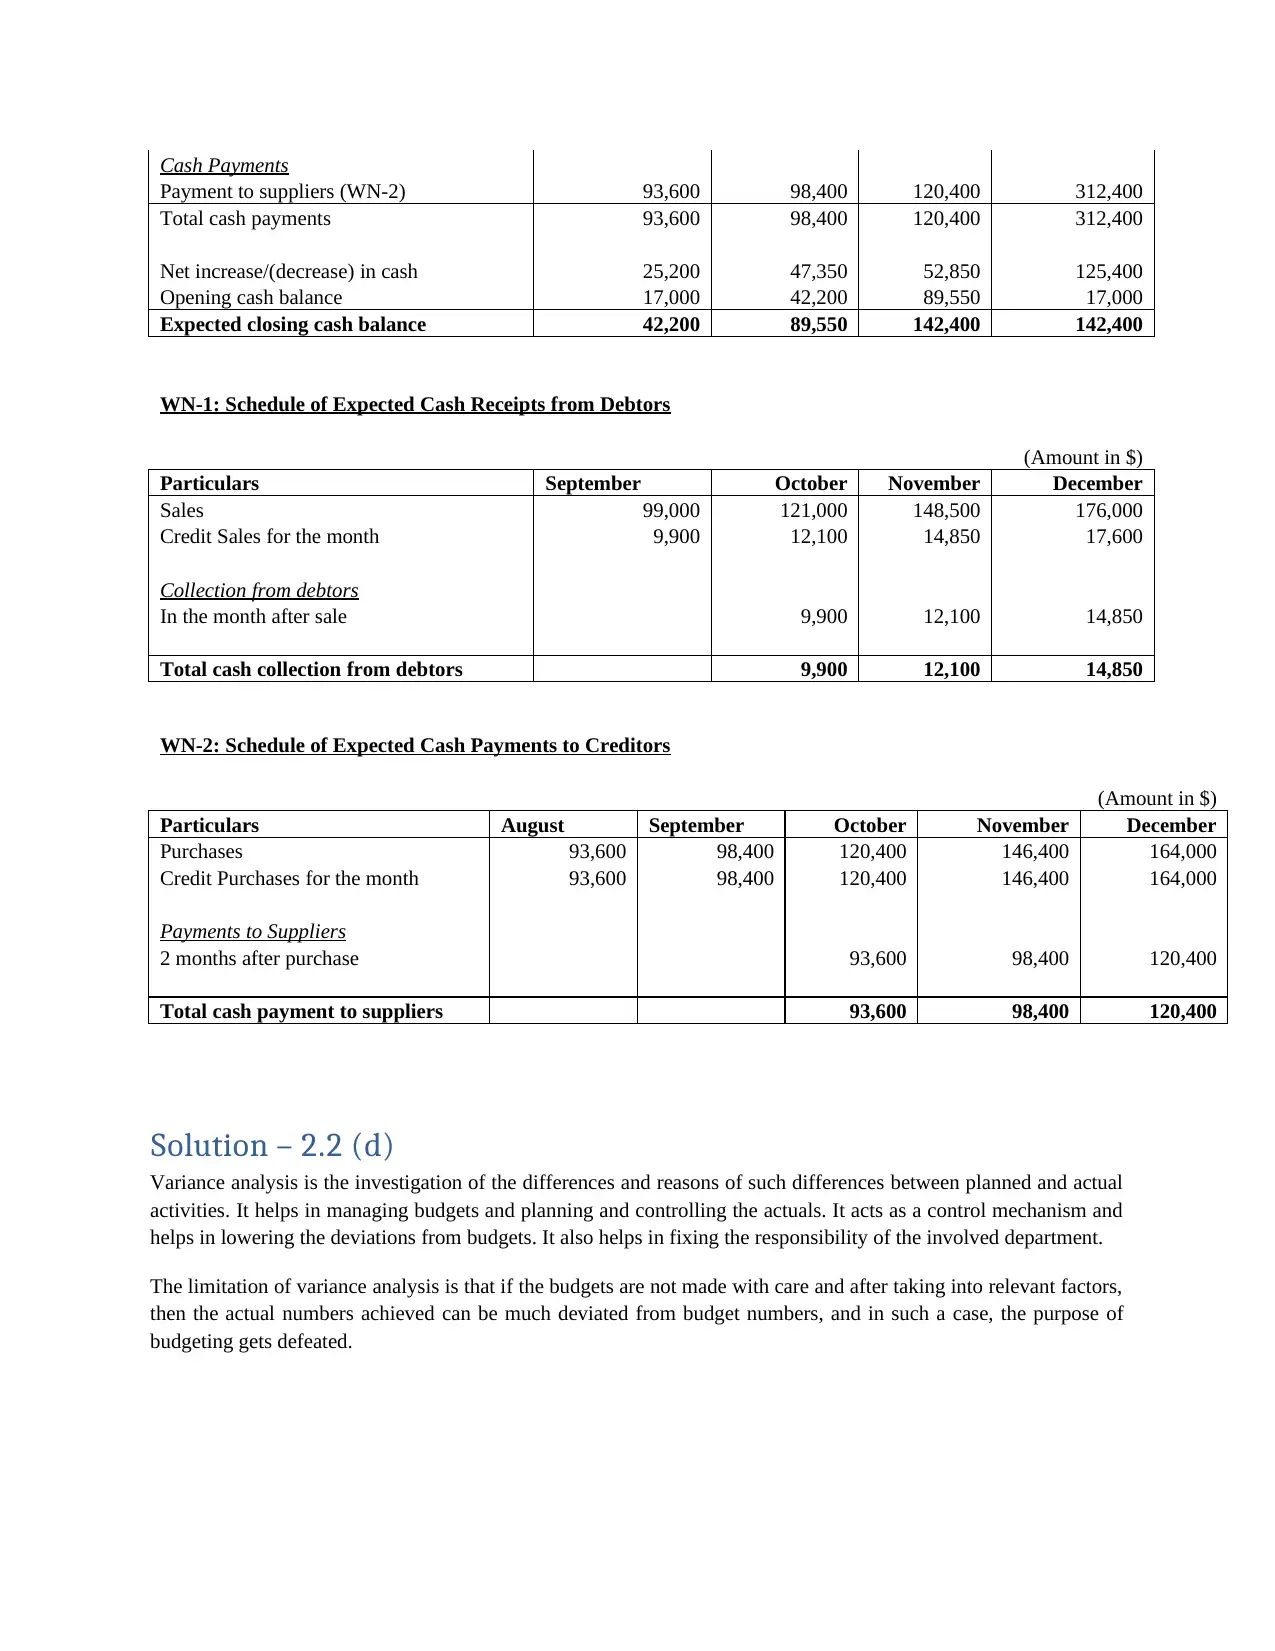
Cash Payments
Payment to suppliers (WN-2) 93,600 98,400 120,400 312,400
Total cash payments 93,600 98,400 120,400 312,400
Net increase/(decrease) in cash 25,200 47,350 52,850 125,400
Opening cash balance 17,000 42,200 89,550 17,000
Expected closing cash balance 42,200 89,550 142,400 142,400
WN-1: Schedule of Expected Cash Receipts from Debtors
(Amount in $)
Particulars September October November December
Sales 99,000 121,000 148,500 176,000
Credit Sales for the month 9,900 12,100 14,850 17,600
Collection from debtors
In the month after sale 9,900 12,100 14,850
Total cash collection from debtors 9,900 12,100 14,850
WN-2: Schedule of Expected Cash Payments to Creditors
(Amount in $)
Particulars August September October November December
Purchases 93,600 98,400 120,400 146,400 164,000
Credit Purchases for the month 93,600 98,400 120,400 146,400 164,000
Payments to Suppliers
2 months after purchase 93,600 98,400 120,400
Total cash payment to suppliers 93,600 98,400 120,400
Solution – 2.2 (d)
Variance analysis is the investigation of the differences and reasons of such differences between planned and actual
activities. It helps in managing budgets and planning and controlling the actuals. It acts as a control mechanism and
helps in lowering the deviations from budgets. It also helps in fixing the responsibility of the involved department.
The limitation of variance analysis is that if the budgets are not made with care and after taking into relevant factors,
then the actual numbers achieved can be much deviated from budget numbers, and in such a case, the purpose of
budgeting gets defeated.
Paraphrase This Document
Need a fresh take? Get an instant paraphrase of this document with our AI Paraphraser
References:
Momoh, O. (2018). Current Ratio. [online] Investopedia. Available at:
https://www.investopedia.com/terms/c/currentratio.asp [Accessed 10 May 2018].
Momoh, O. (2018). Quick Ratio. [online] Investopedia. Available at:
https://www.investopedia.com/terms/q/quickratio.asp [Accessed 10 May 2018].
Momoh, O. (2018). Asset Turnover Ratio. [online] Investopedia. Available at:
https://www.investopedia.com/terms/a/assetturnover.asp [Accessed 10 May 2018].
Accounting for Management. (2018). Current cash debt coverage ratio - explanation, formula, example and
interpretation | Accounting for Management. [online] Available at:
https://www.accountingformanagement.org/current-cash-debt-coverage-ratio/ [Accessed 10 May 2018].
Bragg, S. and Bragg, S. (2018). The limitations of ratio analysis. [online] AccountingTools. Available at:
https://www.accountingtools.com/articles/what-are-the-limitations-of-ratio-analysis.html [Accessed 10 May
2018].
1 out of 11
Related Documents


Your All-in-One AI-Powered Toolkit for Academic Success.
+13062052269
info@desklib.com
Available 24*7 on WhatsApp / Email
![[object Object]](/_next/static/media/star-bottom.7253800d.svg)
Unlock your academic potential
Copyright © 2020–2026 A2Z Services. All Rights Reserved. Developed and managed by ZUCOL.