Accounting and Finance for Managers: Analyzing Beverage Firms

Verified

Added on  2023/06/18

|18
|3606
|88
Report
AI Summary
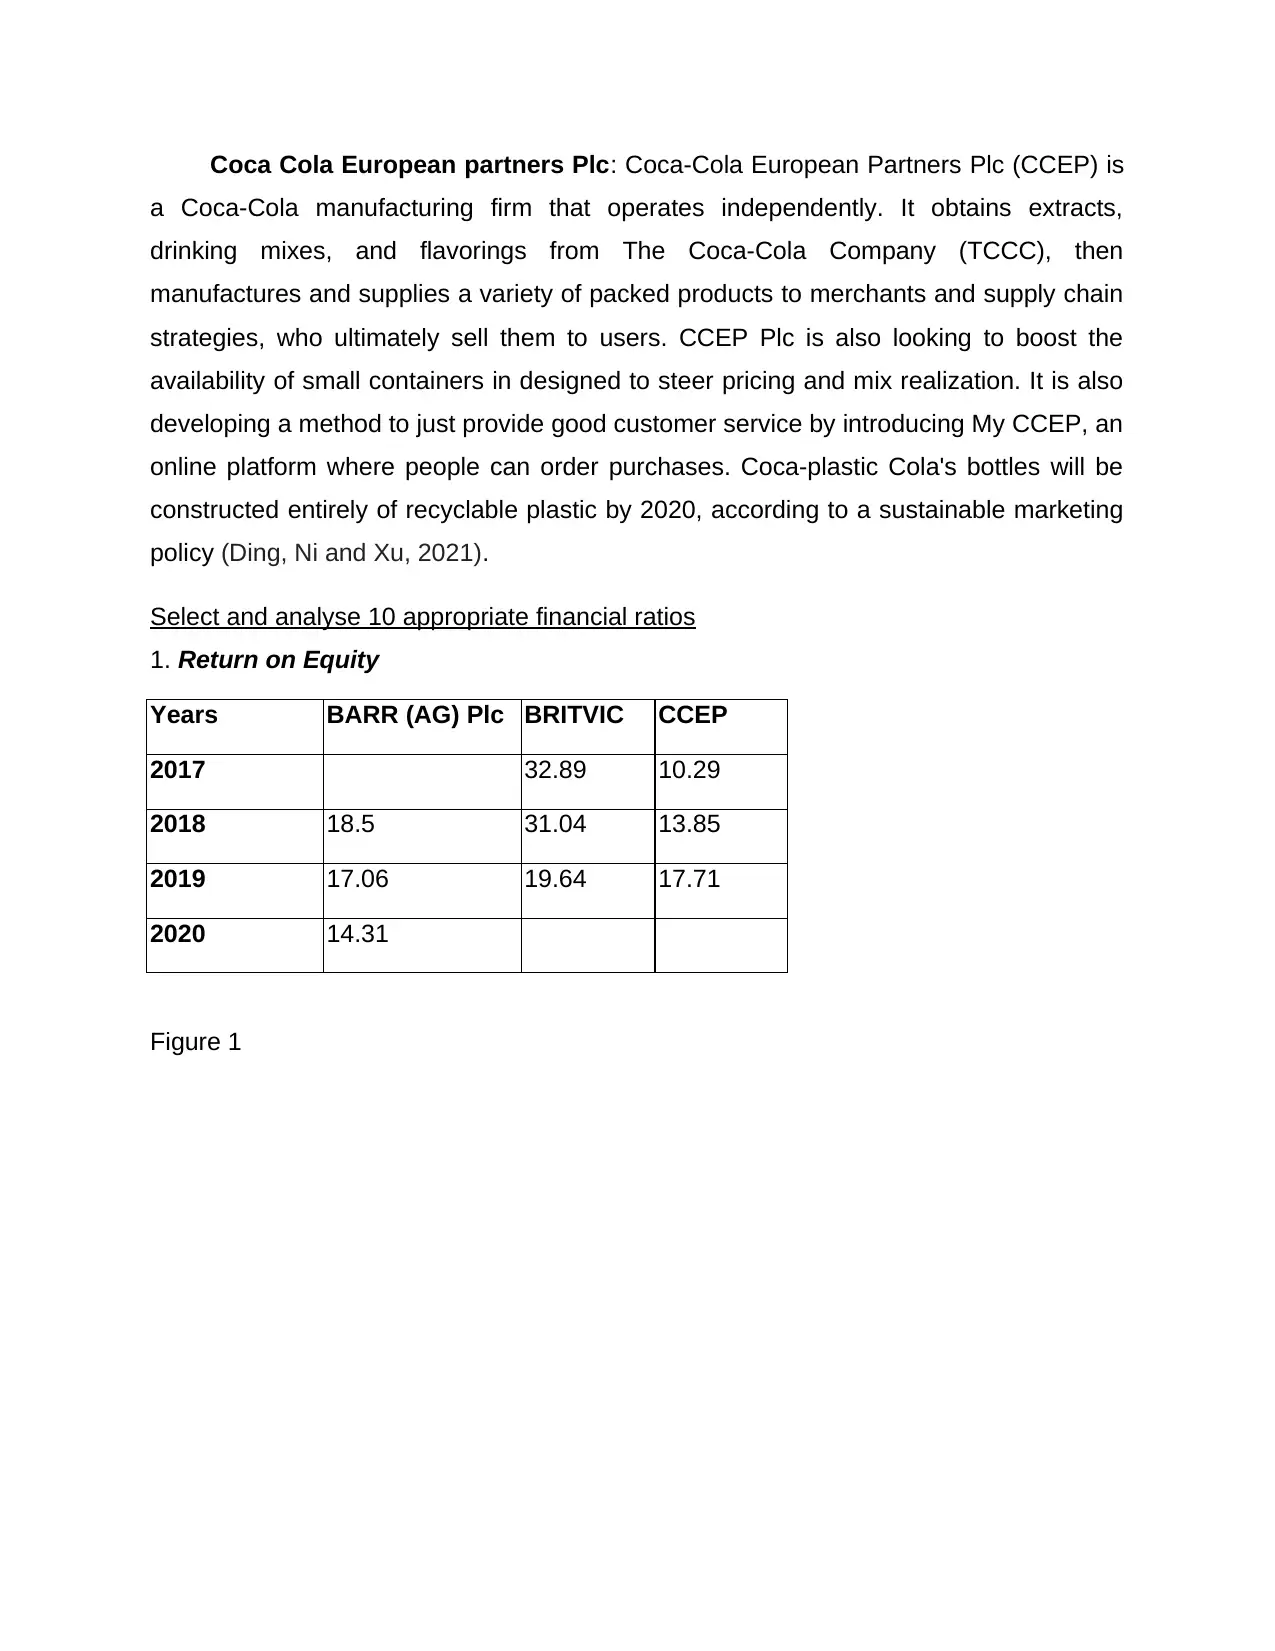
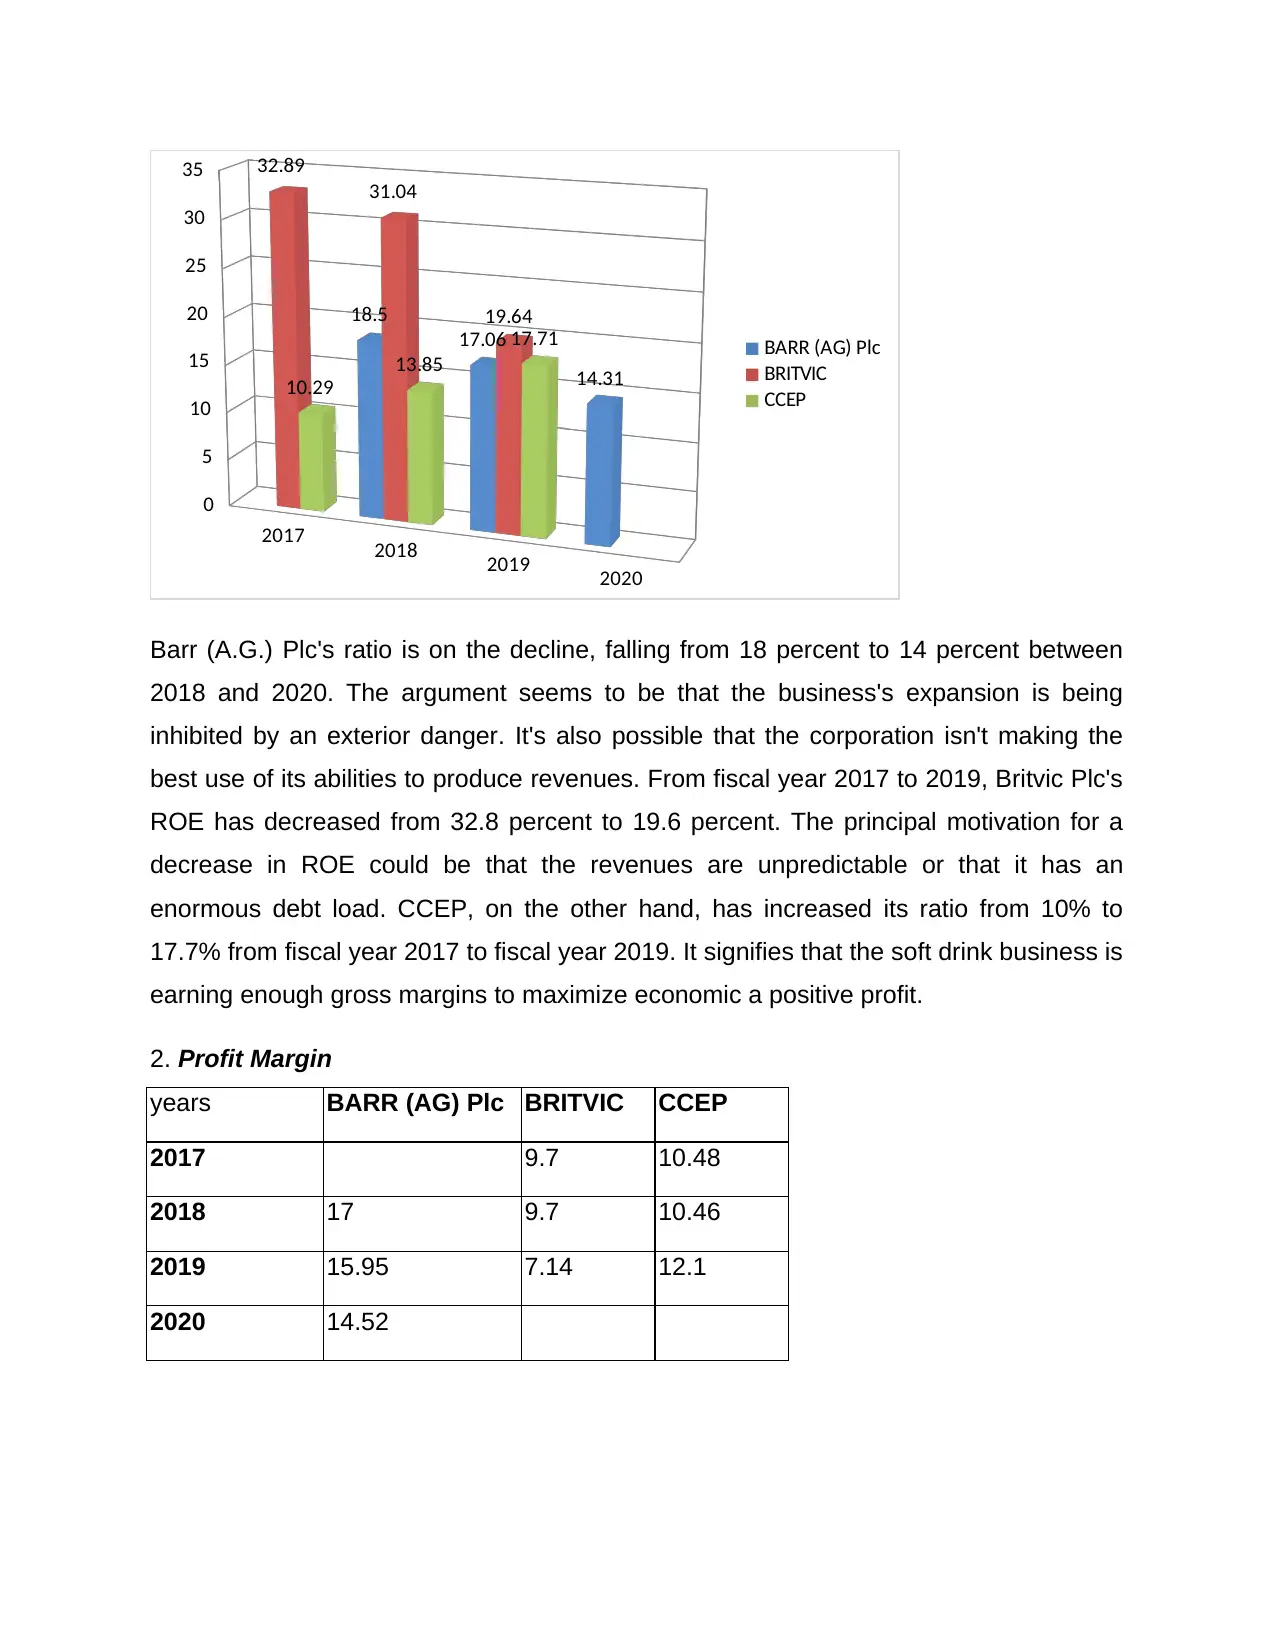
This report provides a detailed financial analysis of three beverage companies: AG Barr, Britvic, and Coca-Cola European Partners (CCEP). It analyzes their financial performance over three years using ten key financial ratios, including Return on Equity, Profit Margin, Gross Margin, Stock Turnover, Collection Period, Credit Period, Current Ratio, Interest Cover, Profit Per Employee, and Average Cost of Employee. The analysis reveals trends in profitability, efficiency, and liquidity for each company. CCEP emerges as the top-performing company based on its consistent improvement in return on capital employed and operating income. The report also briefly discusses internal and external long-term sources of finance available to these companies, focusing on how these sources contribute to their financial strategies and overall performance. Desklib offers similar solved assignments and resources for students.
Document Page
Accounting and
Finance for Managers
tabler-icon-diamond-filled.svg

Paraphrase This Document

Need a fresh take? Get an instant paraphrase of this document with our AI Paraphraser
Document Page
Contents
INTRODUCTION......................................................................................................................... 3
SECTION A................................................................................................................................. 3
Analyze the financial performance of the three companies identified in this case study over a
period of 3 financial years........................................................................................................3
Select and analyse 10 appropriate financial ratios...................................................................4
Ranking to best performance company..................................................................................13
SECTION B............................................................................................................................... 13
Internal and external long-term sources of finance available to one of the three companies..13
Select one source of long term finance used by one of the company’s in the case study.......14
CONCLUSION........................................................................................................................... 15
REFERENCES.......................................................................................................................... 16
Document Page
INTRODUCTION
Accountancy differs from money planning in that accountancy is the act of
collecting, managing, and presenting a corporation's economic finances in order to
reflect the business's accurate financial state, while money planning is the managing of
funds and investments. Managerial accounting could be used to make short - range and
long choices about a company’s financial position (Ong, Moroney and Xiao, 2021).
Accounting management aids management in determining effective decision aimed at
improving the particular project, as well as lengthy financial decisions.
SECTION A
Analyze the financial performance of the three companies identified in this case study
over a period of 3 financial years
BARR (A.G.) PLC: AG Barr plc (AGBarr) is a soft drink manufacturer and
distributor. Carbonated drinks, juice drinks, smoothies, energy bars, and mixers are
among the business and its products. AG Barr is based in Cumbernauld, North
Lanarkshire, United Kingdom. For the financial year ending January 2020 (FY2020), the
industry registered earnings of (British Pounds) GBP255.7 million, down 8.4 percent
from FY2019. A short-term trading plan was implemented that prioritized quantity
efficiency over quality. It aided the organisation in gaining a competitive advantage and
maintaining service standards. Additional lengthy plan was developed to renew the
company's price standing while lowering advertising activity.
Britvic plc: Britvic Plc (Britvic) is a soft drink distributor and maker. Sports drinks,
spring water, limestone’s, syrups, juice, squash, and sparking soda are all part of the
firm's product offering. With successful performance of initiatives, the industry is having
profitability in addition to increasing business and brand awareness in key areas.
Various products, such as Robinsons and Cordials, have been identified as luxury
brand categories that are taking market share. The EGalim legislation, which aims to
equalize business relationships with vendors and merchants in France, has had a
detrimental influence on supermarket sector revenues (Costa and Habib, 2021).
Document Page
Coca Cola European partners Plc: Coca-Cola European Partners Plc (CCEP) is
a Coca-Cola manufacturing firm that operates independently. It obtains extracts,
drinking mixes, and flavorings from The Coca-Cola Company (TCCC), then
manufactures and supplies a variety of packed products to merchants and supply chain
strategies, who ultimately sell them to users. CCEP Plc is also looking to boost the
availability of small containers in designed to steer pricing and mix realization. It is also
developing a method to just provide good customer service by introducing My CCEP, an
online platform where people can order purchases. Coca-plastic Cola's bottles will be
constructed entirely of recyclable plastic by 2020, according to a sustainable marketing
policy (Ding, Ni and Xu, 2021).
Select and analyse 10 appropriate financial ratios
1. Return on Equity
Years BARR (AG) Plc BRITVIC CCEP
2017 32.89 10.29
2018 18.5 31.04 13.85
2019 17.06 19.64 17.71
2020 14.31
Figure 1
tabler-icon-diamond-filled.svg

Paraphrase This Document

Need a fresh take? Get an instant paraphrase of this document with our AI Paraphraser
Document Page
2017 2018 2019 2020
0
5
10
15
20
25
30
35 32.89
31.04
19.64
10.29
13.85
17.71
18.5
17.06
14.31
BARR (AG) Plc
BRITVIC
CCEP
Barr (A.G.) Plc's ratio is on the decline, falling from 18 percent to 14 percent between
2018 and 2020. The argument seems to be that the business's expansion is being
inhibited by an exterior danger. It's also possible that the corporation isn't making the
best use of its abilities to produce revenues. From fiscal year 2017 to 2019, Britvic Plc's
ROE has decreased from 32.8 percent to 19.6 percent. The principal motivation for a
decrease in ROE could be that the revenues are unpredictable or that it has an
enormous debt load. CCEP, on the other hand, has increased its ratio from 10% to
17.7% from fiscal year 2017 to fiscal year 2019. It signifies that the soft drink business is
earning enough gross margins to maximize economic a positive profit.
2. Profit Margin
years BARR (AG) Plc BRITVIC CCEP
2017 9.7 10.48
2018 17 9.7 10.46
2019 15.95 7.14 12.1
2020 14.52
Document Page
2017 2018 2019 2020
0
5
10
15
20
25
30
35
40
9.7
9.7
7.14
10.48
10.46
12.1
17 15.95 14.52
CCEP
BRITVIC
BARR (AG) Plc
Barr (A.G.) Plc's profitability is likewise decreasing, falling from 17 percent to 14
percent, indicating that the business earnings are declining. Whether the company is
overcharging for its goods or its pricing policies is inadequate. In the instance of Britvic
Plc, however, it held steady for two years before beginning to decline in the third.
Furthermore, CCEP Plc's profit margin increased from 10.46% to 12.1%, indicates that
the firm is profitable.
3. Gross Margin
years BARR (AG) Plc BRITVIC CCEP
2017 57.97 43.21
2018 47.44 58.08 43.02
2019 47.06 56.79 43.22
2020 46.52
Document Page
2017 2018 2019 2020
0
10
20
30
40
50
60 57.97 58.08 56.79
43.21 43.02 43.22
47.44 47.06 46.52
BARR (AG) Plc
BRITVIC
CCEP
Barr Plc's Gross Margin, which measures how well a corporation utilizes its assets to
produce earnings, is similarly declining from 47 percent to 46 percent between 2018
and 2020. In the case of Britvic Plc, the ratio increased from 2017 to 2018, but then fell
in 2019, indicates that the firm is not earning enough revenues to preserve its profit
margin. CCEP's operating margin, but in the other side, has been relatively steady and
over 3 years, with slight variations.
4. Stock Turnover
years BARR (AG) Plc BRITVIC CCEP
2017 9.75 17.02
2018 14.67 10.41 16.62
2019 13.68 10.12 16.62
2020 14.07
tabler-icon-diamond-filled.svg

Paraphrase This Document

Need a fresh take? Get an instant paraphrase of this document with our AI Paraphraser
Document Page
2017 2018 2019 2020
0
2
4
6
8
10
12
14
16
18
9.75 10.41 10.12
17.02 16.62 16.62
14.67 13.68 14.07
BARR (AG) Plc
BRITVIC
CCEP
The cost of sales is identical to the asset turnover calculation. It contains material cost,
straight multiplied by entire or typical storage to illustrate how often merchandise is
“transformed” or sold over tenure. The proportion can then be used to detect when
inventories rates are too high in comparison to revenues. Barr Plc's stock turnover ratio
is from 13 to 14 times, implying that the corporation converts 13 to 14 times its stockpile
into actual sales. Britvic Plc, and from the other side, transforms 9 to 10 times its
product availability in sales, whilst CEPP transforms its stock 17 to 16 times in
revenues.
5. Collection Period
years BARR (AG) Plc BRITVIC CCEP
2017 71 56
2018 73 75 52
2019 70 80 50
2020 77
Document Page
2017 2018 2019 2020
0
20
40
60
80
100
120
140
160
180
200
71
75 80
56
52 50
73 70 77
CCEP
BRITVIC
BARR (AG) Plc
The average collection period is the number of time it requires a takes to finance its
collections on normal. It shows how efficient the previously carried is, and the smaller it
is, the quicker the company's cash conversion cycle is, that has a favorable effect on
the profitability. Barr Plc's three-year cash cycle runs from 73 to 77 days, implying that it
takes roughly 73 to 77 days to recover account receivables. Britvic Plc is retaining its
dues for a longer period of time than Barr Plc, ranging from 70 to 80 days. CCEP, but in
the other extreme, collects debts from borrowers in 52 to 56 days.
6. Credit Period
years BARR (AG) Plc BRITVIC CCEP
2017 61 34
2018 24 64 35
2019 26 68 34
2020 20
Document Page
2017 2018 2019 2020
0
10
20
30
40
50
60
70 61 64
68
34 35 34
24 26
20
BARR (AG) Plc
BRITVIC
CCEP
Barr Plc pays its bills in 20 to 26 straight days over the last 3 years of 2018 to 2020,
according to the credit terms. Britvic Plc, from the other extreme, takes 61 to 68 days to
satisfy its debts with lenders. It takes CCEP 34 to 35 days to pay its debts with lenders
and vendors.
7. Current Ratio
years BARR (AG) Plc BRITVIC CCEP
2017 0.93 1.01
2018 1.52 0.93 0.79
2019 1.62 0.81 0.75
2020 1.44
tabler-icon-diamond-filled.svg

Paraphrase This Document

Need a fresh take? Get an instant paraphrase of this document with our AI Paraphraser
Document Page
2017 2018 2019 2020
0
0.2
0.4
0.6
0.8
1
1.2
1.4
1.6
1.8
0.93 0.93
0.81
1.01
0.79 0.75
1.52
1.62
1.44
BARR (AG) Plc
BRITVIC
CCEP
Barr Plc's current ratio rises one year before falling the following, i.e., it was 1.52 in
2018 and rose to 1.62 in 2019 before falling to 1.44 in 2020. Britvic Plc, on either
extreme, has seen its ratio fall from 0.93 to 0.81 during the last two years, indicating that
the firm does not have enough current assets to satisfy its short-term dues on time.
From 2017 to 2019, CCEP's ratio fell from 1.01 to 0.75, indicates that the firm has only
0.75 resources for every 1 liabilities and just need outside help to fulfil its 0.25 liabilities.
8. Interest Cover
years BARR (AG) Plc BRITVIC CCEP
2017 5.94 8.51
2018 44.8 8.12 9.29
2019 76.67 8.43 10.68
2020 65
Document Page
2017 2018 2019 2020
0
10
20
30
40
50
60
70
80
90
100
5.94
8.12
8.43
8.51
9.29
10.68
44.8
76.67
65
CCEP
BRITVIC
BARR (AG) Plc
The capability of a corporation to meet its interest expenses on mortgages and liabilities
in a given time is determined by interest cover percentages. Barr Plc's ratio fluctuates
with time, from 44.8 times in 2018 to 65 times in 2020. From 2017 to 2019, it increased
by 5 to 8 occasions in Britvic Plc and 8 to 10 times in CEPP Plc.
9. Profit Per Employee
years BARR (AG) Plc BRITVIC CCEP
2017 29 44
2018 46 30 46
2019 46 23 53
2020 39
chevron_up_icon
1 out of 18
circle_padding
hide_on_mobile
zoom_out_icon
[object Object]