Accounting and Finance Report: Gravepals Plc, Break-Even Analysis, UK
VerifiedAdded on 2020/10/22
|17
|4366
|185
Report
AI Summary
This report provides a comprehensive analysis of accounting and finance principles, focusing on the financial performance of Gravepals Plc. It includes the preparation of the income statement and balance sheet, offering insights into the company's profitability and financial position. The report delves into break-even analysis, calculating the break-even point, margin of safety, and desired profit under different scenarios. Furthermore, it explores investment appraisal techniques, such as payback period, ARR, and NPV, while also discussing the benefits and limitations of budgeting as a strategic planning tool. The report concludes with a discussion of the underlying assumptions of the break-even model and provides a detailed financial analysis and strategic recommendations for Gravepals Plc.

Introduction to
Accounting and
Finance.
Accounting and
Finance.
Paraphrase This Document
Need a fresh take? Get an instant paraphrase of this document with our AI Paraphraser
Table of Contents
INTRODUCTION...........................................................................................................................1
MAIN BODY ..................................................................................................................................1
Part A. Financial Position and Income statement of Gravepals Plc............................................1
Q2) Break even model.....................................................................................................................4
PART C............................................................................................................................................8
a. Calculation of payback period, ARR and NPV.......................................................................8
b. Merit and limitation of investment appraisal techniques........................................................9
C) Key benefits and limitation of budget as a tool for strategies planning. .............................11
CONCLUSION..............................................................................................................................12
REFERENCES................................................................................................................................1

⊘ This is a preview!⊘
Do you want full access?
Subscribe today to unlock all pages.
Trusted by 1+ million students worldwide
INTRODUCTION
Accounting is a systematic and comprehensive recording of financial transaction
pertaining to the business. This refers to process of summarizing, analysing and reporting of
transaction to government authorities and tax collection entities. The main of this present report
is to application of theoretical concepts to a range of practical scenarios enabling production of
solutions to business problems (Aggarwal and Goodell, 2014). The financial position and income
statement for Gravepals Plc is being prepared in this report. As contribution, break even point,
margin of safety and profit for the Cornpeace limited is being calculated in this report. Apart
from this, assumption of break even point is also explained in this report. There are different
investment appraisal techniques which is used by companies, is discussed in this report. The
benefit and limitation of using budget as tool for strategic planning is also explained in this
report.
MAIN BODY
Part A. Financial Position and Income statement of Gravepals Plc
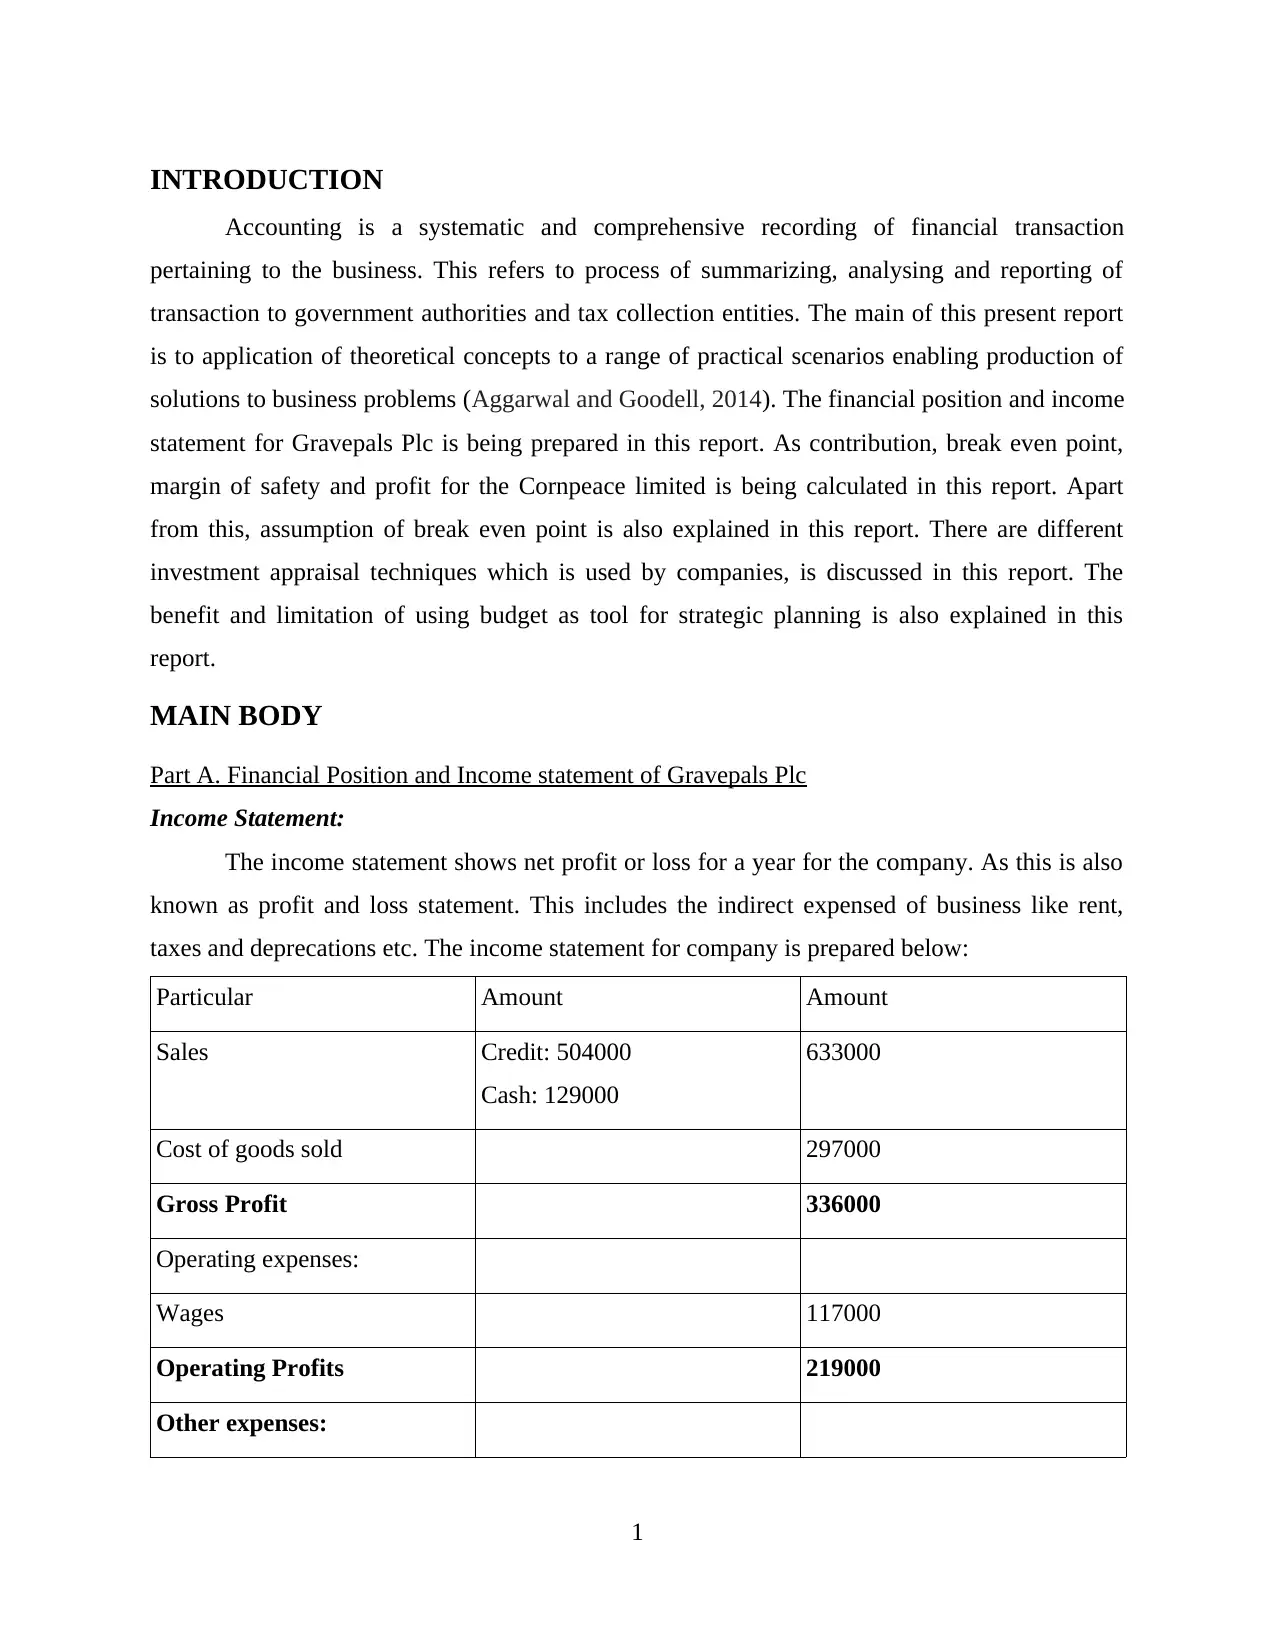
Income Statement:
The income statement shows net profit or loss for a year for the company. As this is also
known as profit and loss statement. This includes the indirect expensed of business like rent,
taxes and deprecations etc. The income statement for company is prepared below:
Particular Amount Amount
Sales Credit: 504000
Cash: 129000
633000
Cost of goods sold 297000
Gross Profit 336000
Operating expenses:
Wages 117000
Operating Profits 219000
Other expenses:
1
Accounting is a systematic and comprehensive recording of financial transaction
pertaining to the business. This refers to process of summarizing, analysing and reporting of
transaction to government authorities and tax collection entities. The main of this present report
is to application of theoretical concepts to a range of practical scenarios enabling production of
solutions to business problems (Aggarwal and Goodell, 2014). The financial position and income
statement for Gravepals Plc is being prepared in this report. As contribution, break even point,
margin of safety and profit for the Cornpeace limited is being calculated in this report. Apart
from this, assumption of break even point is also explained in this report. There are different
investment appraisal techniques which is used by companies, is discussed in this report. The
benefit and limitation of using budget as tool for strategic planning is also explained in this
report.
MAIN BODY
Part A. Financial Position and Income statement of Gravepals Plc
Income Statement:
The income statement shows net profit or loss for a year for the company. As this is also
known as profit and loss statement. This includes the indirect expensed of business like rent,
taxes and deprecations etc. The income statement for company is prepared below:
Particular Amount Amount
Sales Credit: 504000
Cash: 129000
633000
Cost of goods sold 297000
Gross Profit 336000
Operating expenses:
Wages 117000
Operating Profits 219000
Other expenses:
1
Paraphrase This Document
Need a fresh take? Get an instant paraphrase of this document with our AI Paraphraser
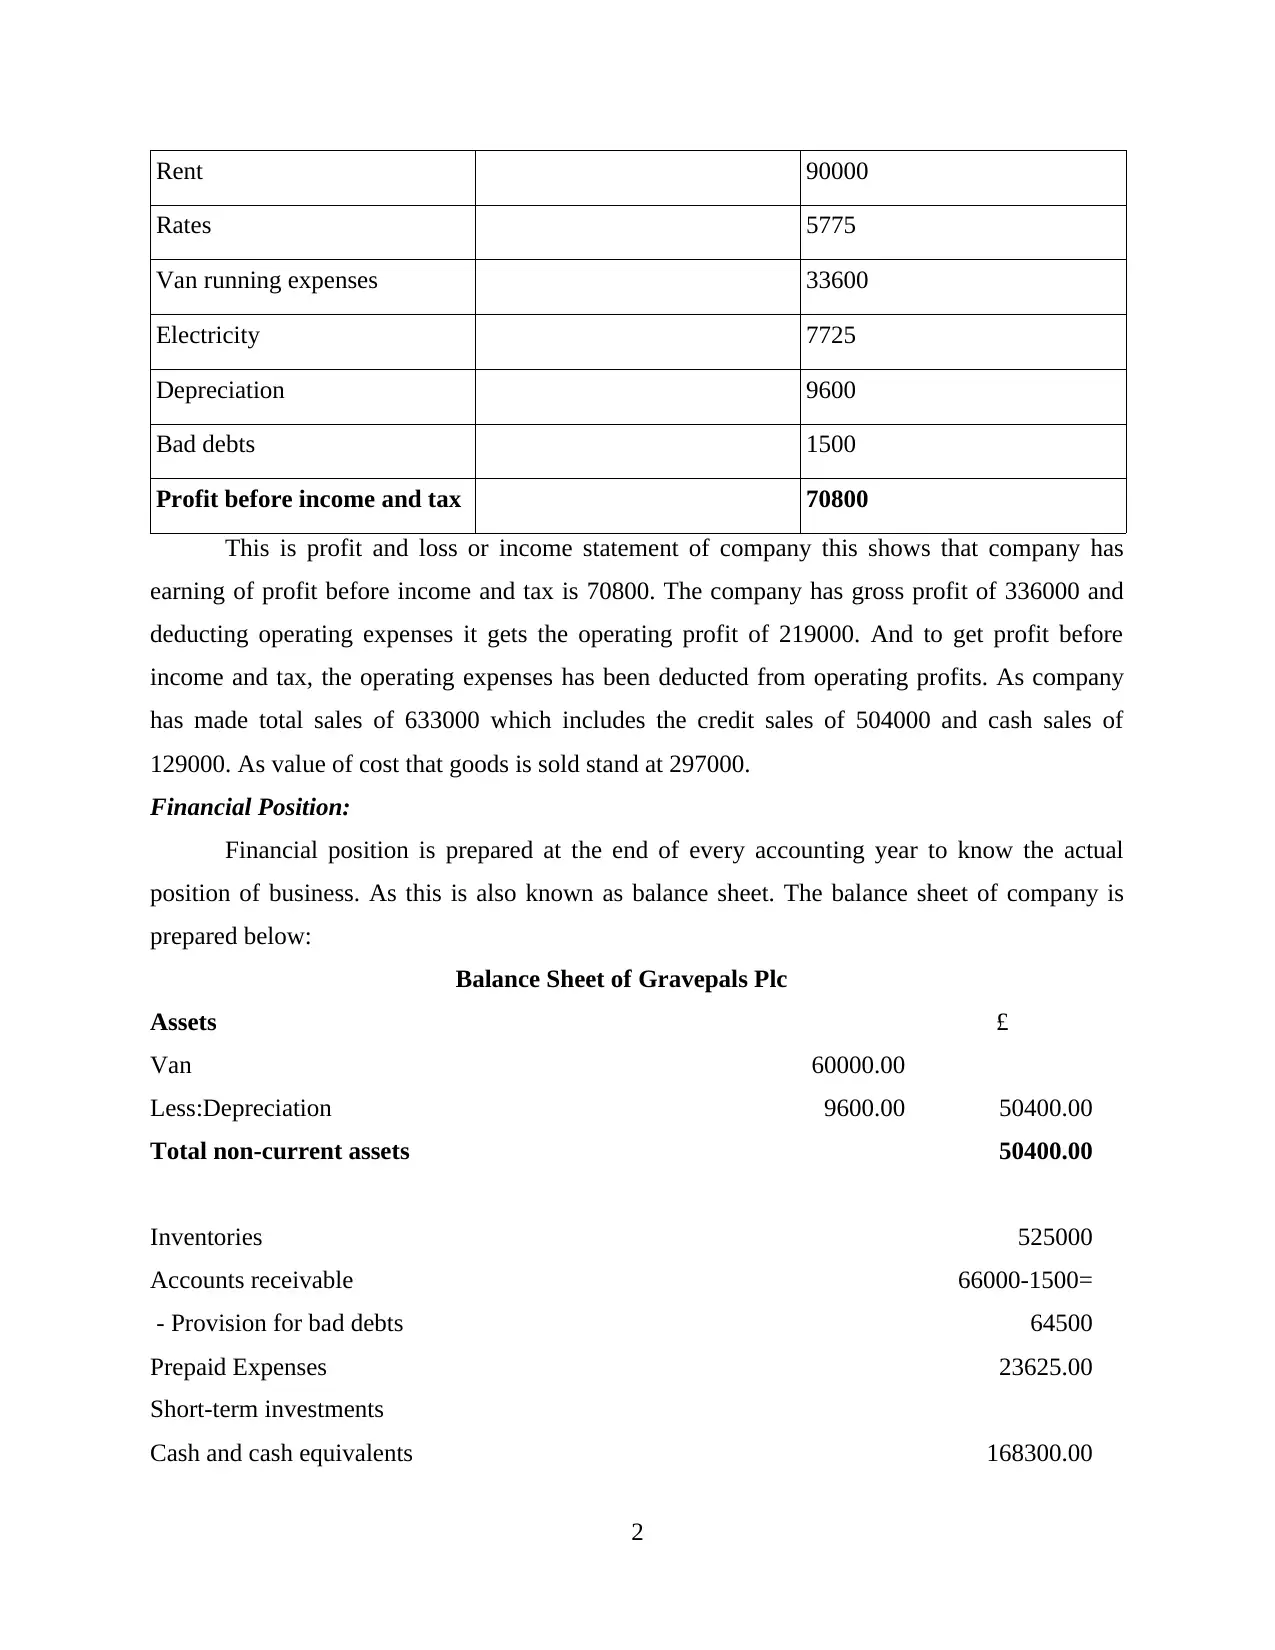
Rent 90000
Rates 5775
Van running expenses 33600
Electricity 7725
Depreciation 9600
Bad debts 1500
Profit before income and tax 70800
This is profit and loss or income statement of company this shows that company has
earning of profit before income and tax is 70800. The company has gross profit of 336000 and
deducting operating expenses it gets the operating profit of 219000. And to get profit before
income and tax, the operating expenses has been deducted from operating profits. As company
has made total sales of 633000 which includes the credit sales of 504000 and cash sales of
129000. As value of cost that goods is sold stand at 297000.
Financial Position:
Financial position is prepared at the end of every accounting year to know the actual
position of business. As this is also known as balance sheet. The balance sheet of company is
prepared below:
Balance Sheet of Gravepals Plc
Assets £
Van 60000.00
Less:Depreciation 9600.00 50400.00
Total non-current assets 50400.00
Inventories 525000
Accounts receivable
- Provision for bad debts
66000-1500=
64500
Prepaid Expenses 23625.00
Short-term investments
Cash and cash equivalents 168300.00
2
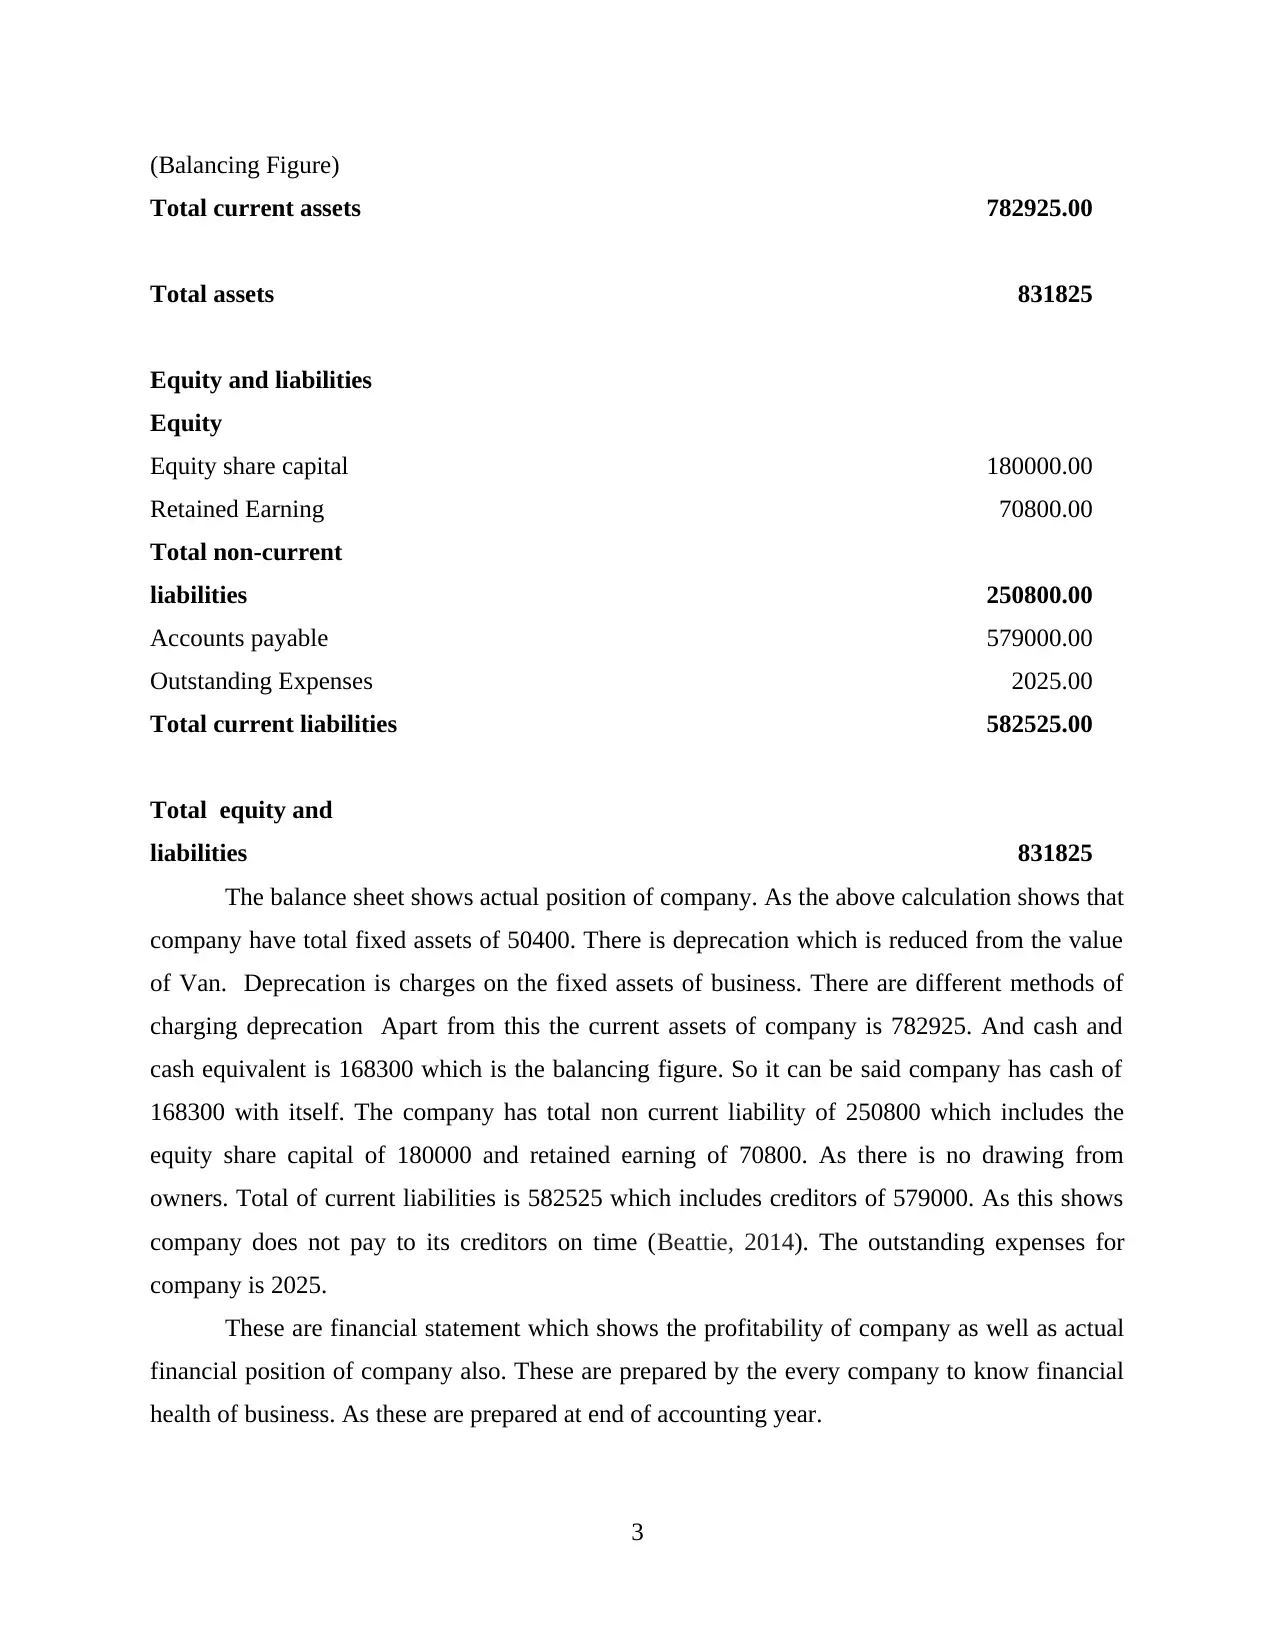
(Balancing Figure)
Total current assets 782925.00
Total assets 831825
Equity and liabilities
Equity
Equity share capital 180000.00
Retained Earning 70800.00
Total non-current
liabilities 250800.00
Accounts payable 579000.00
Outstanding Expenses 2025.00
Total current liabilities 582525.00
Total equity and
liabilities 831825
The balance sheet shows actual position of company. As the above calculation shows that
company have total fixed assets of 50400. There is deprecation which is reduced from the value
of Van. Deprecation is charges on the fixed assets of business. There are different methods of
charging deprecation Apart from this the current assets of company is 782925. And cash and
cash equivalent is 168300 which is the balancing figure. So it can be said company has cash of
168300 with itself. The company has total non current liability of 250800 which includes the
equity share capital of 180000 and retained earning of 70800. As there is no drawing from
owners. Total of current liabilities is 582525 which includes creditors of 579000. As this shows
company does not pay to its creditors on time (Beattie, 2014). The outstanding expenses for
company is 2025.
These are financial statement which shows the profitability of company as well as actual
financial position of company also. These are prepared by the every company to know financial
health of business. As these are prepared at end of accounting year.
3
⊘ This is a preview!⊘
Do you want full access?
Subscribe today to unlock all pages.
Trusted by 1+ million students worldwide
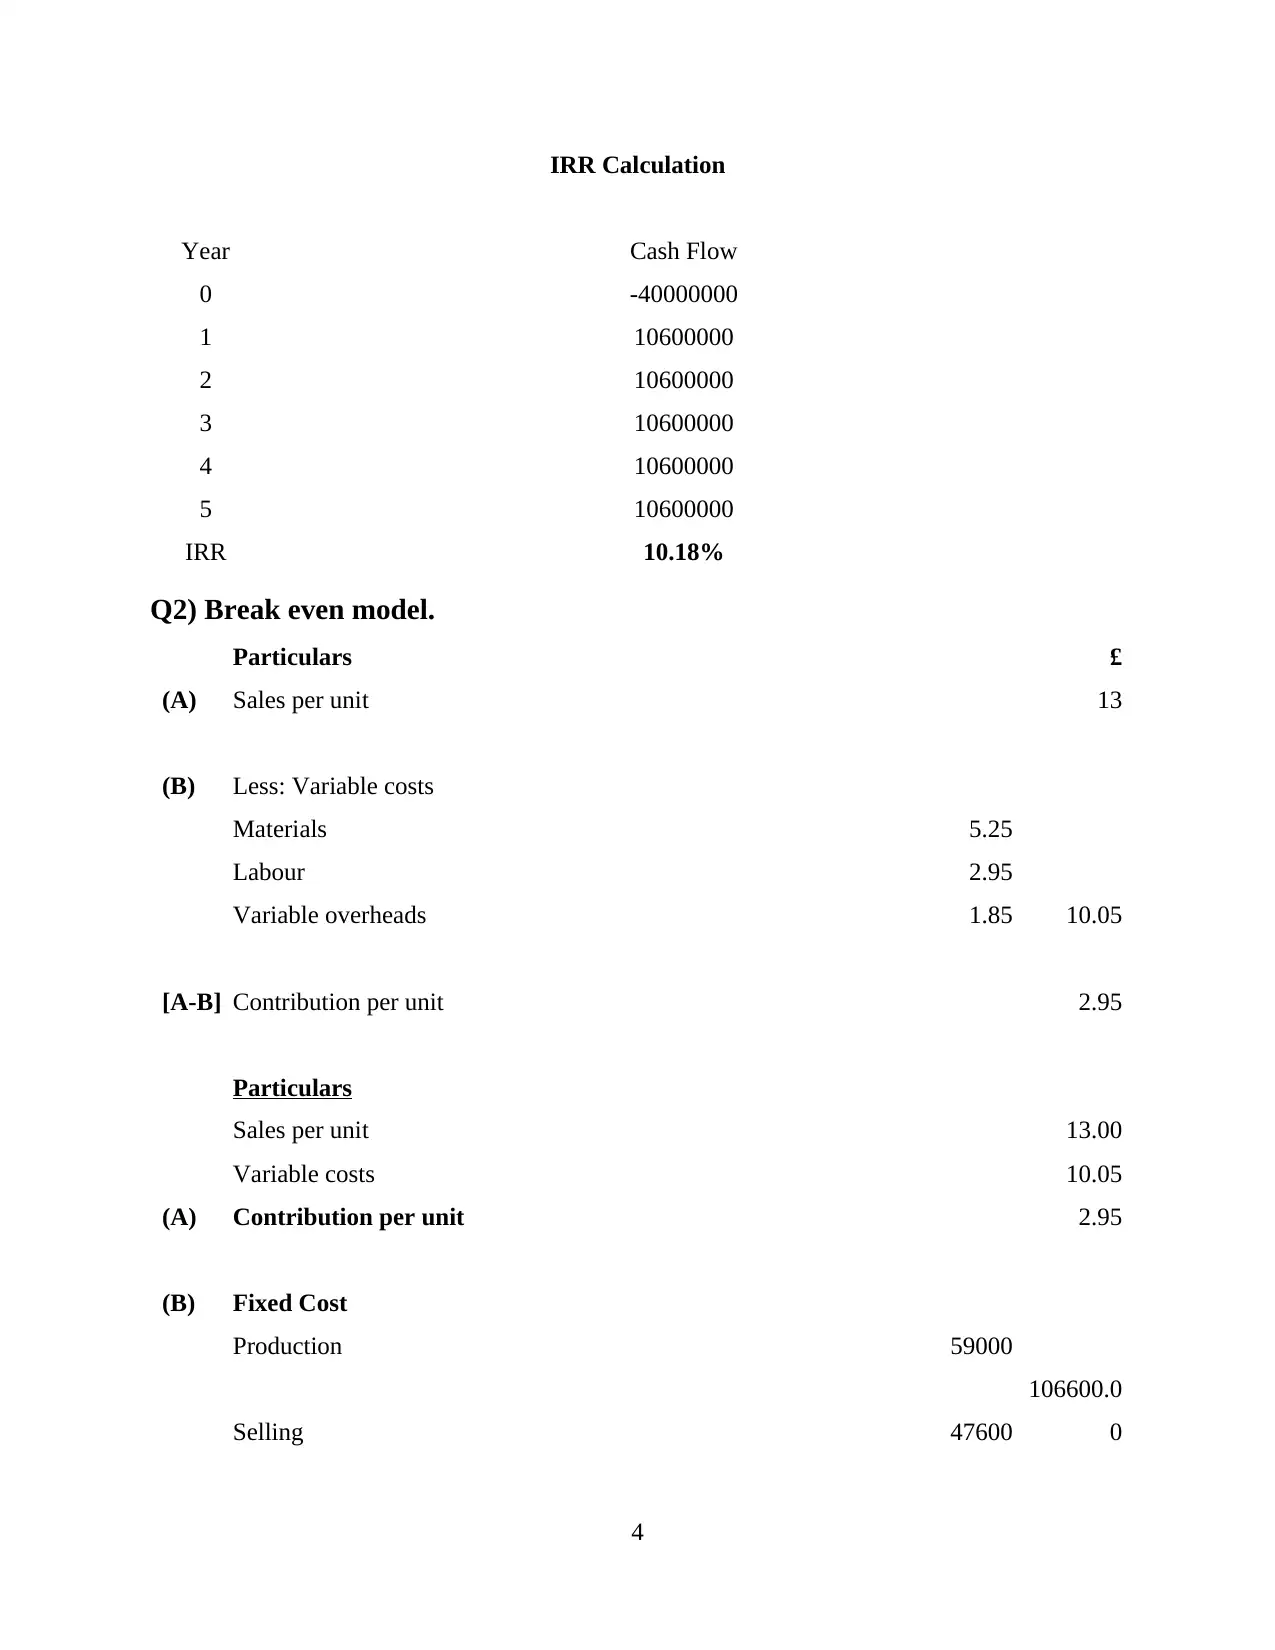
IRR Calculation
Year Cash Flow
0 -40000000
1 10600000
2 10600000
3 10600000
4 10600000
5 10600000
IRR 10.18%
Q2) Break even model.
Particulars £
(A) Sales per unit 13
(B) Less: Variable costs
Materials 5.25
Labour 2.95
Variable overheads 1.85 10.05
[A-B] Contribution per unit 2.95
Particulars
Sales per unit 13.00
Variable costs 10.05
(A) Contribution per unit 2.95
(B) Fixed Cost
Production 59000
Selling 47600
106600.0
0
4
Paraphrase This Document
Need a fresh take? Get an instant paraphrase of this document with our AI Paraphraser
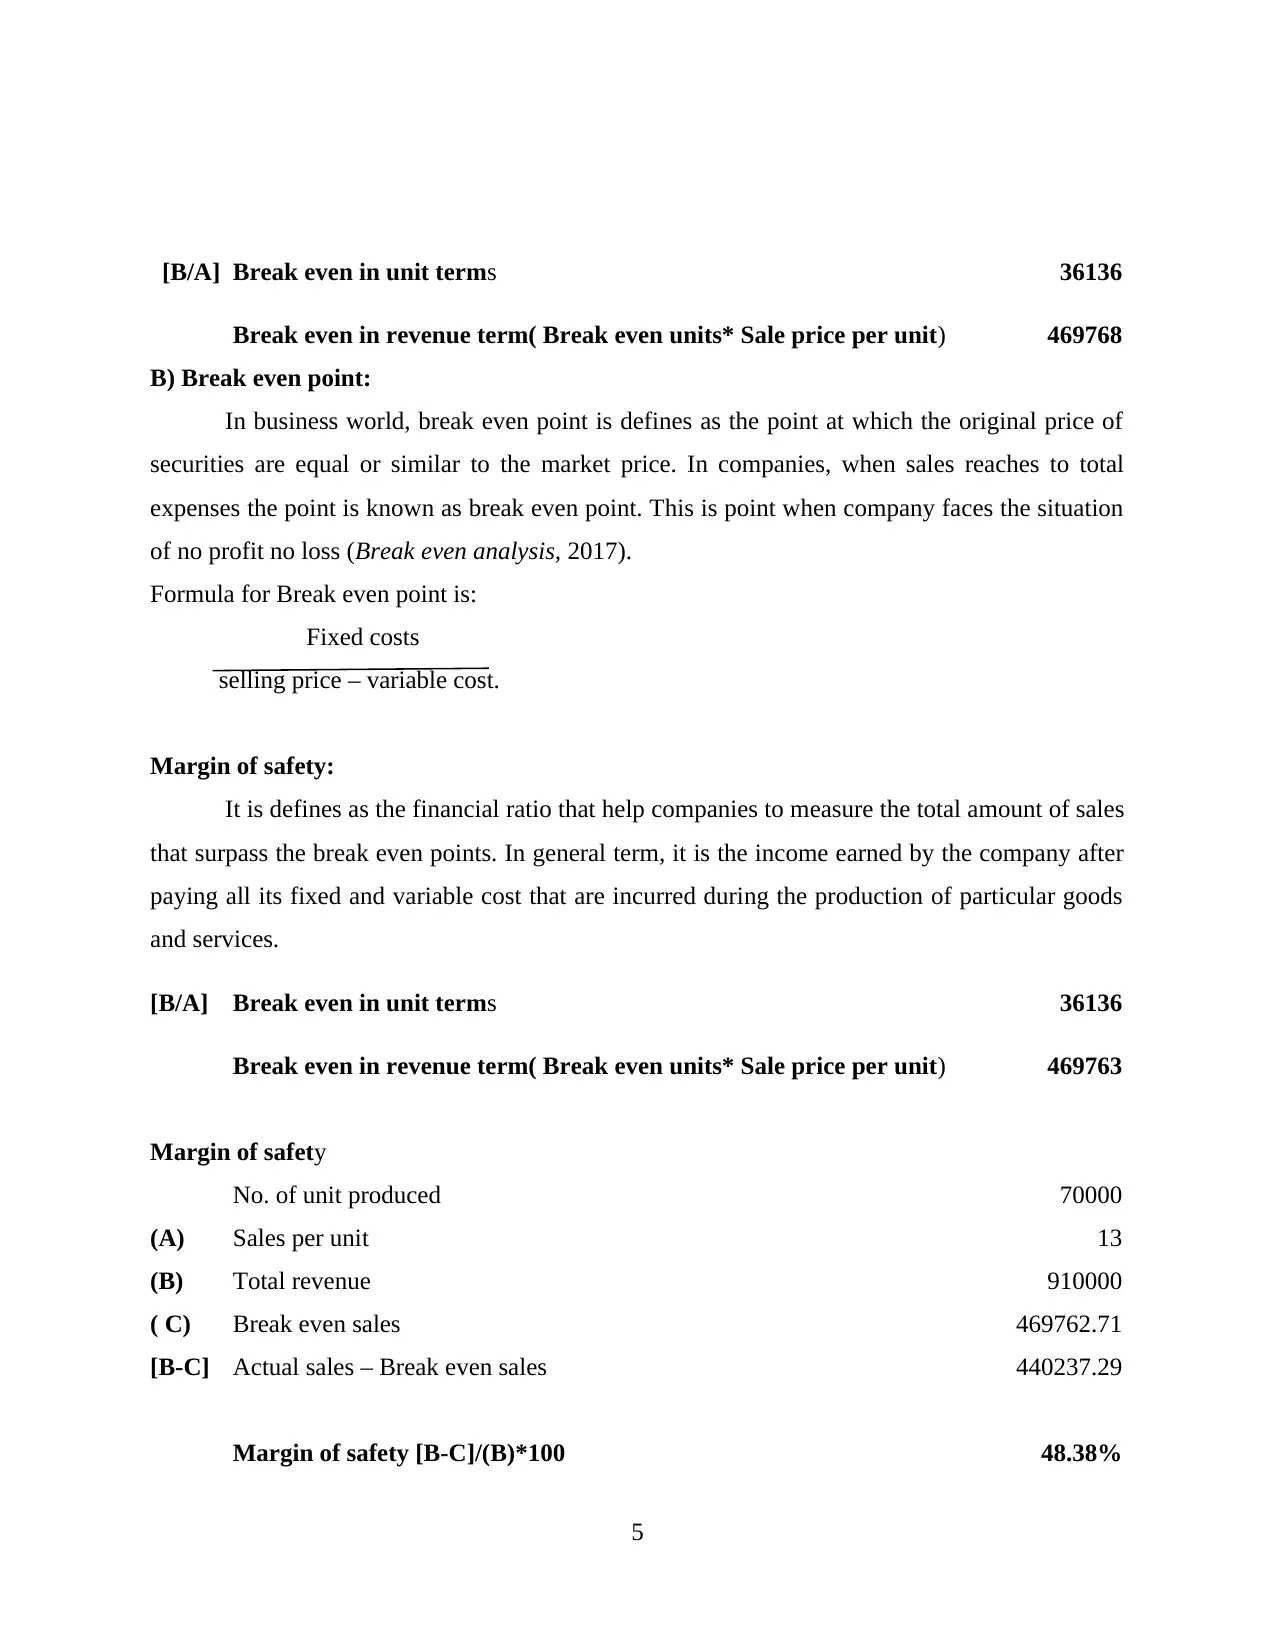
[B/A] Break even in unit terms 36136
Break even in revenue term( Break even units* Sale price per unit) 469768
B) Break even point:
In business world, break even point is defines as the point at which the original price of
securities are equal or similar to the market price. In companies, when sales reaches to total
expenses the point is known as break even point. This is point when company faces the situation
of no profit no loss (Break even analysis, 2017).
Formula for Break even point is:
Fixed costs
selling price – variable cost.
Margin of safety:
It is defines as the financial ratio that help companies to measure the total amount of sales
that surpass the break even points. In general term, it is the income earned by the company after
paying all its fixed and variable cost that are incurred during the production of particular goods
and services.
[B/A] Break even in unit terms 36136
Break even in revenue term( Break even units* Sale price per unit) 469763
Margin of safety
No. of unit produced 70000
(A) Sales per unit 13
(B) Total revenue 910000
( C) Break even sales 469762.71
[B-C] Actual sales – Break even sales 440237.29
Margin of safety [B-C]/(B)*100 48.38%
5
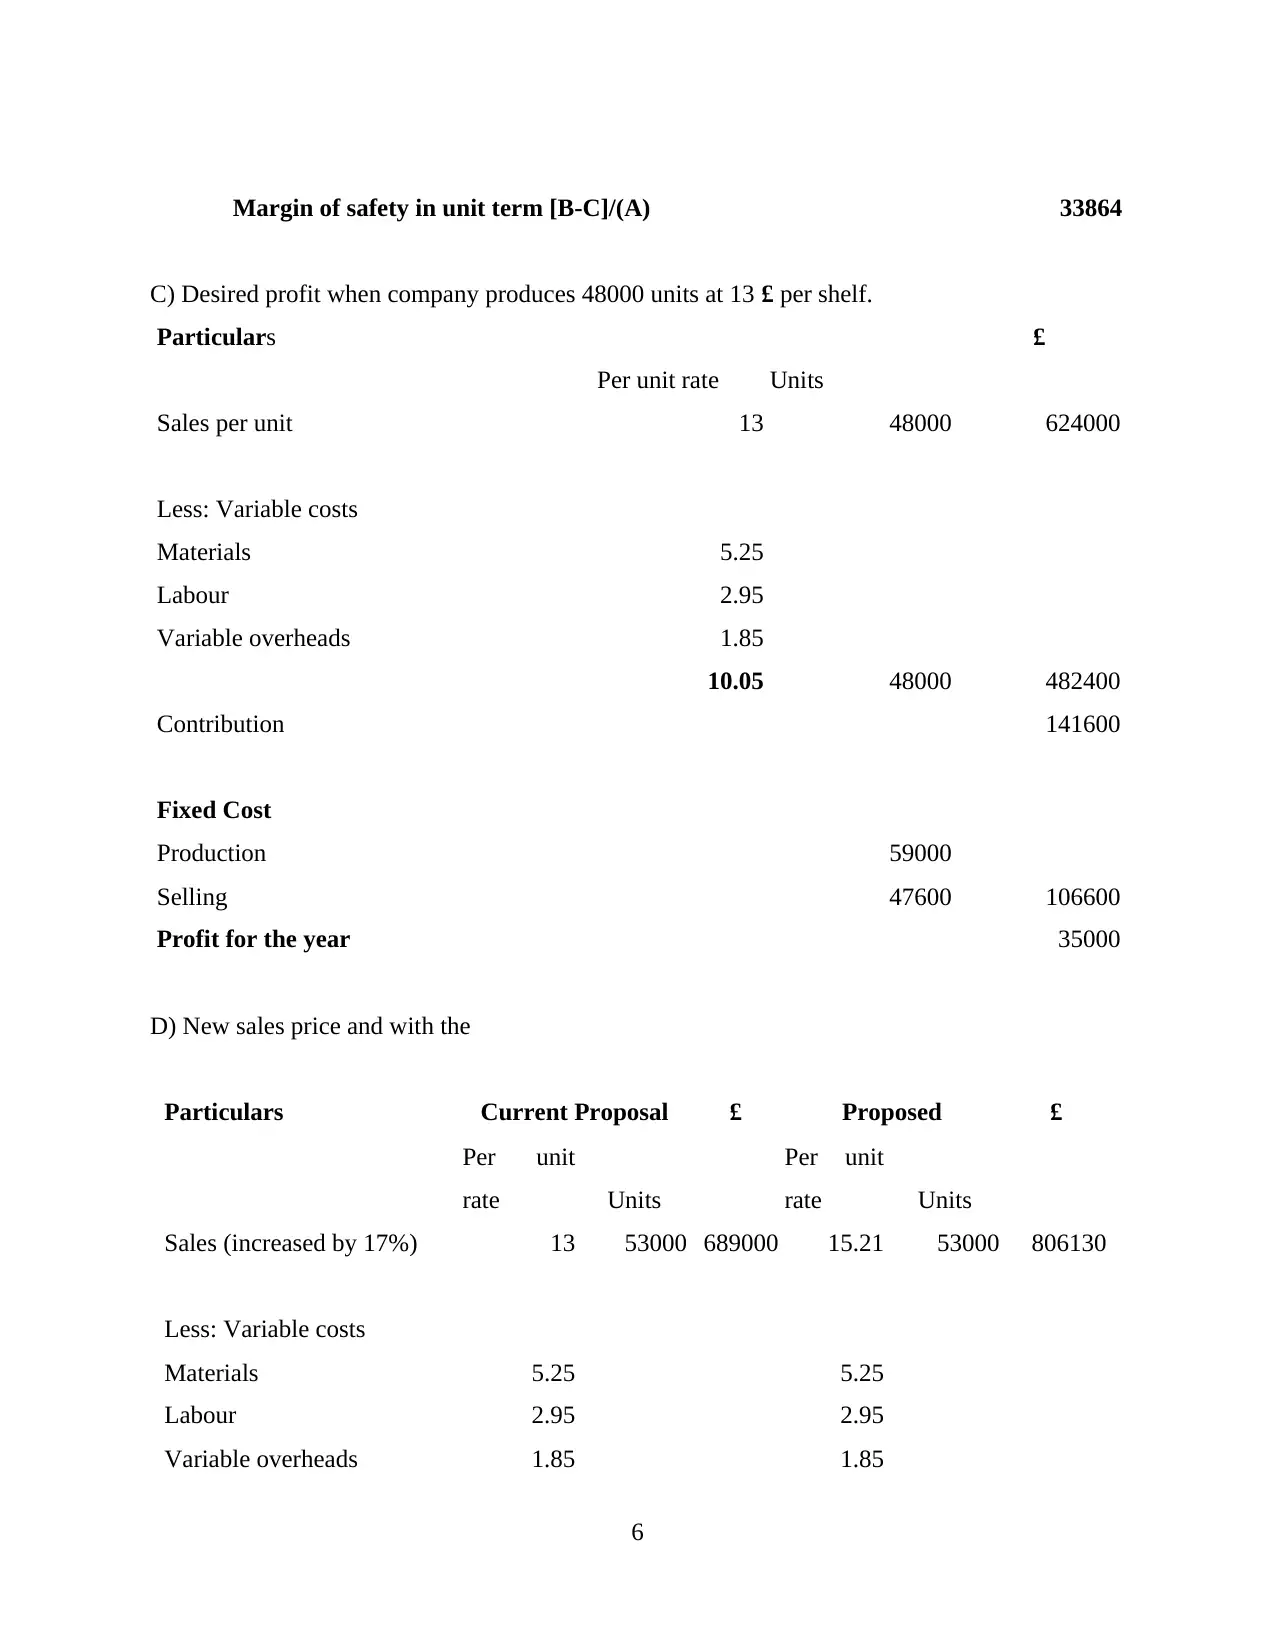
Margin of safety in unit term [B-C]/(A) 33864
C) Desired profit when company produces 48000 units at 13 £ per shelf.
Particulars £
Per unit rate Units
Sales per unit 13 48000 624000
Less: Variable costs
Materials 5.25
Labour 2.95
Variable overheads 1.85
10.05 48000 482400
Contribution 141600
Fixed Cost
Production 59000
Selling 47600 106600
Profit for the year 35000
D) New sales price and with the
Particulars Current Proposal £ Proposed £
Per unit
rate Units
Per unit
rate Units
Sales (increased by 17%) 13 53000 689000 15.21 53000 806130
Less: Variable costs
Materials 5.25 5.25
Labour 2.95 2.95
Variable overheads 1.85 1.85
6
⊘ This is a preview!⊘
Do you want full access?
Subscribe today to unlock all pages.
Trusted by 1+ million students worldwide
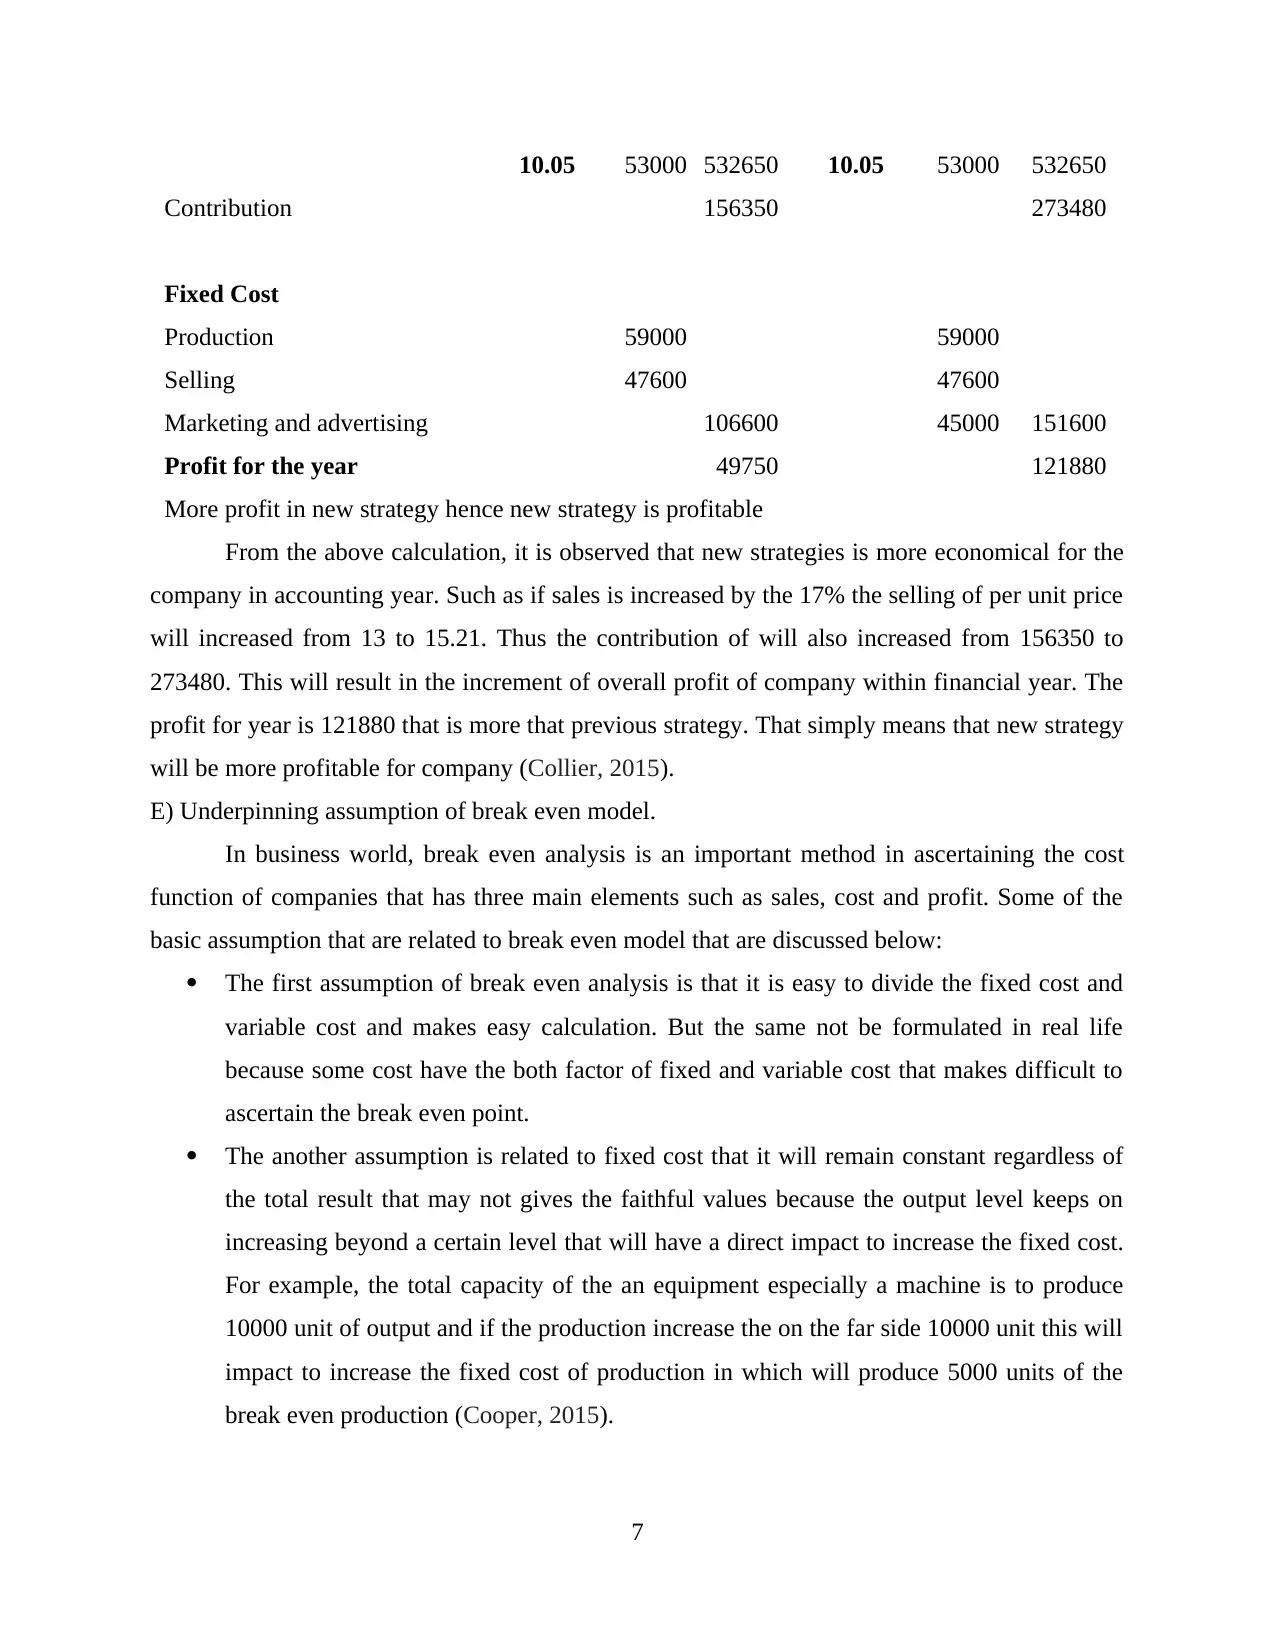
10.05 53000 532650 10.05 53000 532650
Contribution 156350 273480
Fixed Cost
Production 59000 59000
Selling 47600 47600
Marketing and advertising 106600 45000 151600
Profit for the year 49750 121880
More profit in new strategy hence new strategy is profitable
From the above calculation, it is observed that new strategies is more economical for the
company in accounting year. Such as if sales is increased by the 17% the selling of per unit price
will increased from 13 to 15.21. Thus the contribution of will also increased from 156350 to
273480. This will result in the increment of overall profit of company within financial year. The
profit for year is 121880 that is more that previous strategy. That simply means that new strategy
will be more profitable for company (Collier, 2015).
E) Underpinning assumption of break even model.
In business world, break even analysis is an important method in ascertaining the cost
function of companies that has three main elements such as sales, cost and profit. Some of the
basic assumption that are related to break even model that are discussed below:
The first assumption of break even analysis is that it is easy to divide the fixed cost and
variable cost and makes easy calculation. But the same not be formulated in real life
because some cost have the both factor of fixed and variable cost that makes difficult to
ascertain the break even point.
The another assumption is related to fixed cost that it will remain constant regardless of
the total result that may not gives the faithful values because the output level keeps on
increasing beyond a certain level that will have a direct impact to increase the fixed cost.
For example, the total capacity of the an equipment especially a machine is to produce
10000 unit of output and if the production increase the on the far side 10000 unit this will
impact to increase the fixed cost of production in which will produce 5000 units of the
break even production (Cooper, 2015).
7
Paraphrase This Document
Need a fresh take? Get an instant paraphrase of this document with our AI Paraphraser
On the assumption related to Break even analyses is that it totally ignore the concept of
semi variable cost and the price of the goods are assumed to be constant.
Another assumption is that total variable cost will remain unchanged at each level of
production whereas the per unit variable cost keeps on changing as it attend to decrease
with the level of manufacture rises payable to firm reach efficiency in production with
increasing level of outcomes.
One assumption of break even analysis is also related to the selling price that it will
remain unchanged. But it is observed that selling price of any product will not remain
constant as the demand of product keeps on chaining. This result in wrong calculation of
break even as if there is any change in selling price the break even point will also keeps
on changing.
Another assumption if break even model is that there if the unanticipated circumstances
such as earthquake, floods and other factor that can reduce the breakdown in production
of company.
The break even model is used in different types of businesses as it help them to ascertain
the time when the company will going to earn enough profit that will further support to cover
their total expenses and makes a certain profit (Fields, 2016). Some of the basic importance of
break even analysis are described below:
To ascertain the Point of profitability: This help companies to determine the place at
which company is going to earn enough income so that to that expenses are covered and
company could maintain sufficient profit during an accounting year.
To set price of a product and services: This help companies to set the definite price of the
product so that sufficient profit is made by companies in order to overcome its overall
expenses (Gibb, 2016.).
PART C
a. Calculation of payback period, ARR and NPV
A.) Net Present Value:
The net present value is difference between the present value of cash inflows and present
value of cash outflows within a time period. This is used in capital budgeting and investment
planning to analyse the profitability of a projected investment. If there is positive net earning
8
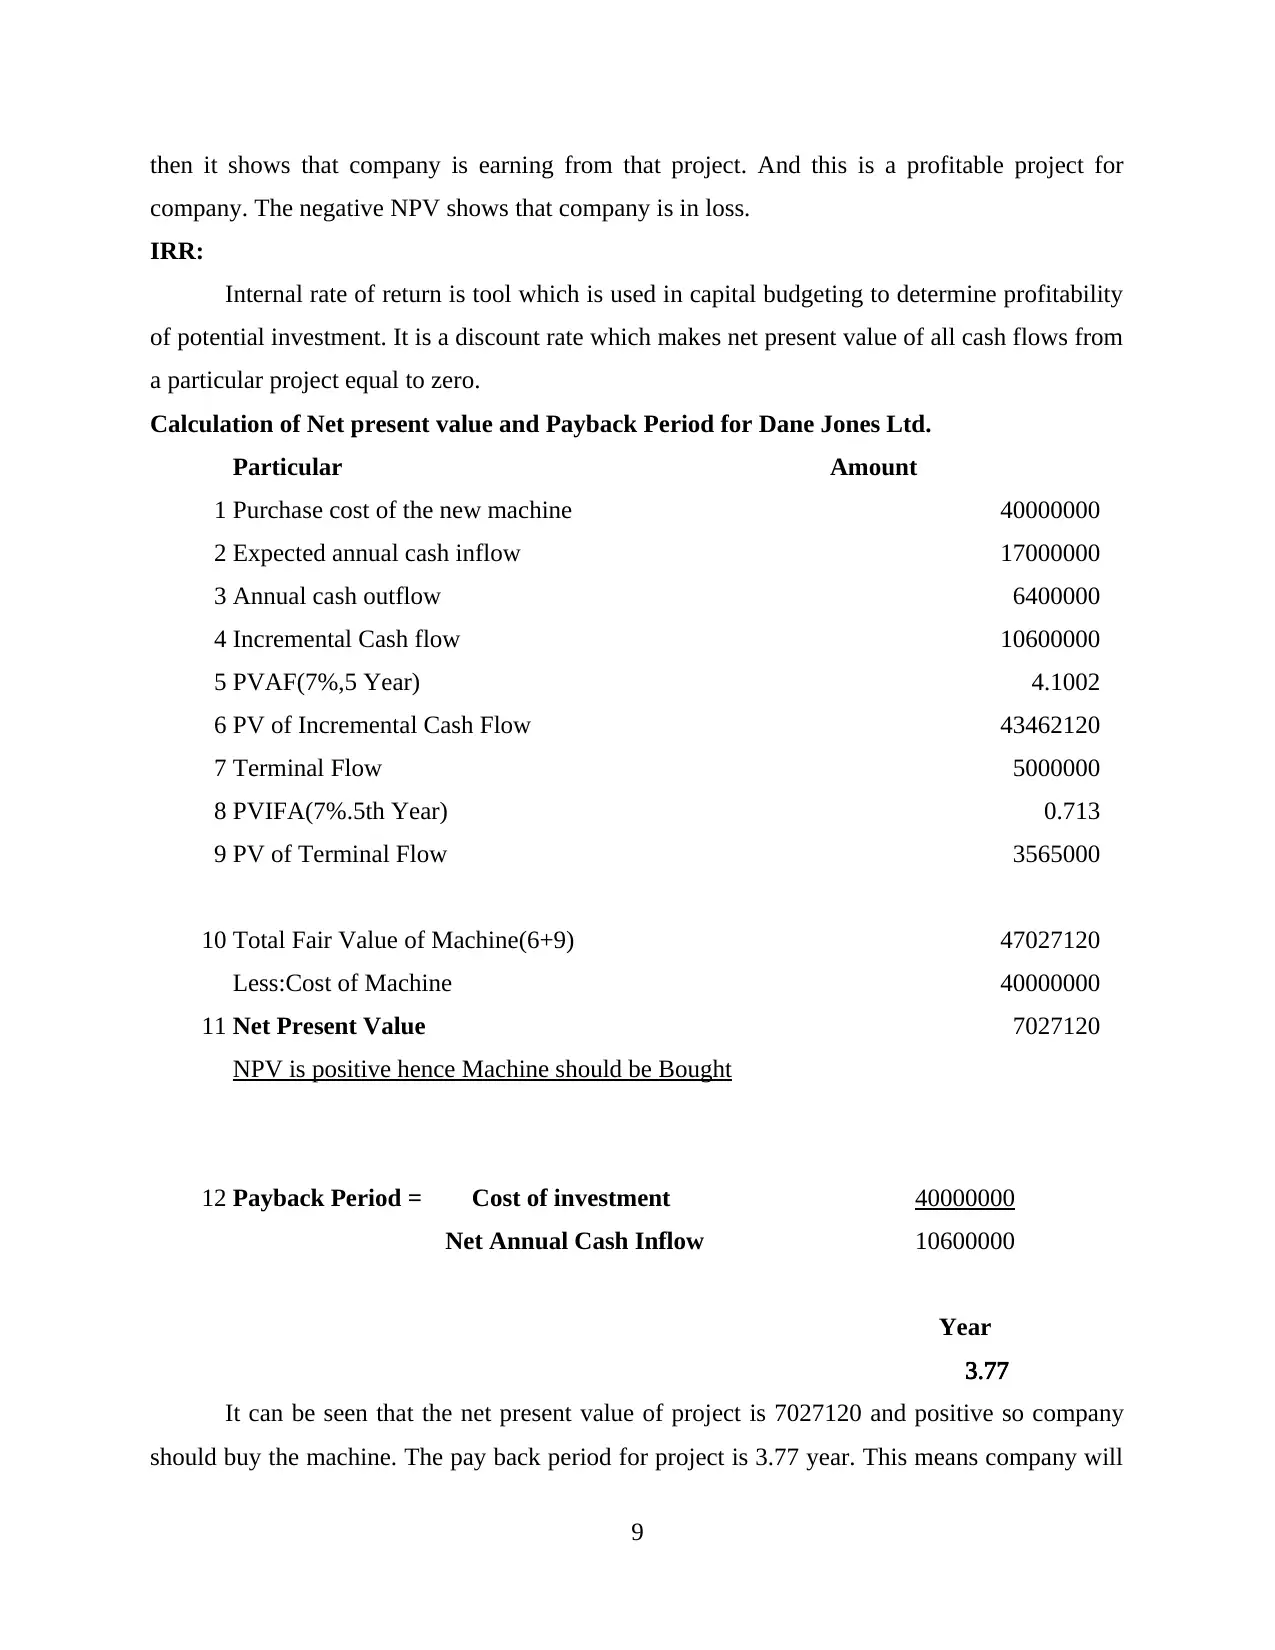
then it shows that company is earning from that project. And this is a profitable project for
company. The negative NPV shows that company is in loss.
IRR:
Internal rate of return is tool which is used in capital budgeting to determine profitability
of potential investment. It is a discount rate which makes net present value of all cash flows from
a particular project equal to zero.
Calculation of Net present value and Payback Period for Dane Jones Ltd.
Particular Amount
1 Purchase cost of the new machine 40000000
2 Expected annual cash inflow 17000000
3 Annual cash outflow 6400000
4 Incremental Cash flow 10600000
5 PVAF(7%,5 Year) 4.1002
6 PV of Incremental Cash Flow 43462120
7 Terminal Flow 5000000
8 PVIFA(7%.5th Year) 0.713
9 PV of Terminal Flow 3565000
10 Total Fair Value of Machine(6+9) 47027120
Less:Cost of Machine 40000000
11 Net Present Value 7027120
NPV is positive hence Machine should be Bought
12 Payback Period = Cost of investment 40000000
Net Annual Cash Inflow 10600000
Year
3.77
It can be seen that the net present value of project is 7027120 and positive so company
should buy the machine. The pay back period for project is 3.77 year. This means company will
9
⊘ This is a preview!⊘
Do you want full access?
Subscribe today to unlock all pages.
Trusted by 1+ million students worldwide
1 out of 17
Related Documents


Your All-in-One AI-Powered Toolkit for Academic Success.
+13062052269
info@desklib.com
Available 24*7 on WhatsApp / Email
![[object Object]](/_next/static/media/star-bottom.7253800d.svg)
Unlock your academic potential
Copyright © 2020–2026 A2Z Services. All Rights Reserved. Developed and managed by ZUCOL.