UGB163 Accounting and Finance: Financial Performance Analysis Report

Verified

Added on  2023/02/13

|25
|4329
|78
Homework Assignment
AI Summary
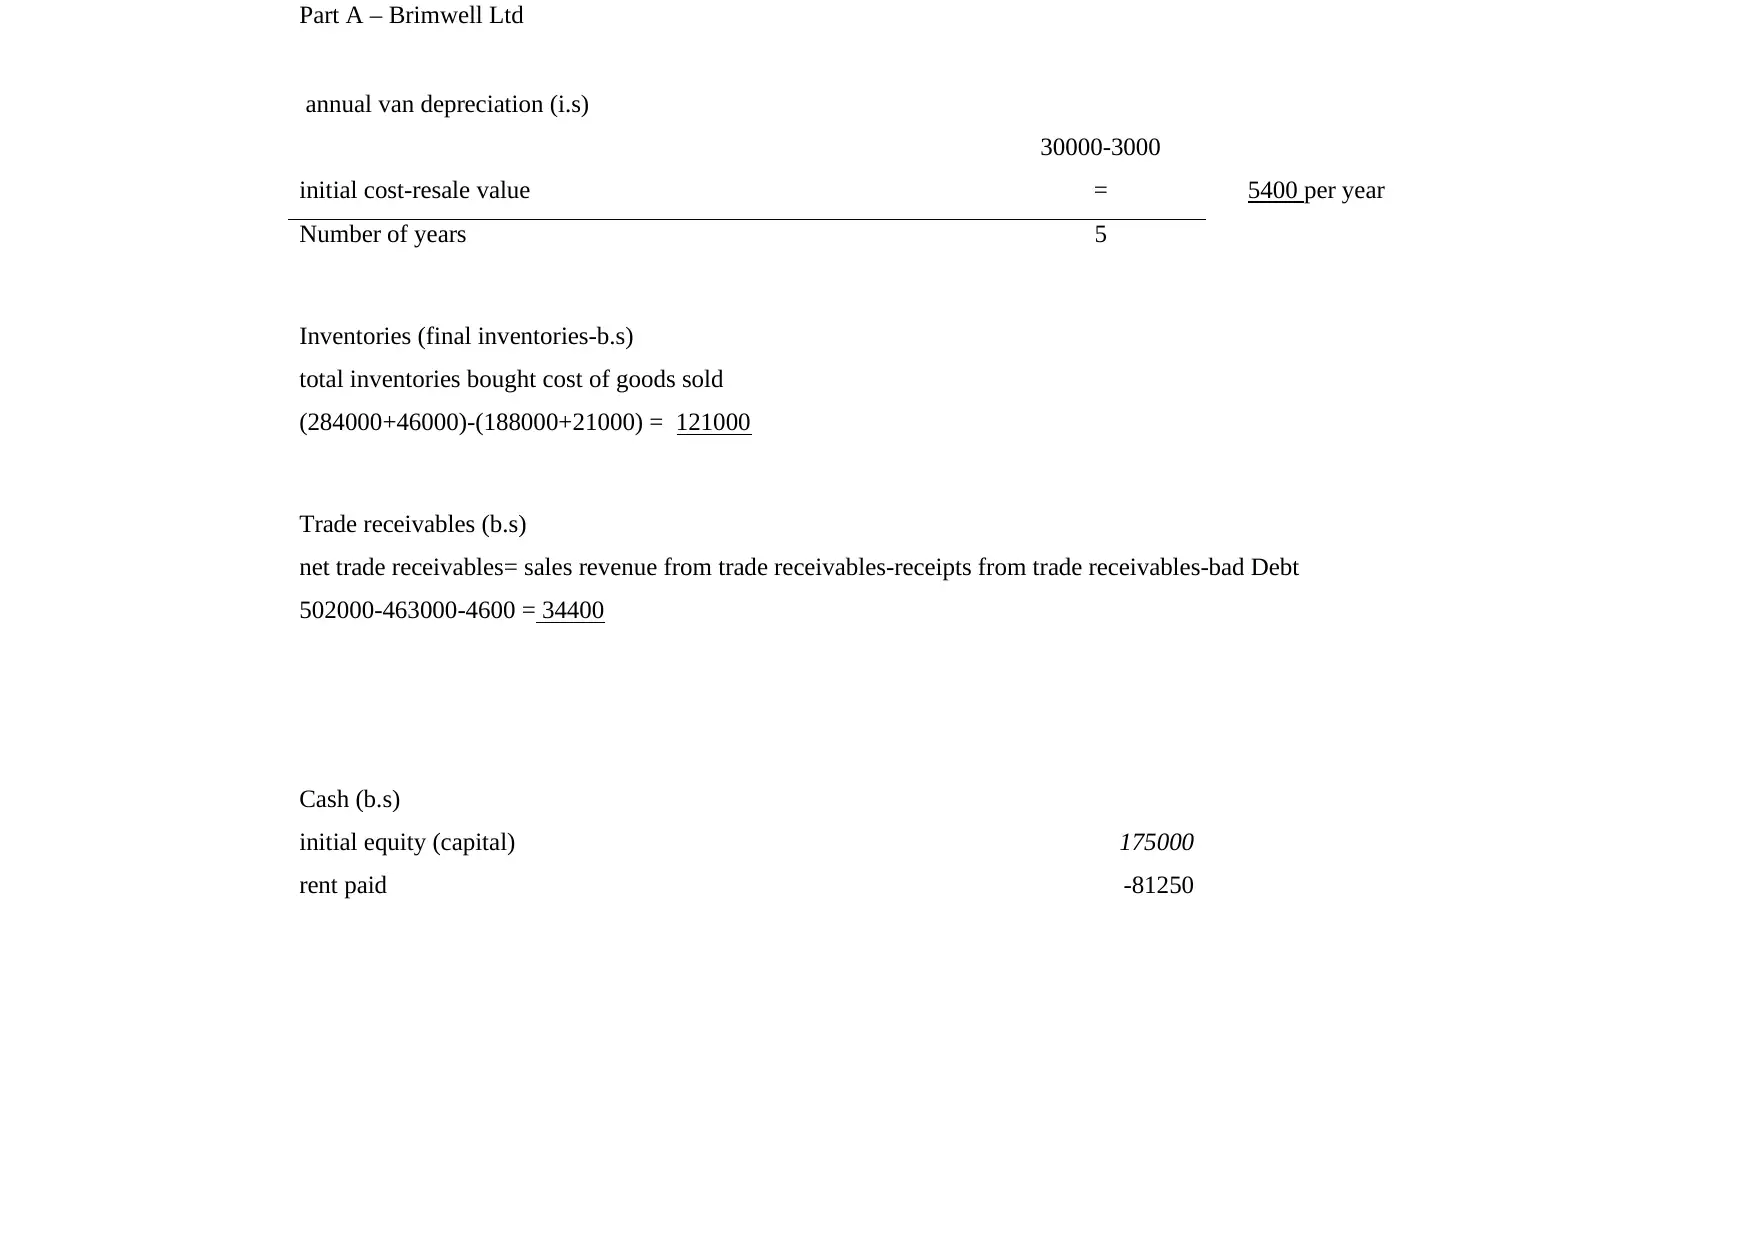
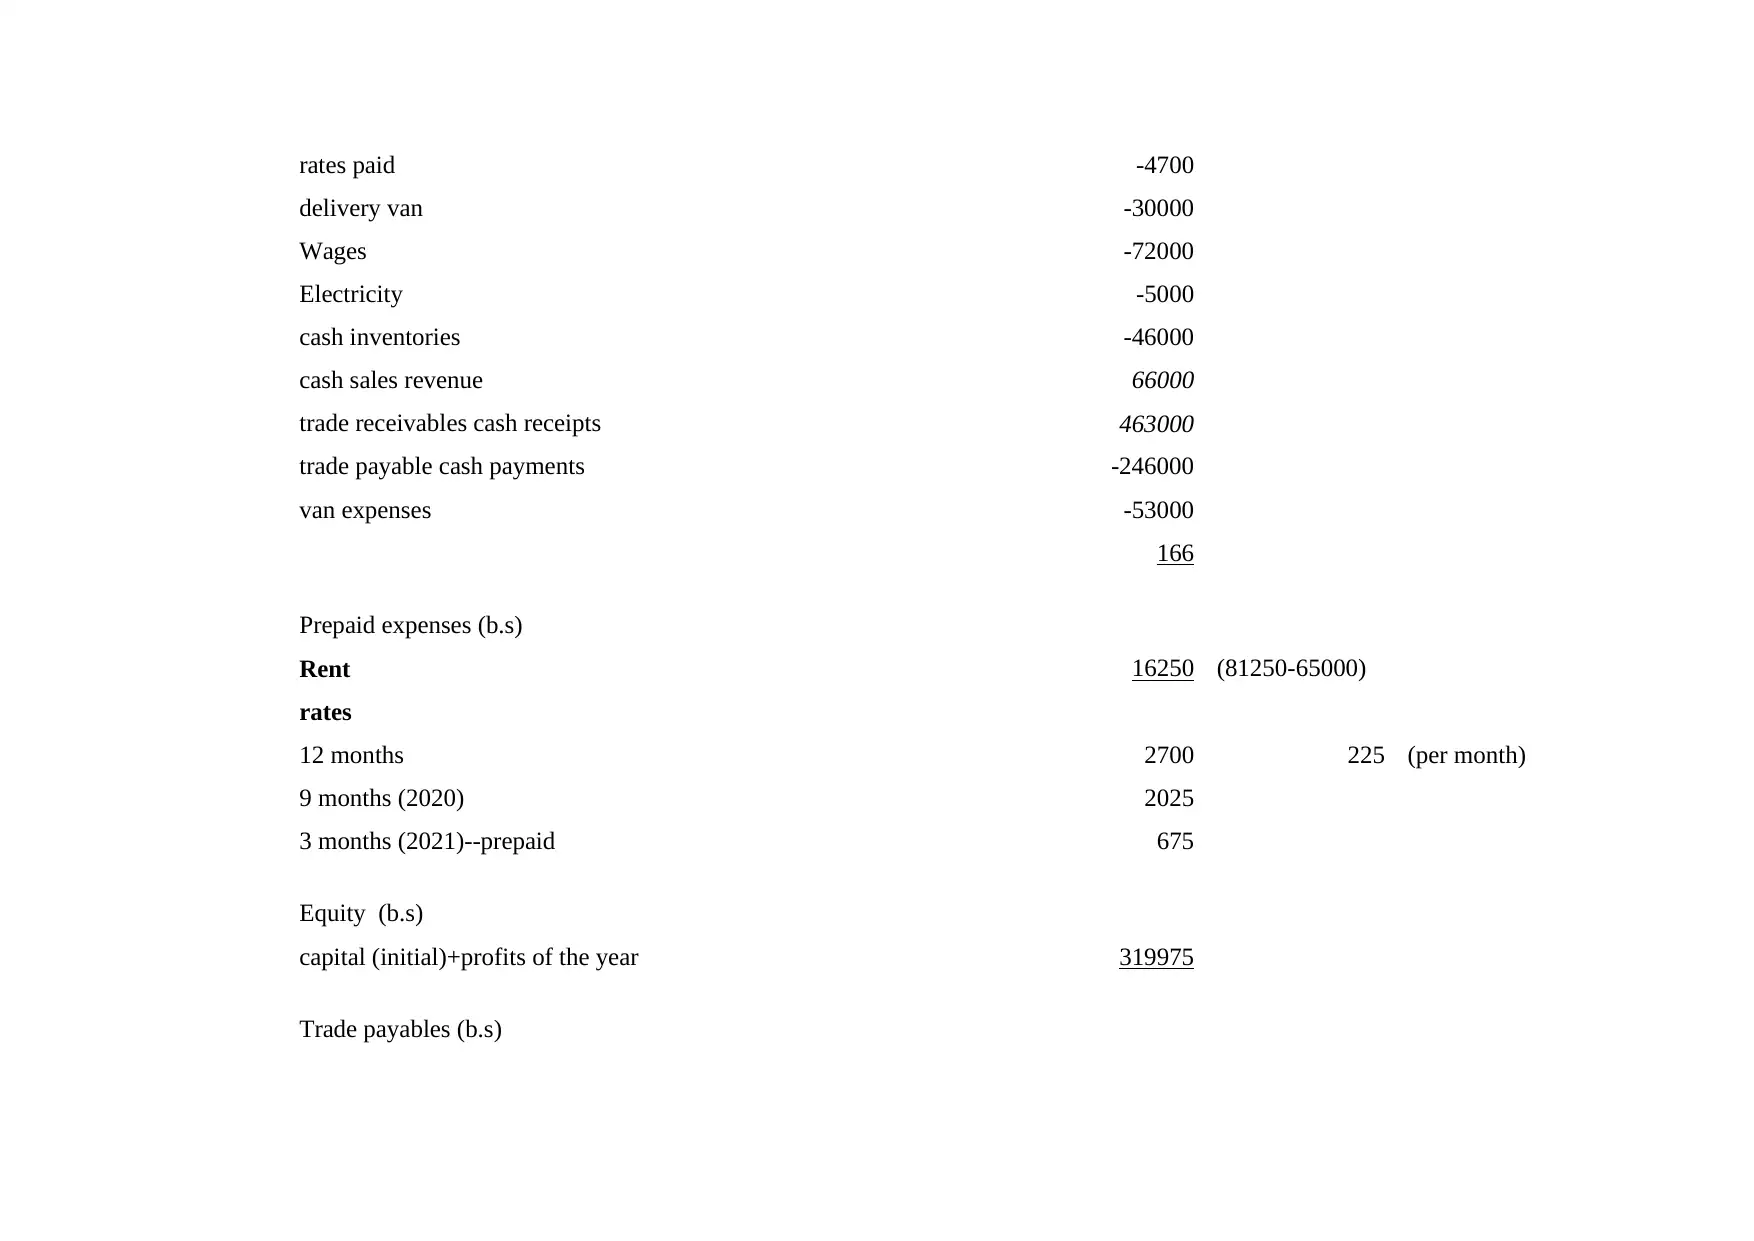
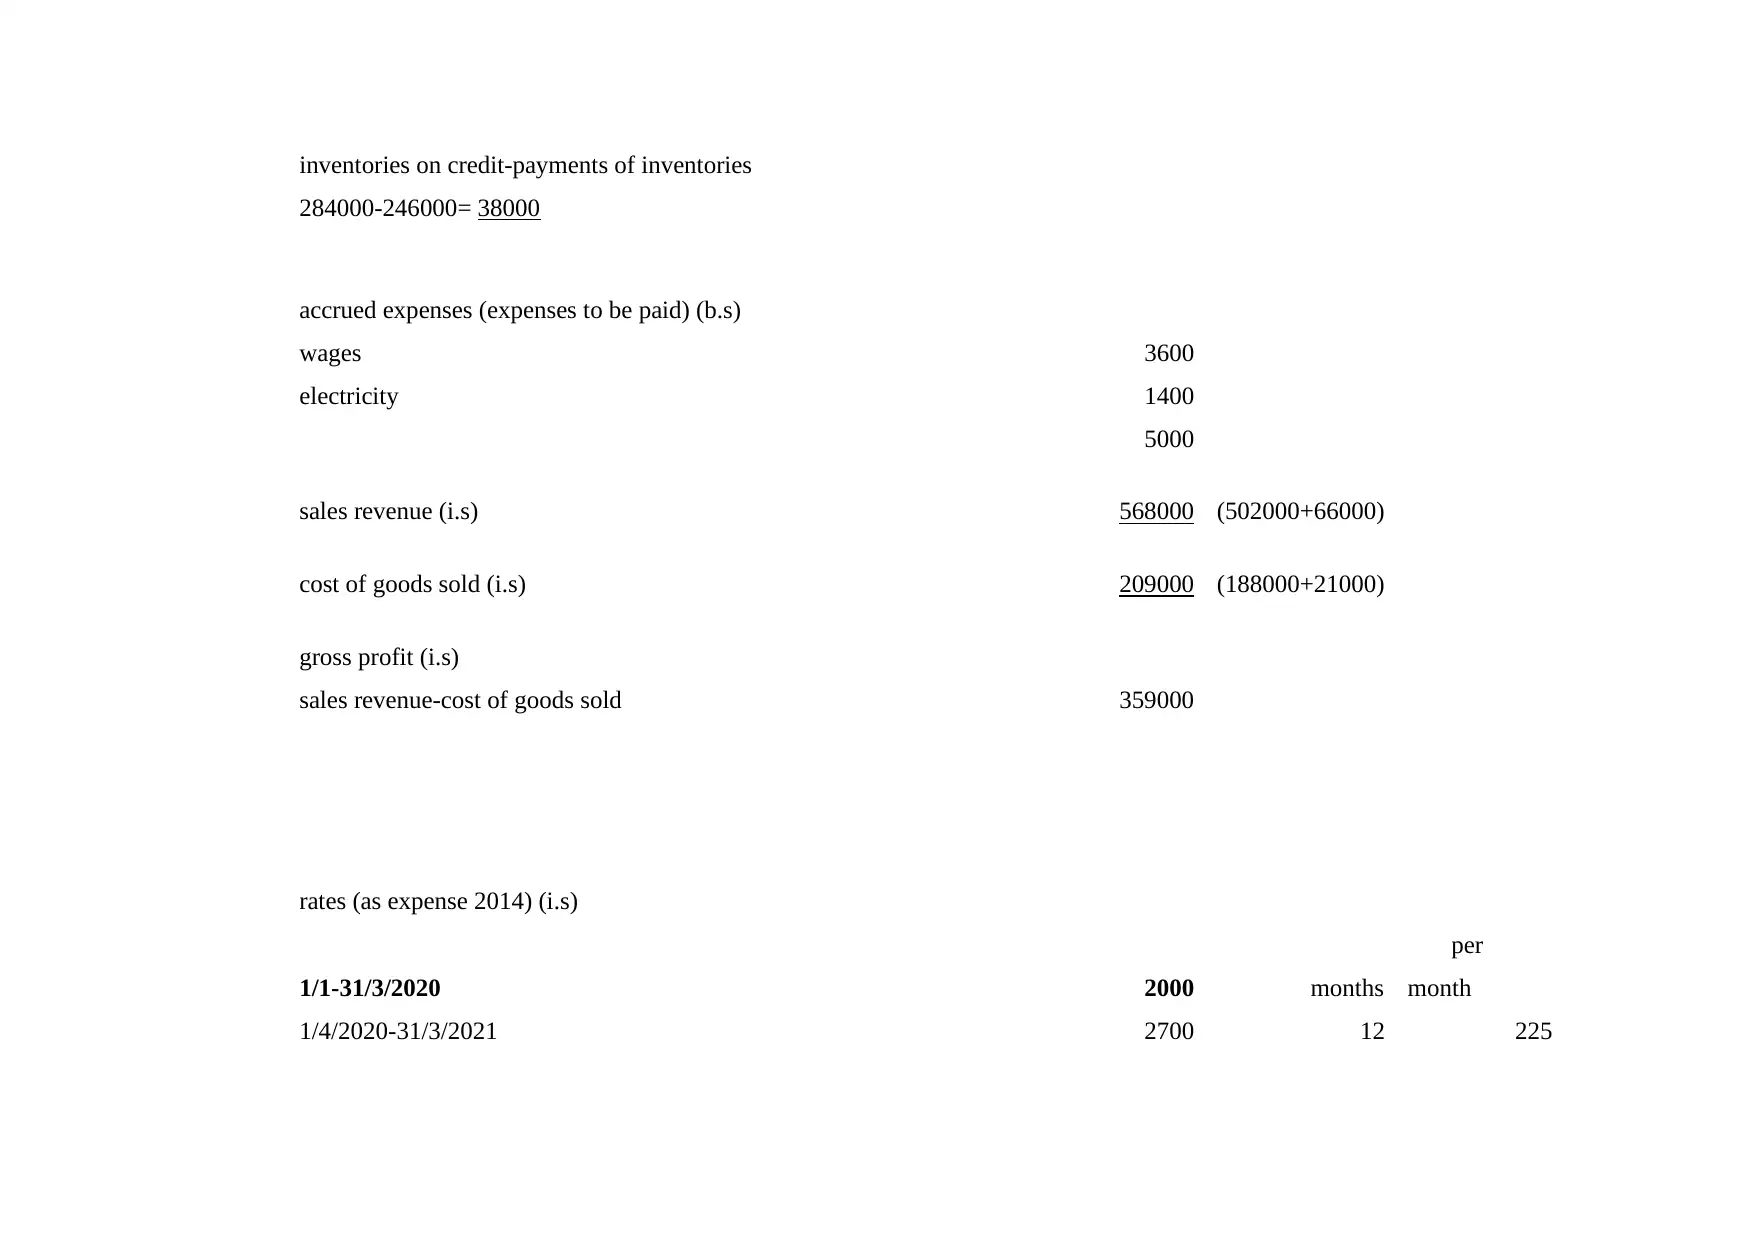
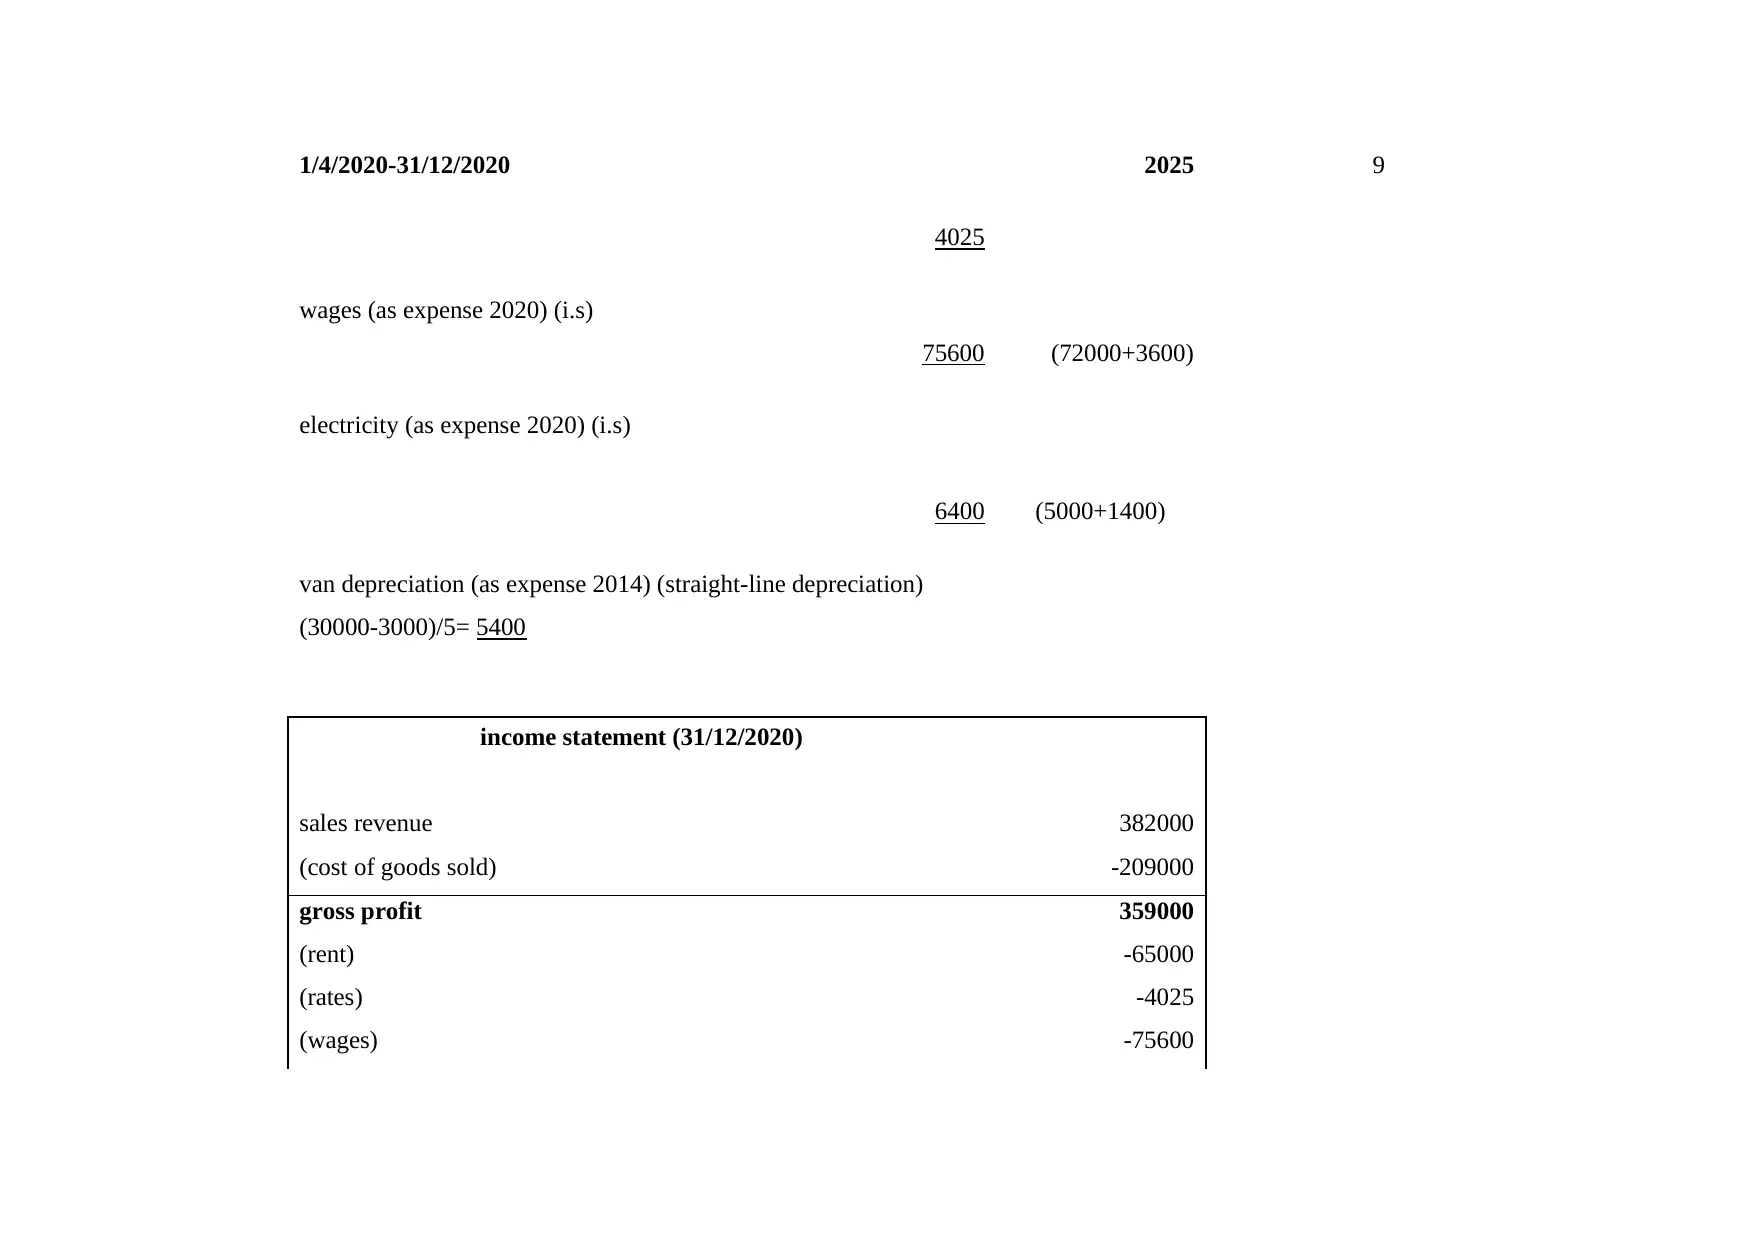
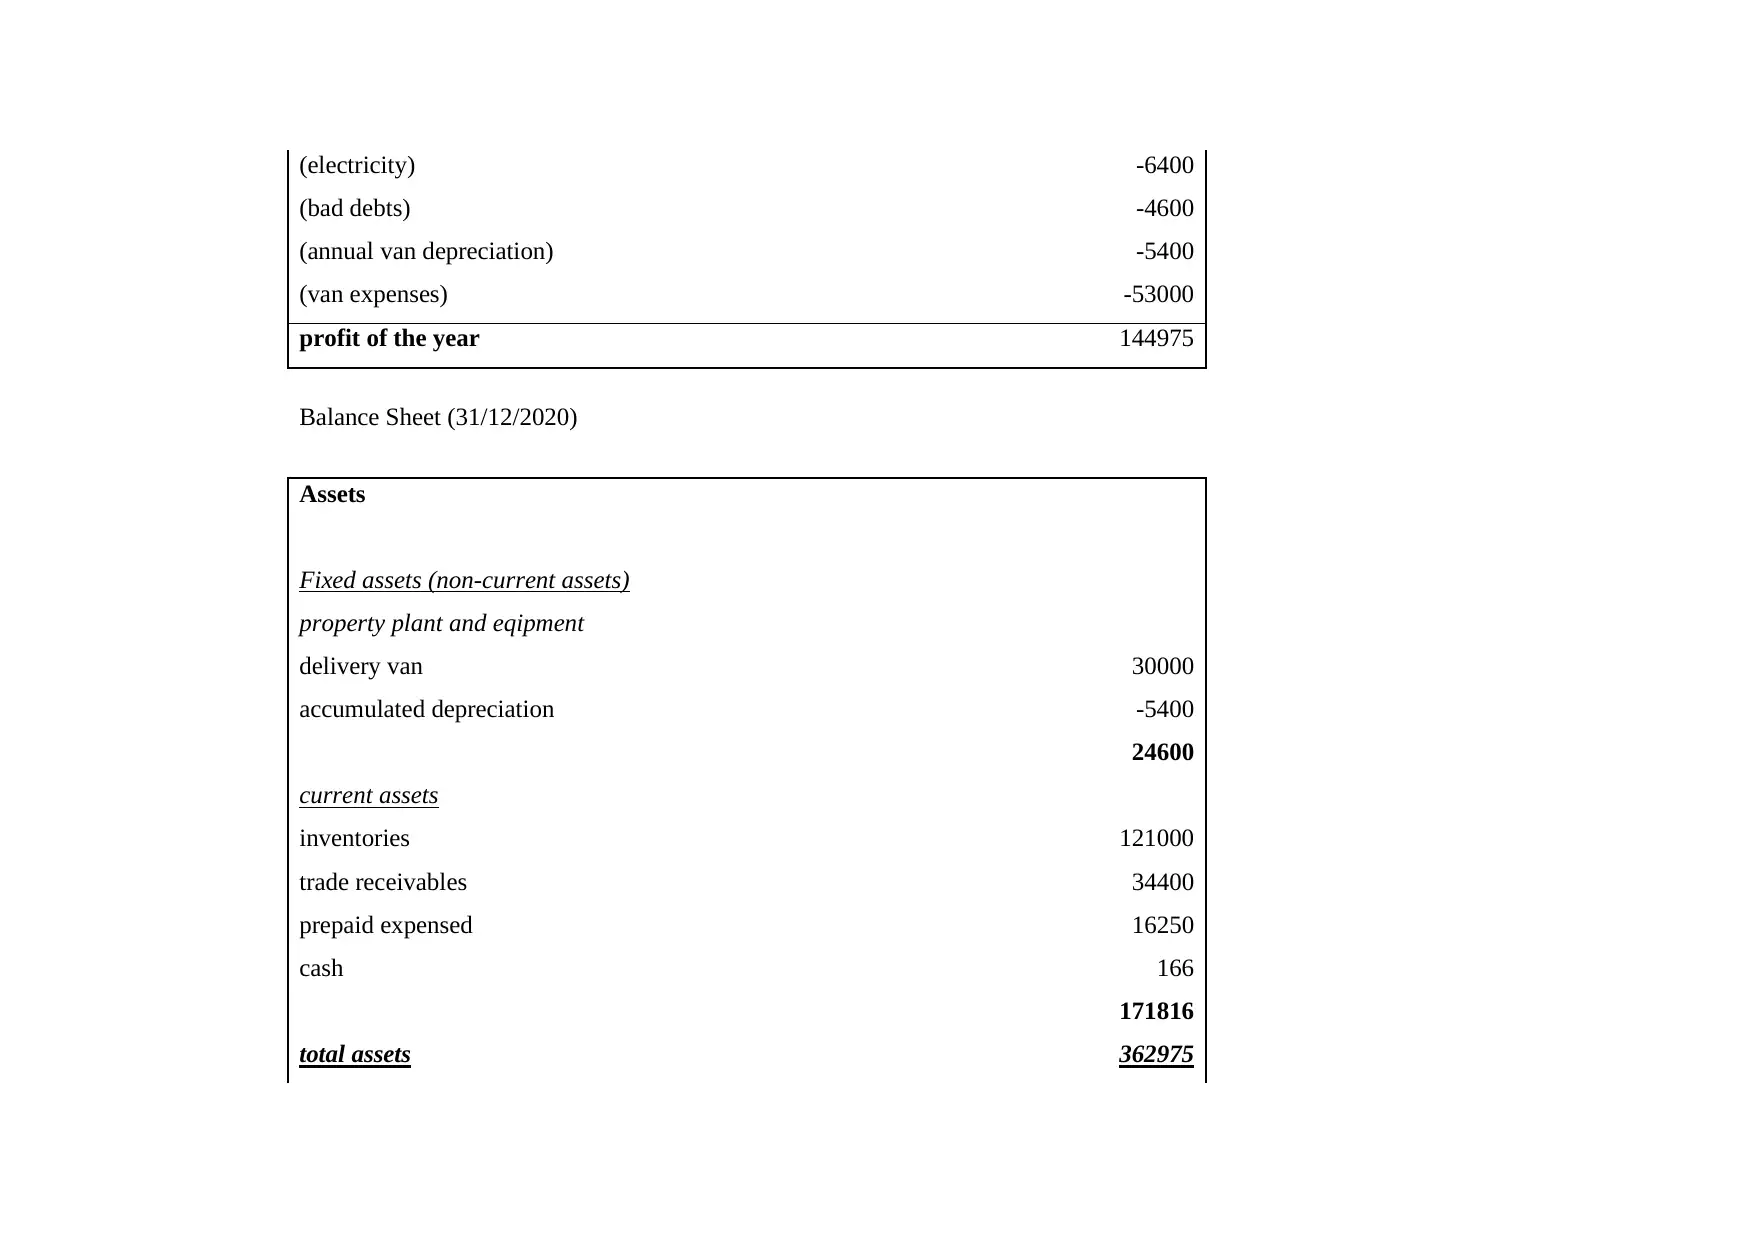
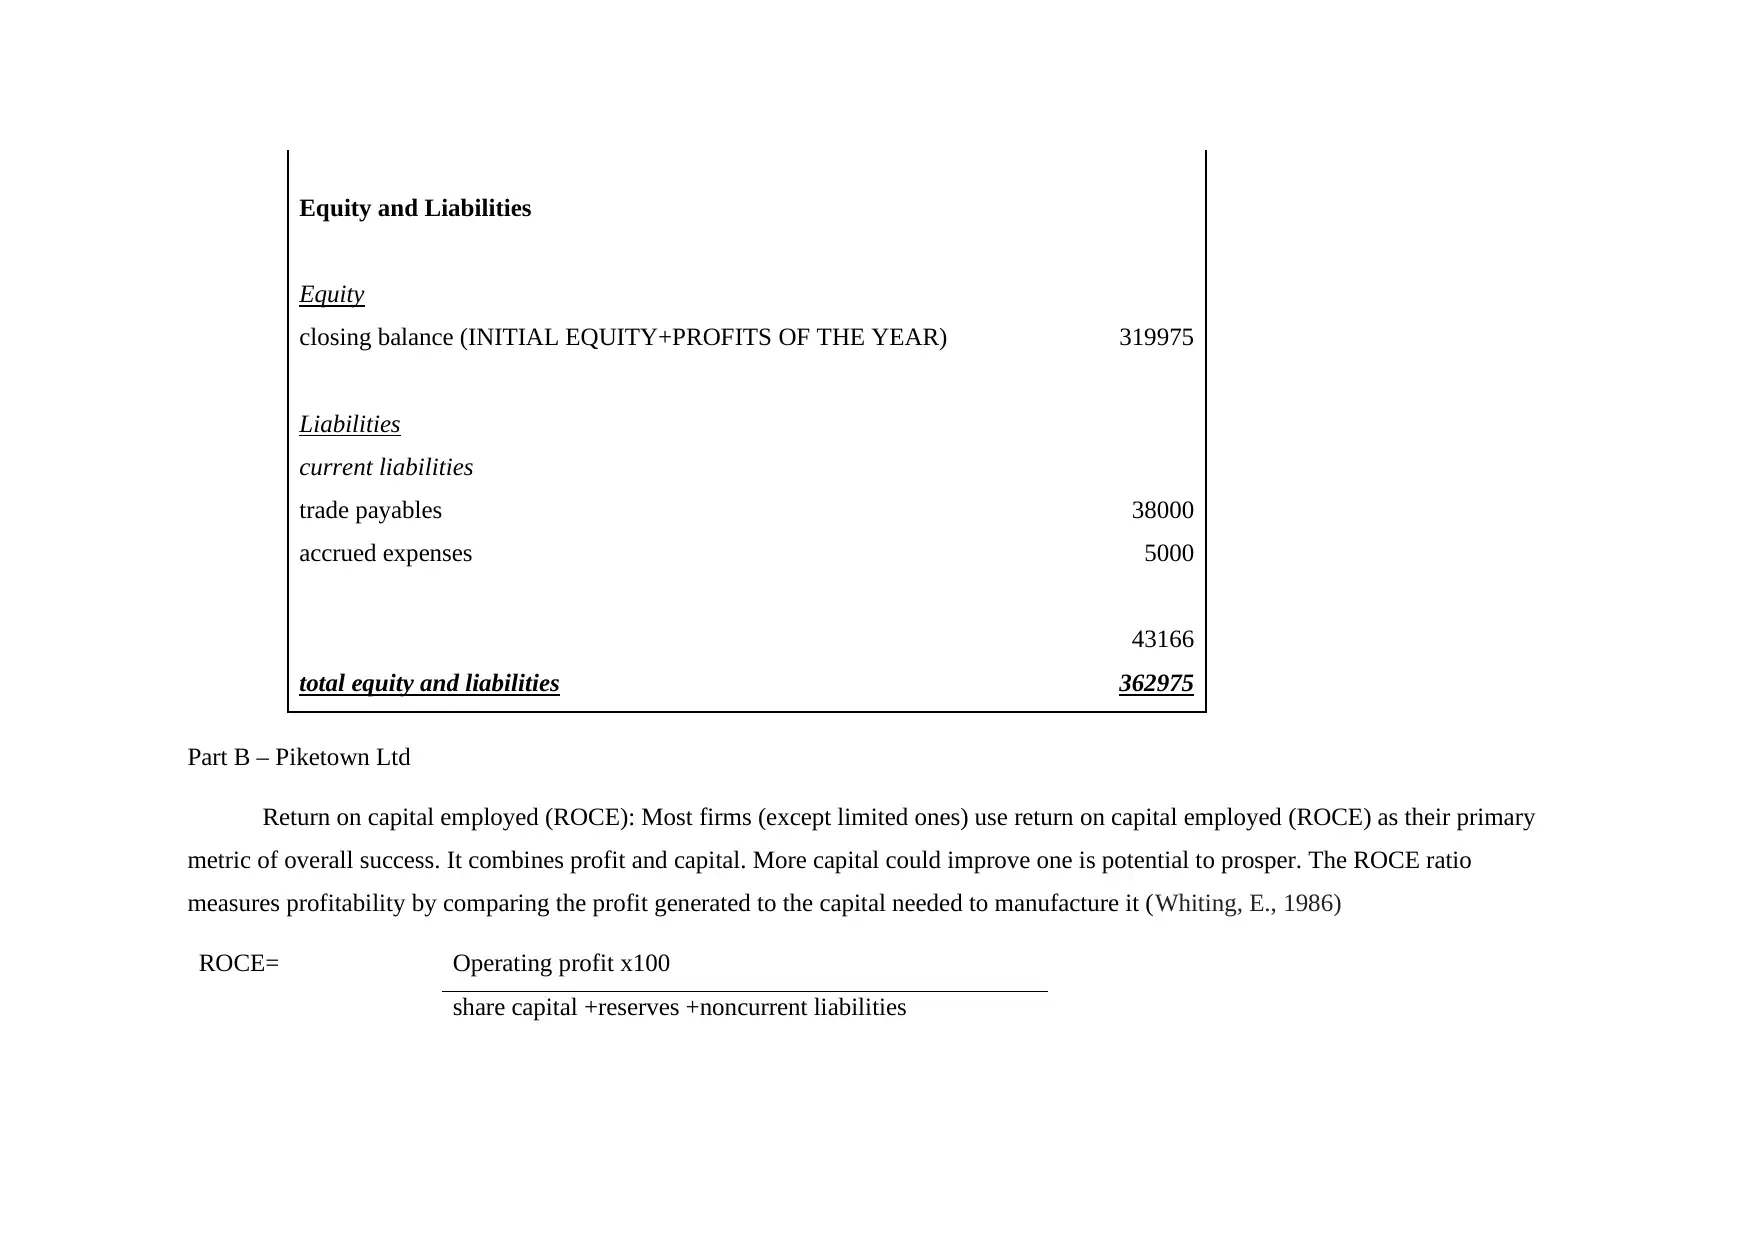
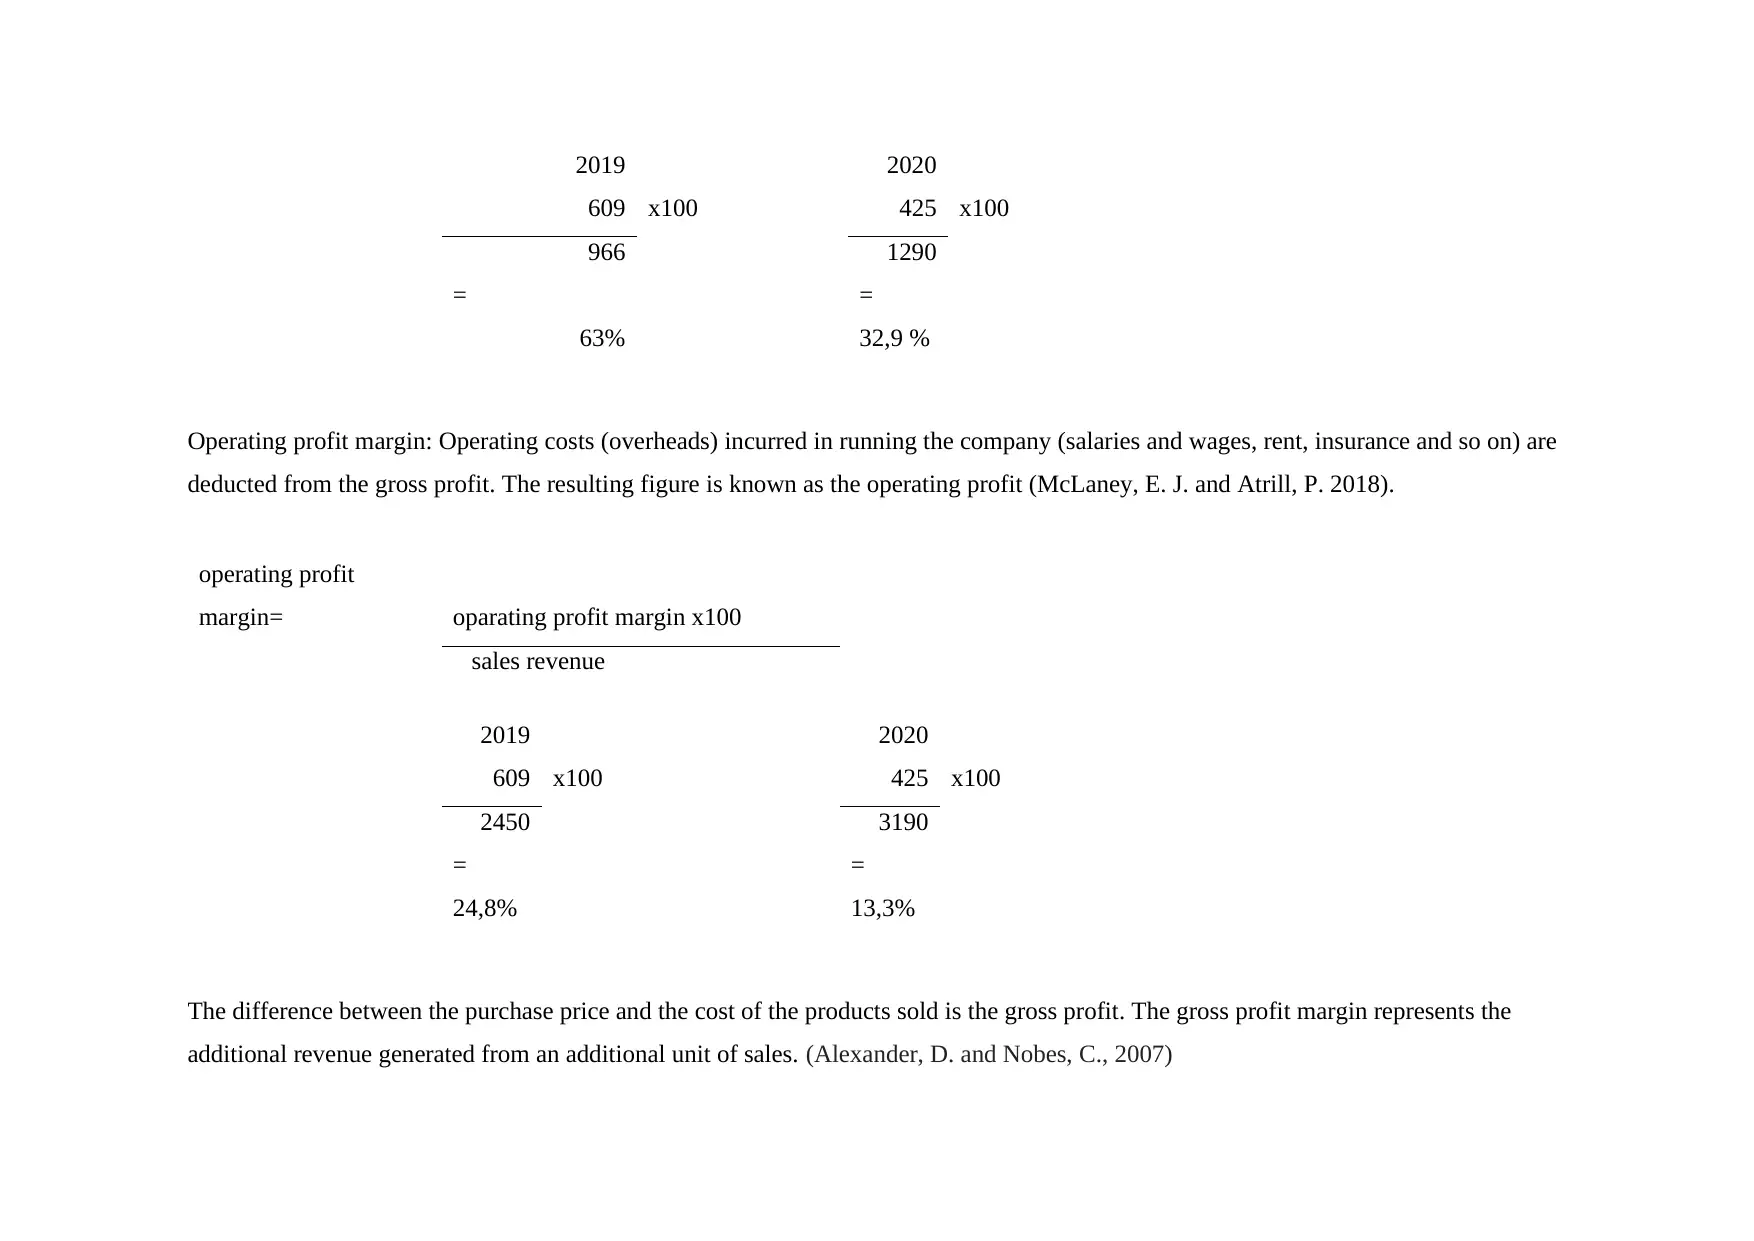
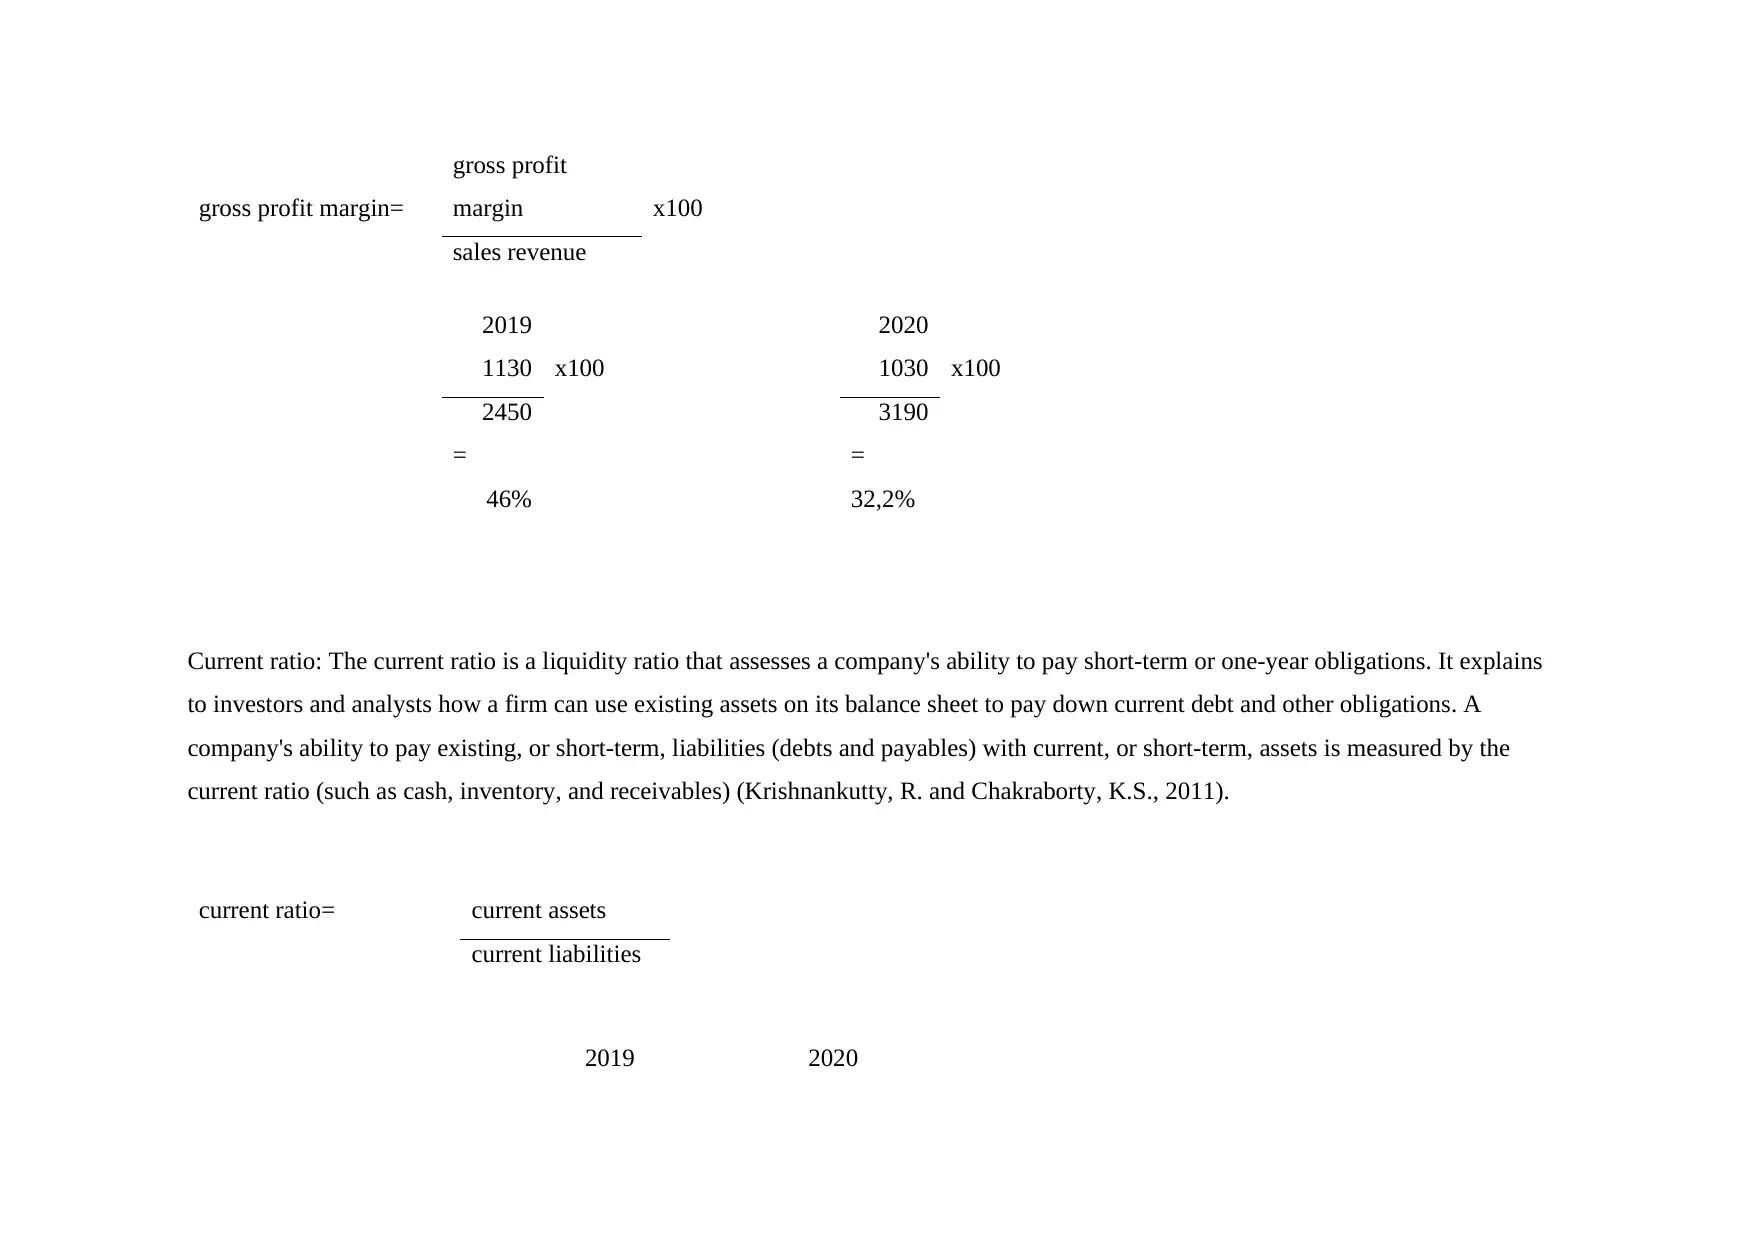
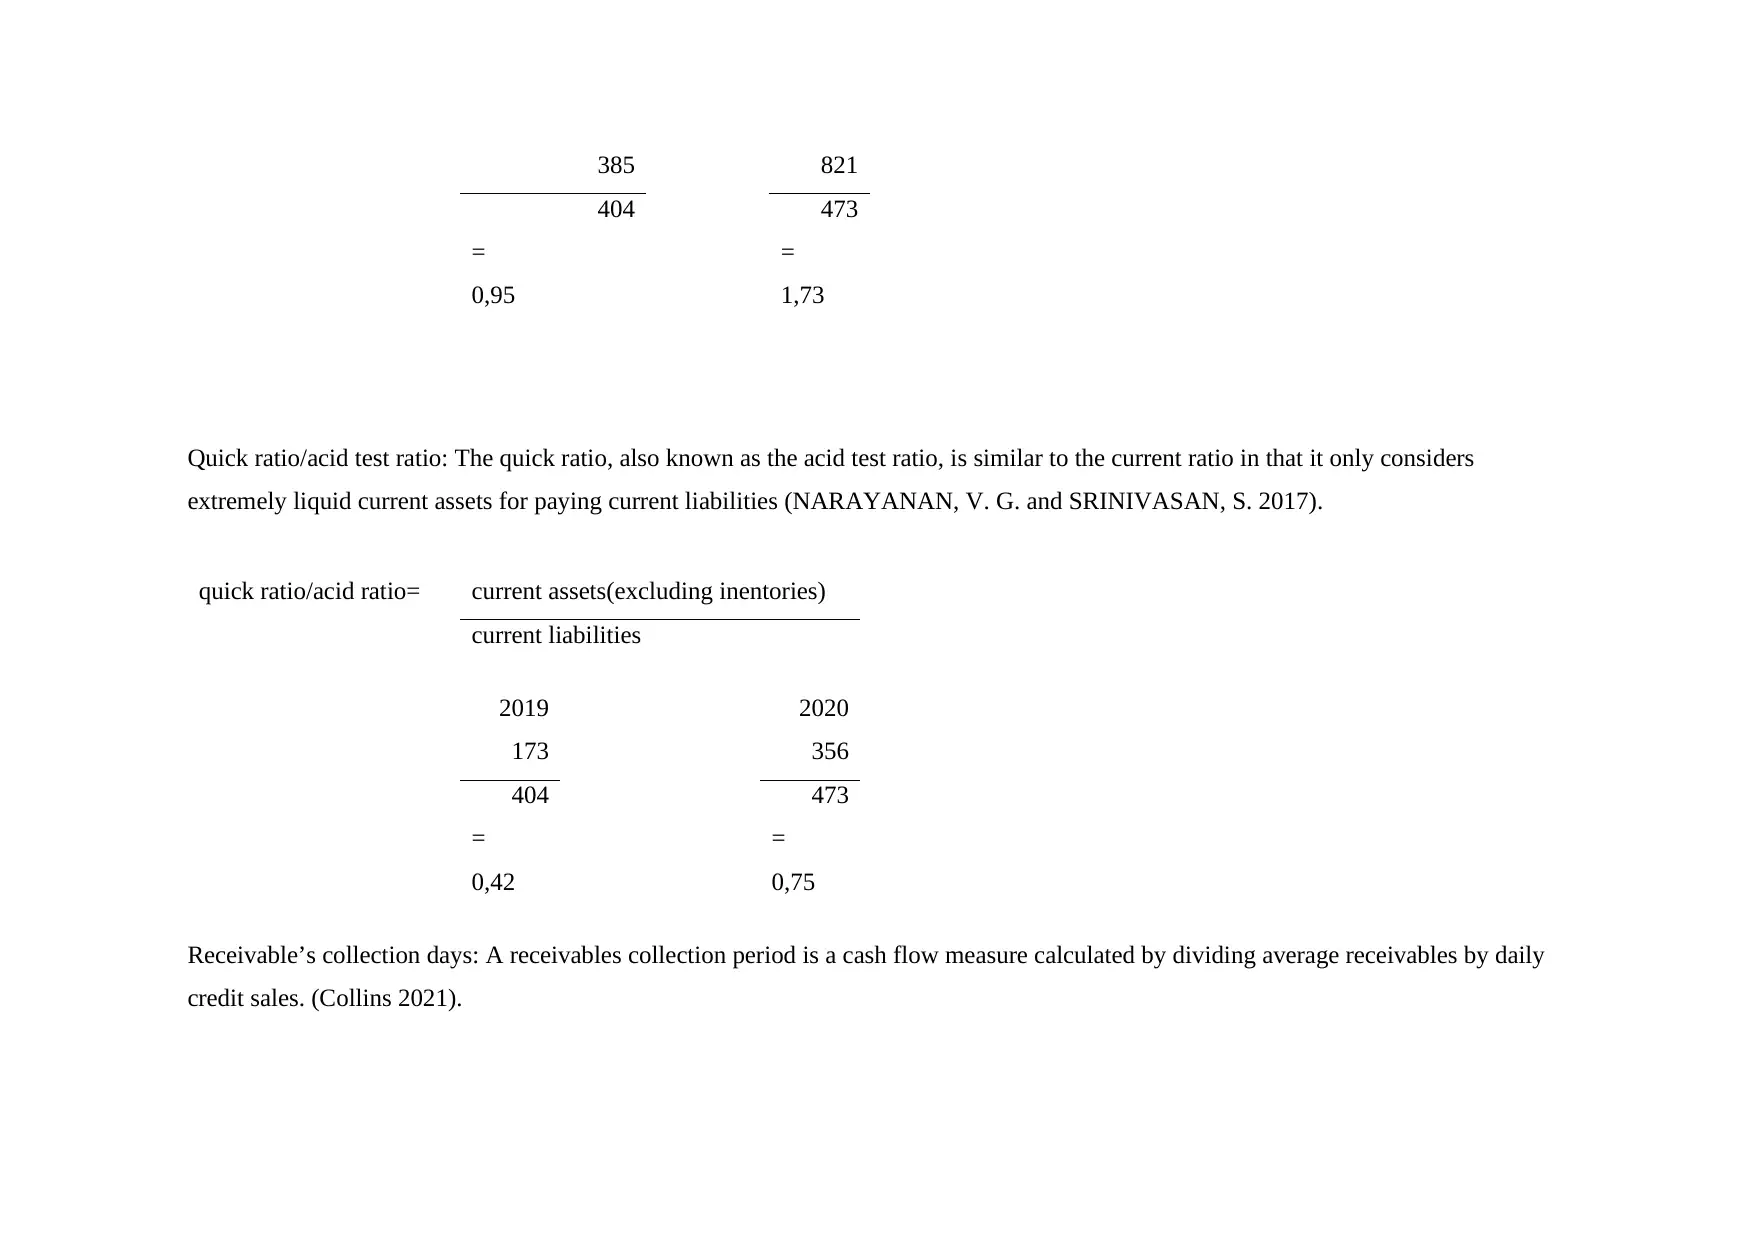
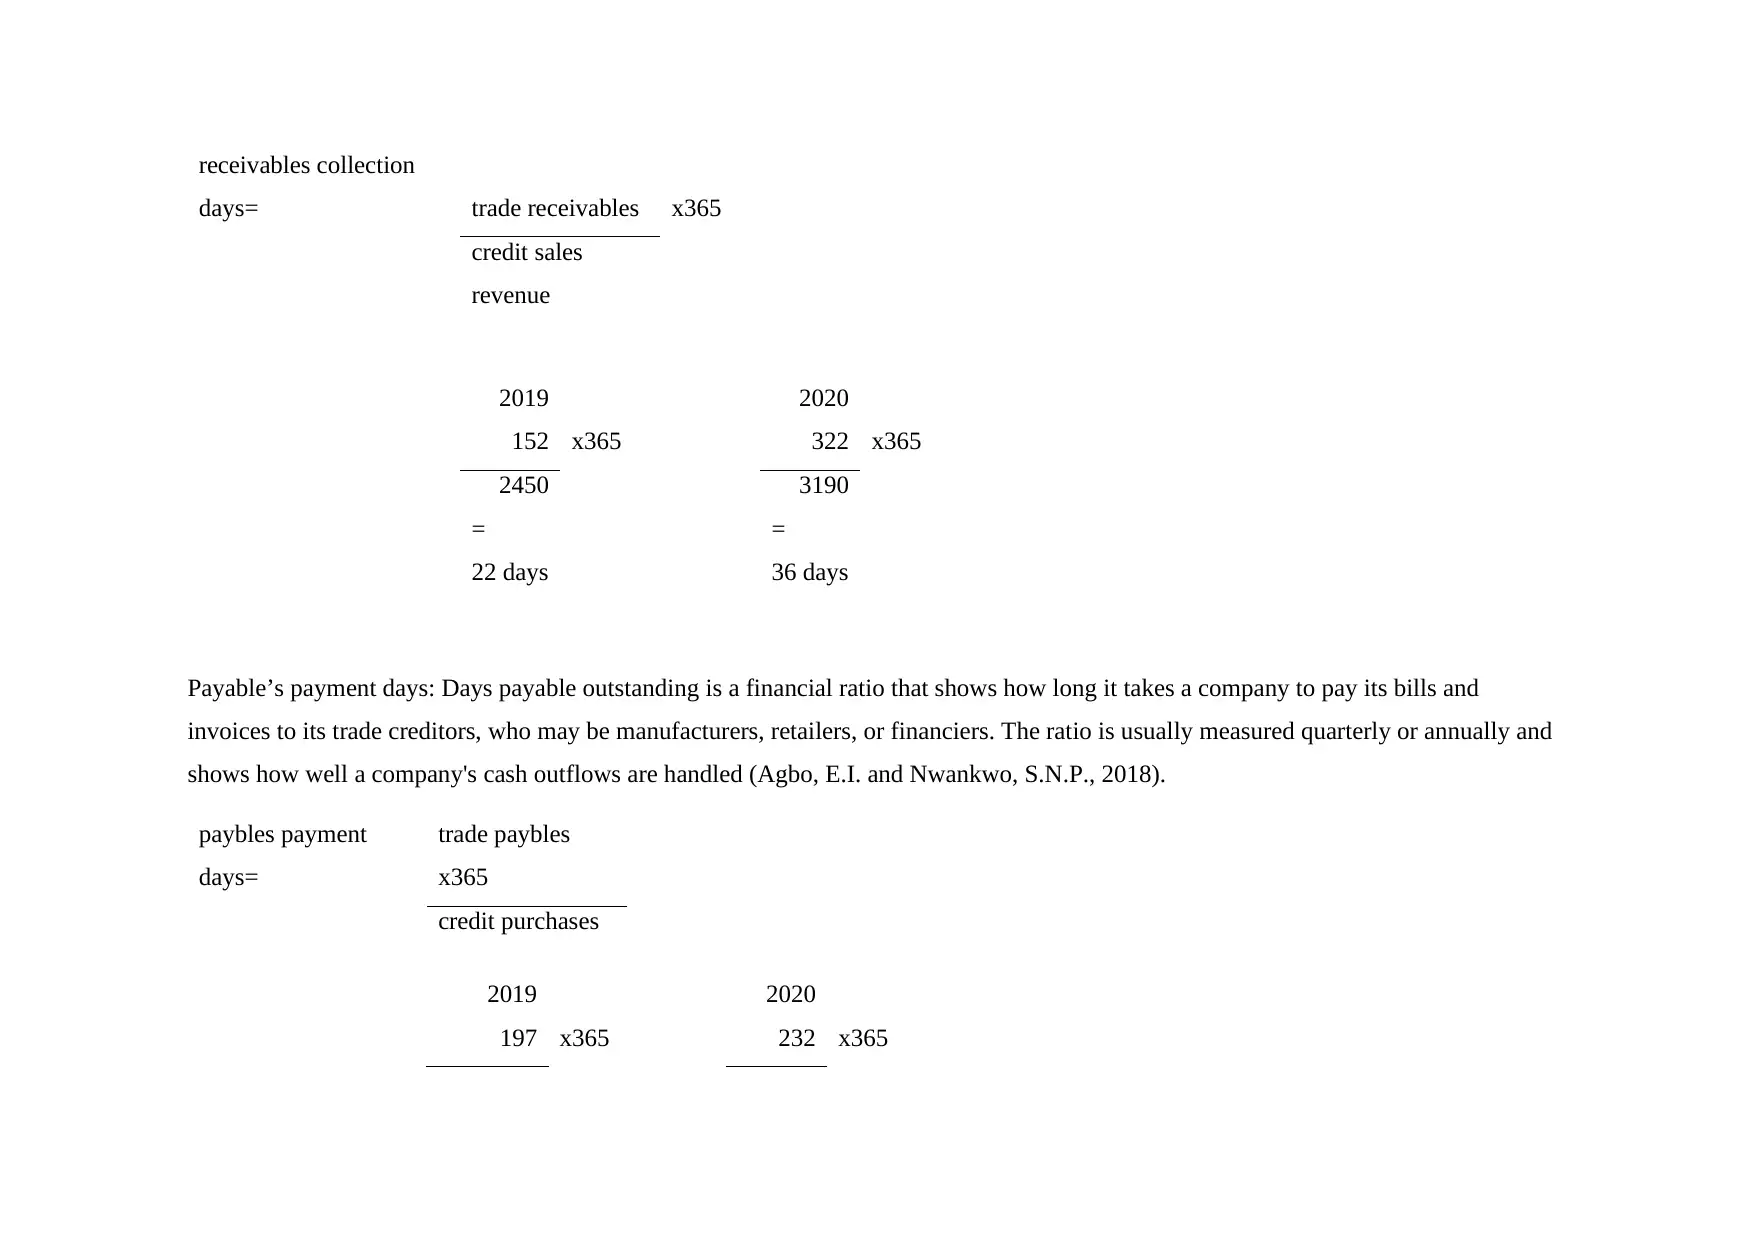
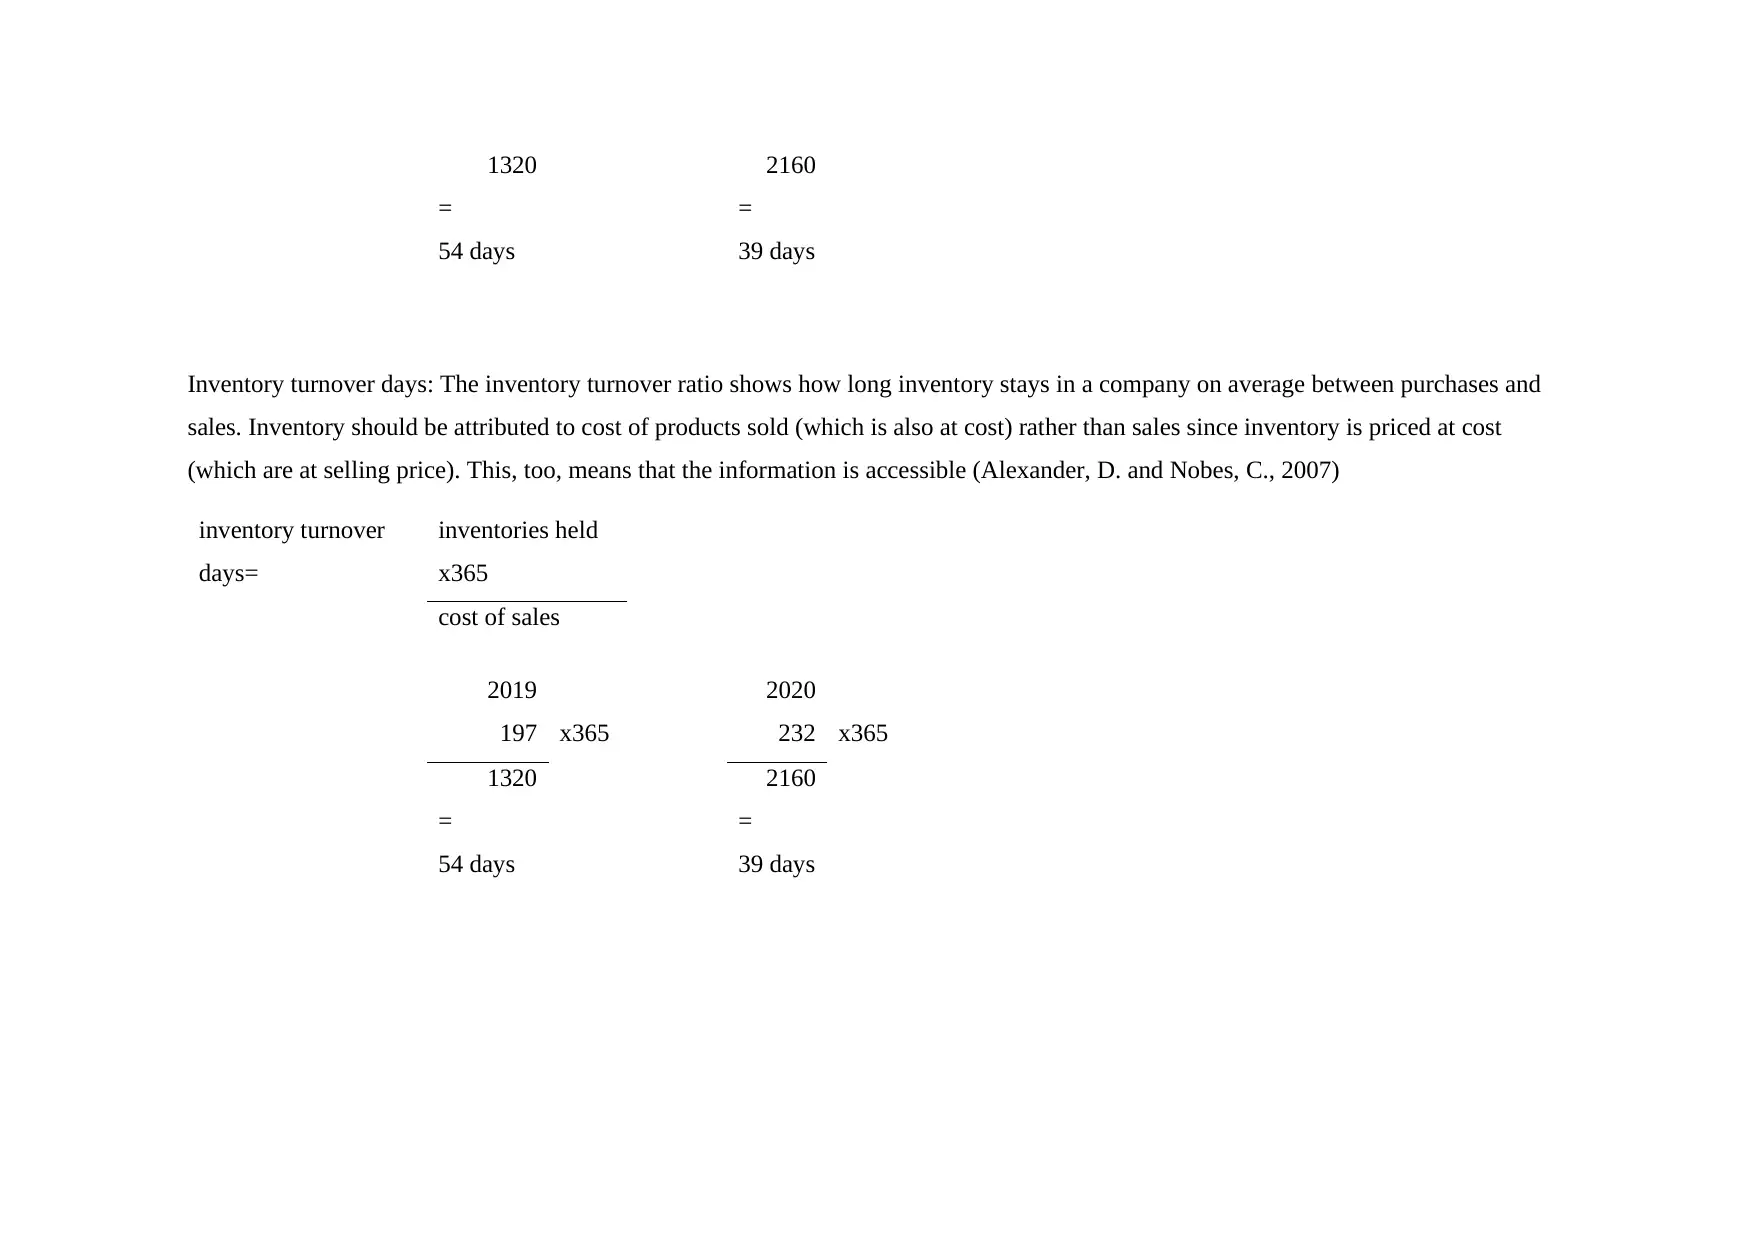
This assignment analyzes financial statements, including the income statement and balance sheet, for Brimwell Ltd. It calculates depreciation, inventories, trade receivables, cash, prepaid expenses, equity, and trade payables. The assignment also assesses Piketown Ltd's financial performance using ratio analysis, including return on capital employed, operating profit margin, gross profit margin, current ratio, quick ratio, receivables collection days, payables payment days, and inventory turnover days. Furthermore, the assignment explores investment appraisal techniques, such as Net Present Value (NPV), payback period, and accounting rate of return (ARR), evaluating their benefits and drawbacks. The report concludes with an assessment of the investment's viability based on these methods.
Document Page
INTRODUCTION TO ACCOUNTING AND FINANCE
UGB163
Christina Kalantzi 209273388
Module Tutor: Eirini Lazaridou
Year 2020-2021
tabler-icon-diamond-filled.svg

Paraphrase This Document

Need a fresh take? Get an instant paraphrase of this document with our AI Paraphraser
Document Page
Part A – Brimwell Ltd
annual van depreciation (i.s)
initial cost-resale value
30000-3000
= 5400 per year
Number of years 5
Inventories (final inventories-b.s)
total inventories bought cost of goods sold
(284000+46000)-(188000+21000) = 121000
Trade receivables (b.s)
net trade receivables= sales revenue from trade receivables-receipts from trade receivables-bad Debt
502000-463000-4600 = 34400
Cash (b.s)
initial equity (capital) 175000
rent paid -81250
Document Page
rates paid -4700
delivery van -30000
Wages -72000
Electricity -5000
cash inventories -46000
cash sales revenue 66000
trade receivables cash receipts 463000
trade payable cash payments -246000
van expenses -53000
166
Prepaid expenses (b.s)
Rent 16250 (81250-65000)
rates
12 months 2700 225 (per month)
9 months (2020) 2025
3 months (2021)--prepaid 675
Equity (b.s)
capital (initial)+profits of the year 319975
Trade payables (b.s)
Document Page
inventories on credit-payments of inventories
284000-246000= 38000
accrued expenses (expenses to be paid) (b.s)
wages 3600
electricity 1400
5000
sales revenue (i.s) 568000 (502000+66000)
cost of goods sold (i.s) 209000 (188000+21000)
gross profit (i.s)
sales revenue-cost of goods sold 359000
rates (as expense 2014) (i.s)
1/1-31/3/2020 2000 months
per
month
1/4/2020-31/3/2021 2700 12 225
tabler-icon-diamond-filled.svg

Paraphrase This Document

Need a fresh take? Get an instant paraphrase of this document with our AI Paraphraser
Document Page
1/4/2020-31/12/2020 2025 9
4025
wages (as expense 2020) (i.s)
75600 (72000+3600)
electricity (as expense 2020) (i.s)
6400 (5000+1400)
van depreciation (as expense 2014) (straight-line depreciation)
(30000-3000)/5= 5400
income statement (31/12/2020)
sales revenue 382000
(cost of goods sold) -209000
gross profit 359000
(rent) -65000
(rates) -4025
(wages) -75600
Document Page
(electricity) -6400
(bad debts) -4600
(annual van depreciation) -5400
(van expenses) -53000
profit of the year 144975
Balance Sheet (31/12/2020)
Assets
Fixed assets (non-current assets)
property plant and eqipment
delivery van 30000
accumulated depreciation -5400
24600
current assets
inventories 121000
trade receivables 34400
prepaid expensed 16250
cash 166
171816
total assets 362975
Document Page
Part B – Piketown Ltd
Return on capital employed (ROCE): Most firms (except limited ones) use return on capital employed (ROCE) as their primary
metric of overall success. It combines profit and capital. More capital could improve one is potential to prosper. The ROCE ratio
measures profitability by comparing the profit generated to the capital needed to manufacture it (Whiting, E., 1986)
ROCE= Operating profit x100
share capital +reserves +noncurrent liabilities
Equity and Liabilities
Equity
closing balance (INITIAL EQUITY+PROFITS OF THE YEAR) 319975
Liabilities
current liabilities
trade payables 38000
accrued expenses 5000
43166
total equity and liabilities 362975
tabler-icon-diamond-filled.svg

Paraphrase This Document

Need a fresh take? Get an instant paraphrase of this document with our AI Paraphraser
Document Page
2019 2020
609 x100 425 x100
966 1290
= =
63% 32,9 %
Operating profit margin: Operating costs (overheads) incurred in running the company (salaries and wages, rent, insurance and so on) are
deducted from the gross profit. The resulting figure is known as the operating profit (McLaney, E. J. and Atrill, P. 2018).
operating profit
margin= oparating profit margin x100
sales revenue
2019 2020
609 x100 425 x100
2450 3190
= =
24,8% 13,3%
The difference between the purchase price and the cost of the products sold is the gross profit. The gross profit margin represents the
additional revenue generated from an additional unit of sales. (Alexander, D. and Nobes, C., 2007)
Document Page
gross profit margin=
gross profit
margin x100
sales revenue
2019 2020
1130 x100 1030 x100
2450 3190
= =
46% 32,2%
Current ratio: The current ratio is a liquidity ratio that assesses a company's ability to pay short-term or one-year obligations. It explains
to investors and analysts how a firm can use existing assets on its balance sheet to pay down current debt and other obligations. A
company's ability to pay existing, or short-term, liabilities (debts and payables) with current, or short-term, assets is measured by the
current ratio (such as cash, inventory, and receivables) (Krishnankutty, R. and Chakraborty, K.S., 2011).
current ratio= current assets
current liabilities
2019 2020
Document Page
385 821
404 473
= =
0,95 1,73
Quick ratio/acid test ratio: The quick ratio, also known as the acid test ratio, is similar to the current ratio in that it only considers
extremely liquid current assets for paying current liabilities (NARAYANAN, V. G. and SRINIVASAN, S. 2017).
quick ratio/acid ratio= current assets(excluding inentories)
current liabilities
2019 2020
173 356
404 473
= =
0,42 0,75
Receivable’s collection days: A receivables collection period is a cash flow measure calculated by dividing average receivables by daily
credit sales. (Collins 2021).
tabler-icon-diamond-filled.svg

Paraphrase This Document

Need a fresh take? Get an instant paraphrase of this document with our AI Paraphraser
Document Page
receivables collection
days= trade receivables x365
credit sales
revenue
2019 2020
152 x365 322 x365
2450 3190
= =
22 days 36 days
Payable’s payment days: Days payable outstanding is a financial ratio that shows how long it takes a company to pay its bills and
invoices to its trade creditors, who may be manufacturers, retailers, or financiers. The ratio is usually measured quarterly or annually and
shows how well a company's cash outflows are handled (Agbo, E.I. and Nwankwo, S.N.P., 2018).
paybles payment
days=
trade paybles
x365
credit purchases
2019 2020
197 x365 232 x365
Document Page
1320 2160
= =
54 days 39 days
Inventory turnover days: The inventory turnover ratio shows how long inventory stays in a company on average between purchases and
sales. Inventory should be attributed to cost of products sold (which is also at cost) rather than sales since inventory is priced at cost
(which are at selling price). This, too, means that the information is accessible (Alexander, D. and Nobes, C., 2007)
inventory turnover
days=
inventories held
x365
cost of sales
2019 2020
197 x365 232 x365
1320 2160
= =
54 days 39 days
chevron_up_icon
1 out of 25
circle_padding
hide_on_mobile
zoom_out_icon
[object Object]