Accounting and Finance Report: Yarnshaw, Reckturk, Roseville Analysis
VerifiedAdded on 2021/02/19
|17
|4414
|290
Report
AI Summary
This report delves into the core concepts of accounting and finance, examining financial statements like profit and loss statements and balance sheets for Yarnshaw Limited. It then analyzes Reckturk PLC, determining contribution per wardrobe, break-even points, margin of safety, and assessing a marketing strategy. The report concludes with an evaluation of capital budgeting projects for Roseville PLC using investment appraisal techniques, and a discussion of the merits and limitations of budgeting as a strategic planning tool. The analysis covers key financial metrics, including contribution margin, break-even analysis, and the impact of marketing investments on profitability. Finally, the report identifies the underlying assumptions of the break-even model.
UGB 163 – INTRODUCTION
TO ACCOUNTING AND
FINANCE ASSESSMENT
TO ACCOUNTING AND
FINANCE ASSESSMENT
Paraphrase This Document
Need a fresh take? Get an instant paraphrase of this document with our AI Paraphraser
Table of Contents
INTRODUCTION...........................................................................................................................1
PART-A: YARNSHAW LIMITED................................................................................................1
a. Profit and Loss Statement .......................................................................................................1
b. Statement of Balance Sheet.....................................................................................................3
PART-B: RECKTURK PLC...........................................................................................................5
a. Determining contribution per wardrobe made towards covering fixed costs when selling
price is £40 .................................................................................................................................5
b. Calculating Break-even Point and Margin of Safety when selling price is £40.....................6
c. Ascertaining Company Profit when Unit Production is 54,000 wardrobes at £40 per unit....7
d. Assessing strategy for Reckturk Plc........................................................................................7
e. Identification of Underpinning Asssumptions in Break-even Model.....................................8
PART-C: ROSEVILLE PLC...........................................................................................................9
a. Recommendation of acceptance or rejection of Capital Budgeting Projects using Investment
Appraisal techniques...................................................................................................................9
b. Report on key merits and limitations of various investment appraising techniques.............10
c. Report on identification of key merits and demerits of using Budgets as a strategy planning
tool.............................................................................................................................................12
CONCLUSION..............................................................................................................................13
REFERENCES..............................................................................................................................15
INTRODUCTION
The concepts of Accounting and Finance are highly interrelated yet different fields.
Accounting is mostly concerned with the acknowledgement of transactions that can be measured
in monetary terms. While discipline of Finance relates to the presentation in the form of reports
to the stakeholders of the business. These two elements ensure that financial transactions are
recorded and communicated to the stakeholders of the company in an efficient manner
(Ainsworth and Deines, 2019). They enable the procurement of financial resources as well as
their allocation in a justifiable manner on the part of management who are responsible for taking
informed decisions regarding the same.
This report aims to provide a detailed account on the fundamental models, concepts and
techniques used with financial and management accounting. For this purpose, it overlooks at the
concept of preparation of financial statements such as Income Statements, Balance Sheet,
determination of contribution, break-even point, Margin of Safety in terms of units and revenue.
Additionally, various investment appraising tools utilised in capital budgeting related decisions
along with benefits and limitations of budget as a strategic planning tool have been analysed.
PART-A: YARNSHAW LIMITED
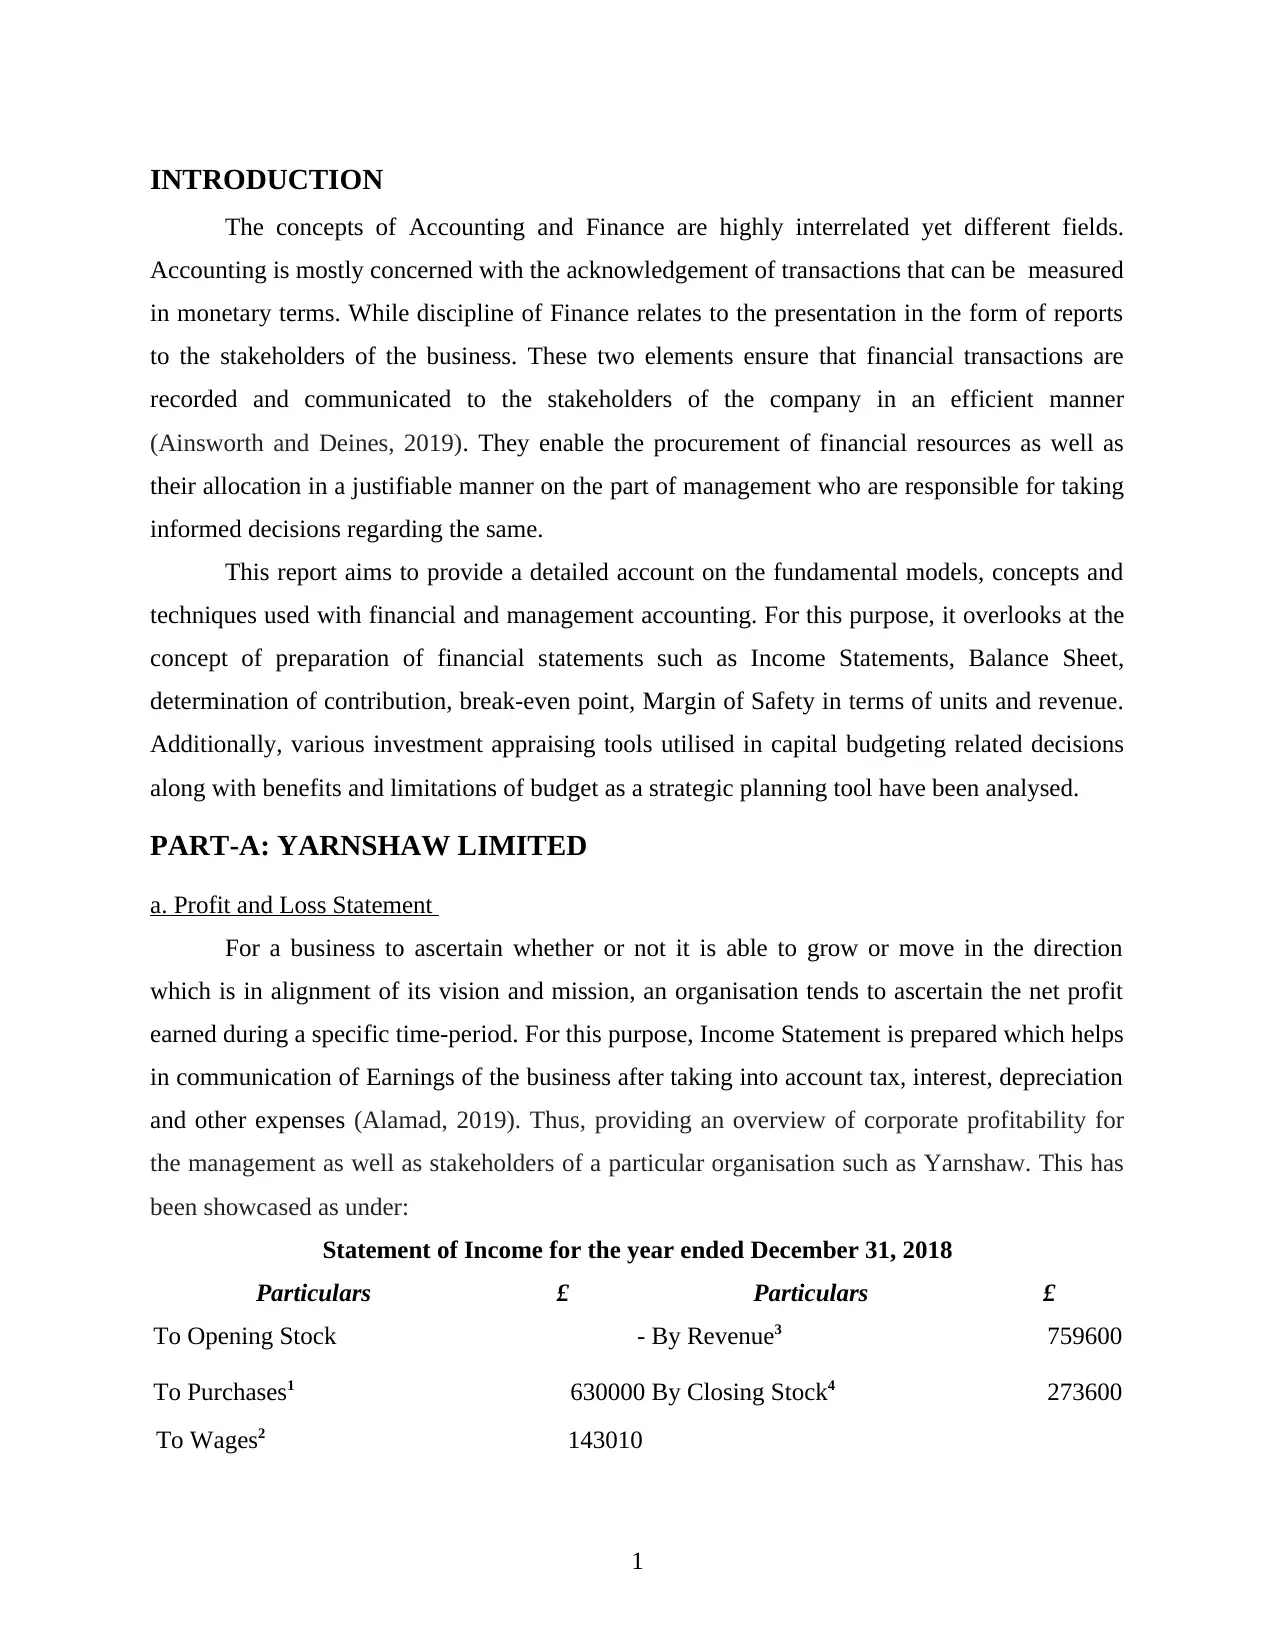
a. Profit and Loss Statement
For a business to ascertain whether or not it is able to grow or move in the direction
which is in alignment of its vision and mission, an organisation tends to ascertain the net profit
earned during a specific time-period. For this purpose, Income Statement is prepared which helps
in communication of Earnings of the business after taking into account tax, interest, depreciation
and other expenses (Alamad, 2019). Thus, providing an overview of corporate profitability for
the management as well as stakeholders of a particular organisation such as Yarnshaw. This has
been showcased as under:
Statement of Income for the year ended December 31, 2018
Particulars £ Particulars £
To Opening Stock - By Revenue3 759600
To Purchases1 630000 By Closing Stock4 273600
To Wages2 143010
1
The concepts of Accounting and Finance are highly interrelated yet different fields.
Accounting is mostly concerned with the acknowledgement of transactions that can be measured
in monetary terms. While discipline of Finance relates to the presentation in the form of reports
to the stakeholders of the business. These two elements ensure that financial transactions are
recorded and communicated to the stakeholders of the company in an efficient manner
(Ainsworth and Deines, 2019). They enable the procurement of financial resources as well as
their allocation in a justifiable manner on the part of management who are responsible for taking
informed decisions regarding the same.
This report aims to provide a detailed account on the fundamental models, concepts and
techniques used with financial and management accounting. For this purpose, it overlooks at the
concept of preparation of financial statements such as Income Statements, Balance Sheet,
determination of contribution, break-even point, Margin of Safety in terms of units and revenue.
Additionally, various investment appraising tools utilised in capital budgeting related decisions
along with benefits and limitations of budget as a strategic planning tool have been analysed.
PART-A: YARNSHAW LIMITED
a. Profit and Loss Statement
For a business to ascertain whether or not it is able to grow or move in the direction
which is in alignment of its vision and mission, an organisation tends to ascertain the net profit
earned during a specific time-period. For this purpose, Income Statement is prepared which helps
in communication of Earnings of the business after taking into account tax, interest, depreciation
and other expenses (Alamad, 2019). Thus, providing an overview of corporate profitability for
the management as well as stakeholders of a particular organisation such as Yarnshaw. This has
been showcased as under:
Statement of Income for the year ended December 31, 2018
Particulars £ Particulars £
To Opening Stock - By Revenue3 759600
To Purchases1 630000 By Closing Stock4 273600
To Wages2 143010
1
⊘ This is a preview!⊘
Do you want full access?
Subscribe today to unlock all pages.
Trusted by 1+ million students worldwide
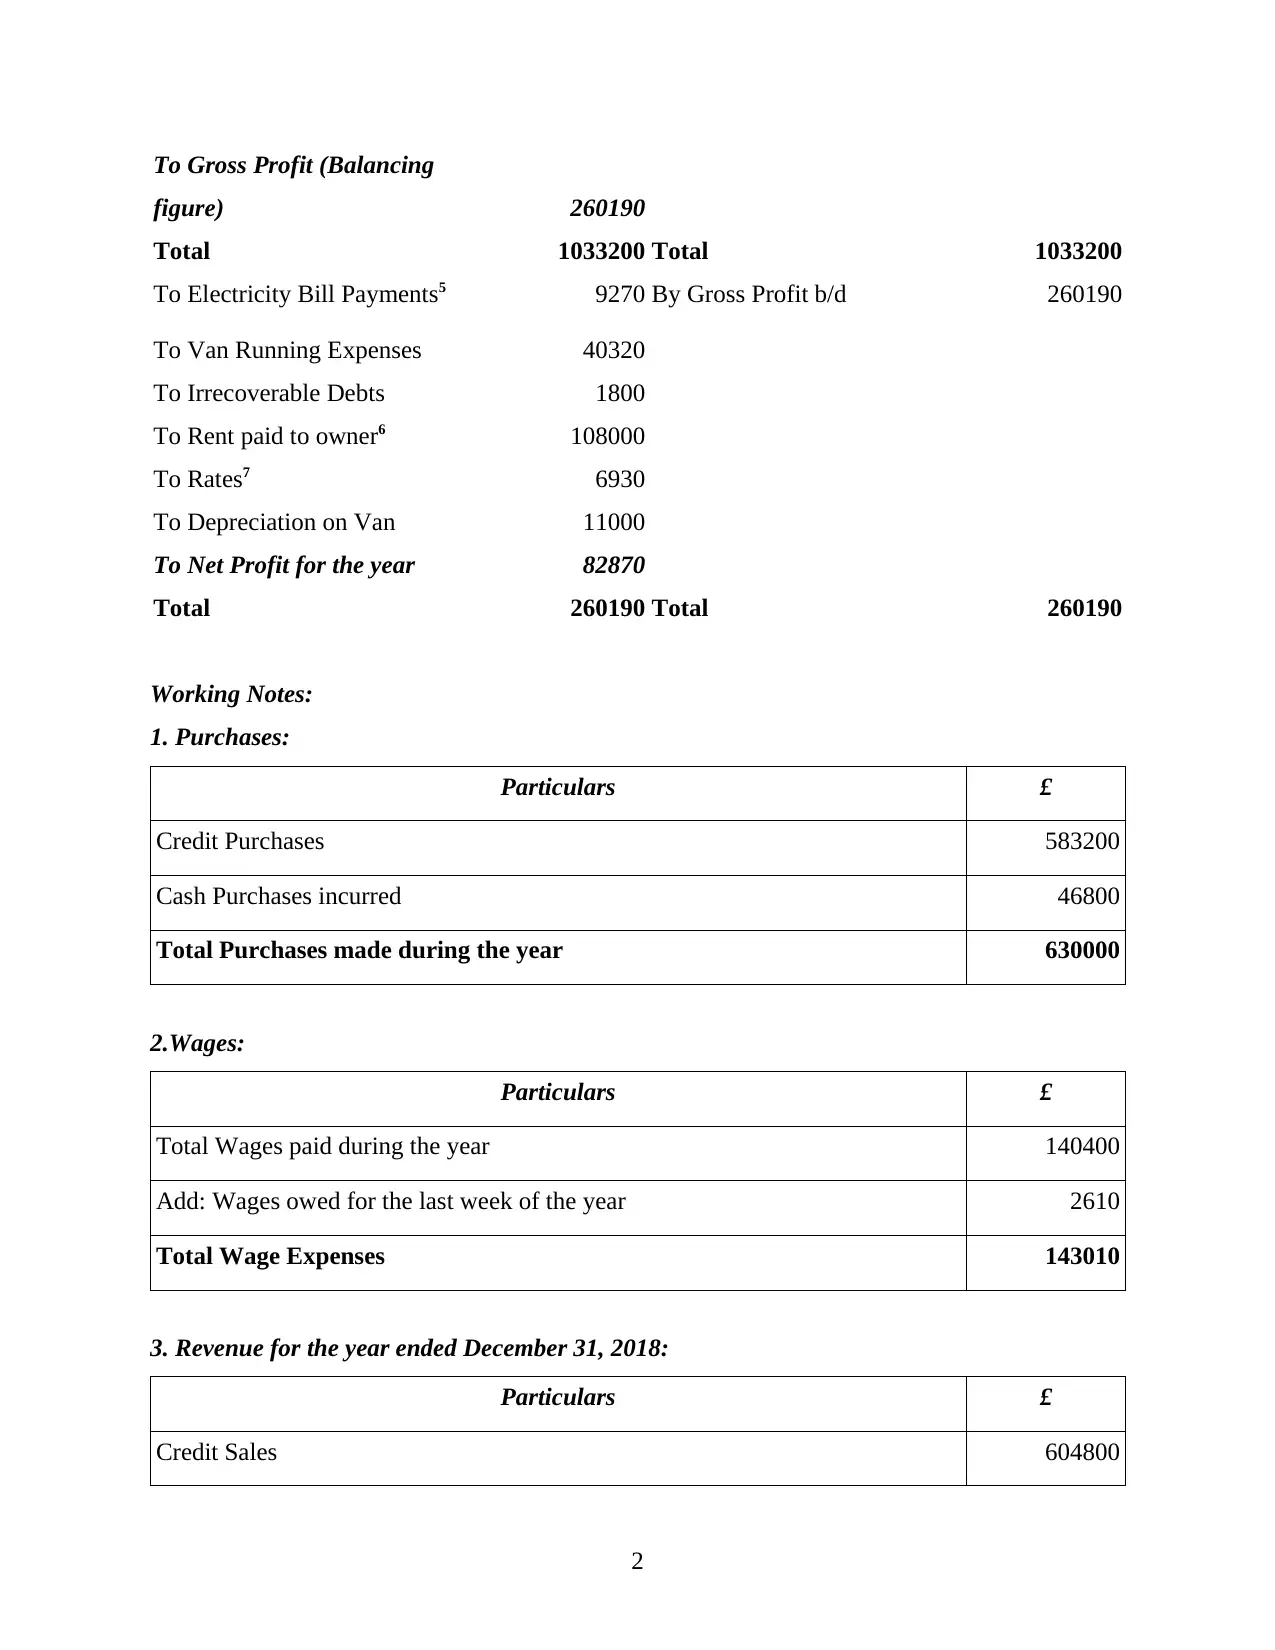
To Gross Profit (Balancing
figure) 260190
Total 1033200 Total 1033200
To Electricity Bill Payments5 9270 By Gross Profit b/d 260190
To Van Running Expenses 40320
To Irrecoverable Debts 1800
To Rent paid to owner6 108000
To Rates7 6930
To Depreciation on Van 11000
To Net Profit for the year 82870
Total 260190 Total 260190
Working Notes:
1. Purchases:
Particulars £
Credit Purchases 583200
Cash Purchases incurred 46800
Total Purchases made during the year 630000
2.Wages:
Particulars £
Total Wages paid during the year 140400
Add: Wages owed for the last week of the year 2610
Total Wage Expenses 143010
3. Revenue for the year ended December 31, 2018:
Particulars £
Credit Sales 604800
2
Paraphrase This Document
Need a fresh take? Get an instant paraphrase of this document with our AI Paraphraser
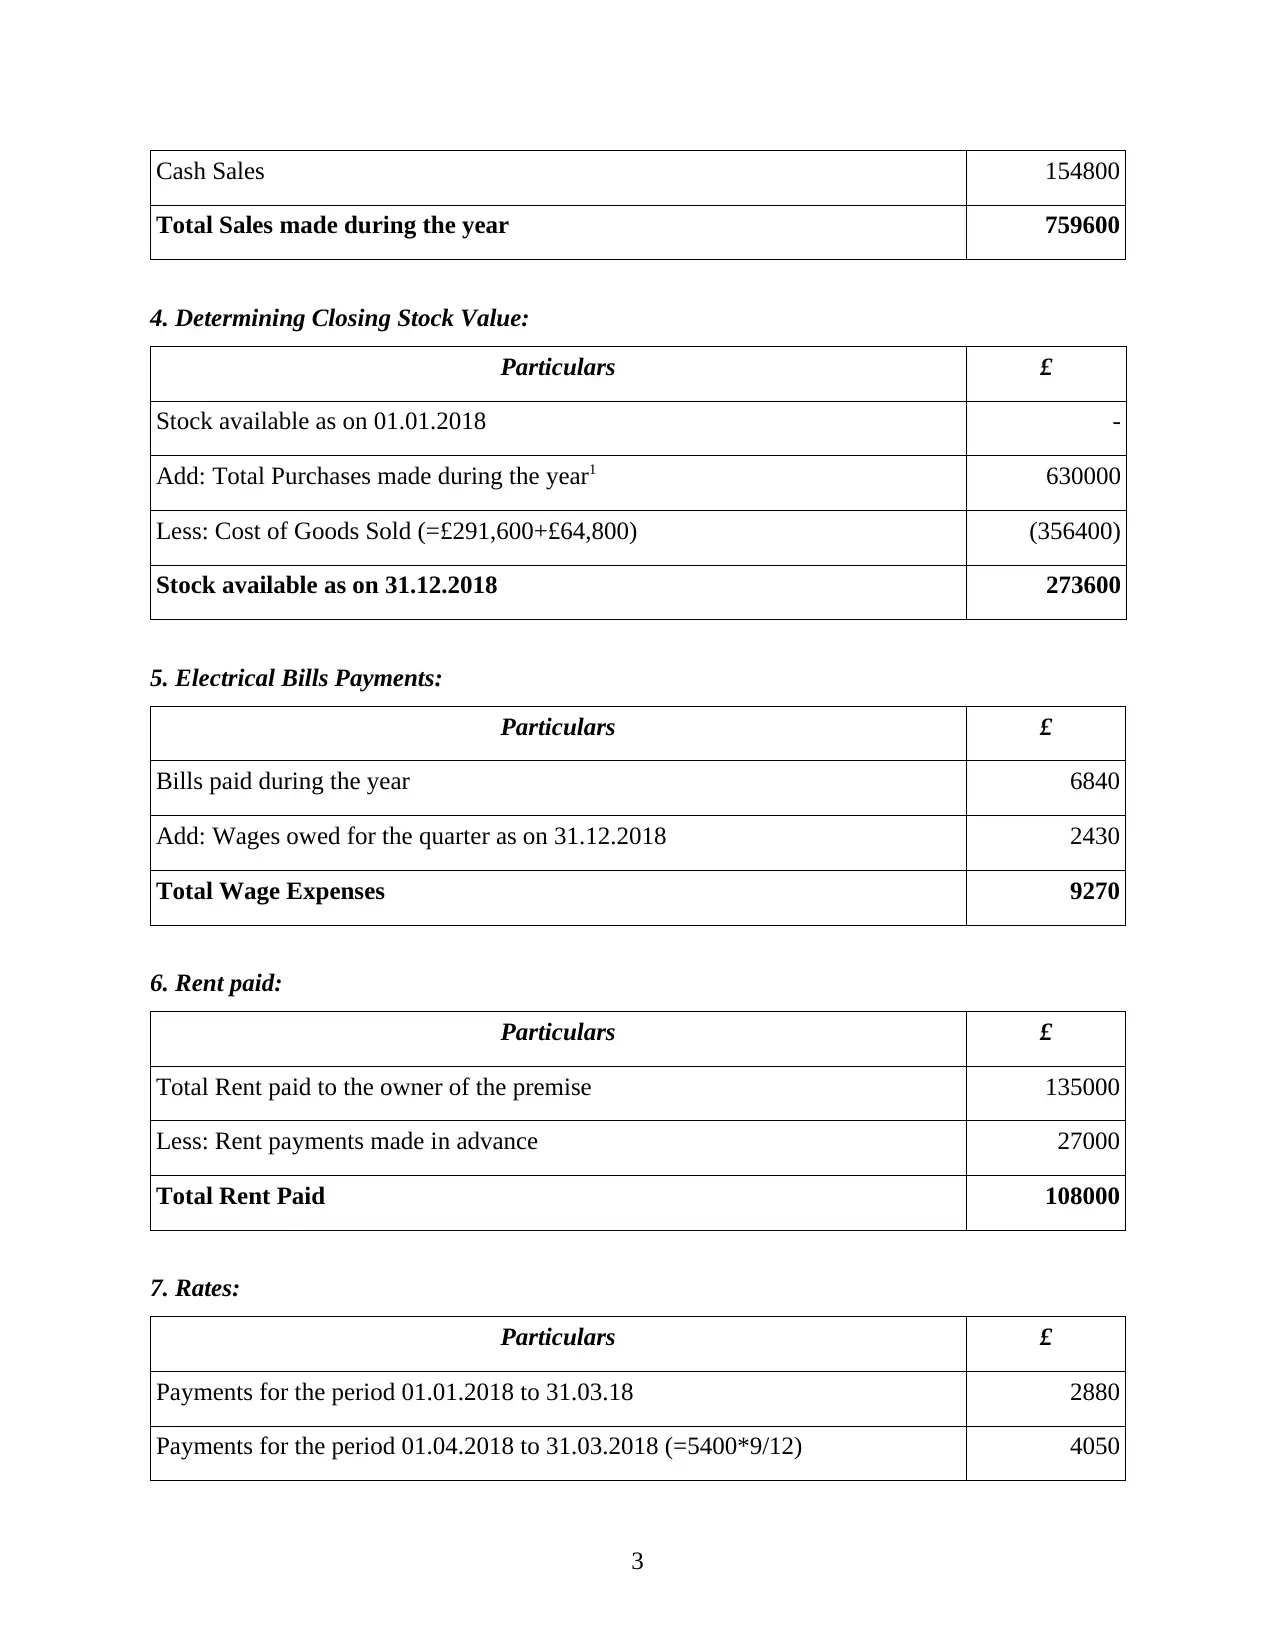
Cash Sales 154800
Total Sales made during the year 759600
4. Determining Closing Stock Value:
Particulars £
Stock available as on 01.01.2018 -
Add: Total Purchases made during the year1 630000
Less: Cost of Goods Sold (=£291,600+£64,800) (356400)
Stock available as on 31.12.2018 273600
5. Electrical Bills Payments:
Particulars £
Bills paid during the year 6840
Add: Wages owed for the quarter as on 31.12.2018 2430
Total Wage Expenses 9270
6. Rent paid:
Particulars £
Total Rent paid to the owner of the premise 135000
Less: Rent payments made in advance 27000
Total Rent Paid 108000
7. Rates:
Particulars £
Payments for the period 01.01.2018 to 31.03.18 2880
Payments for the period 01.04.2018 to 31.03.2018 (=5400*9/12) 4050
3
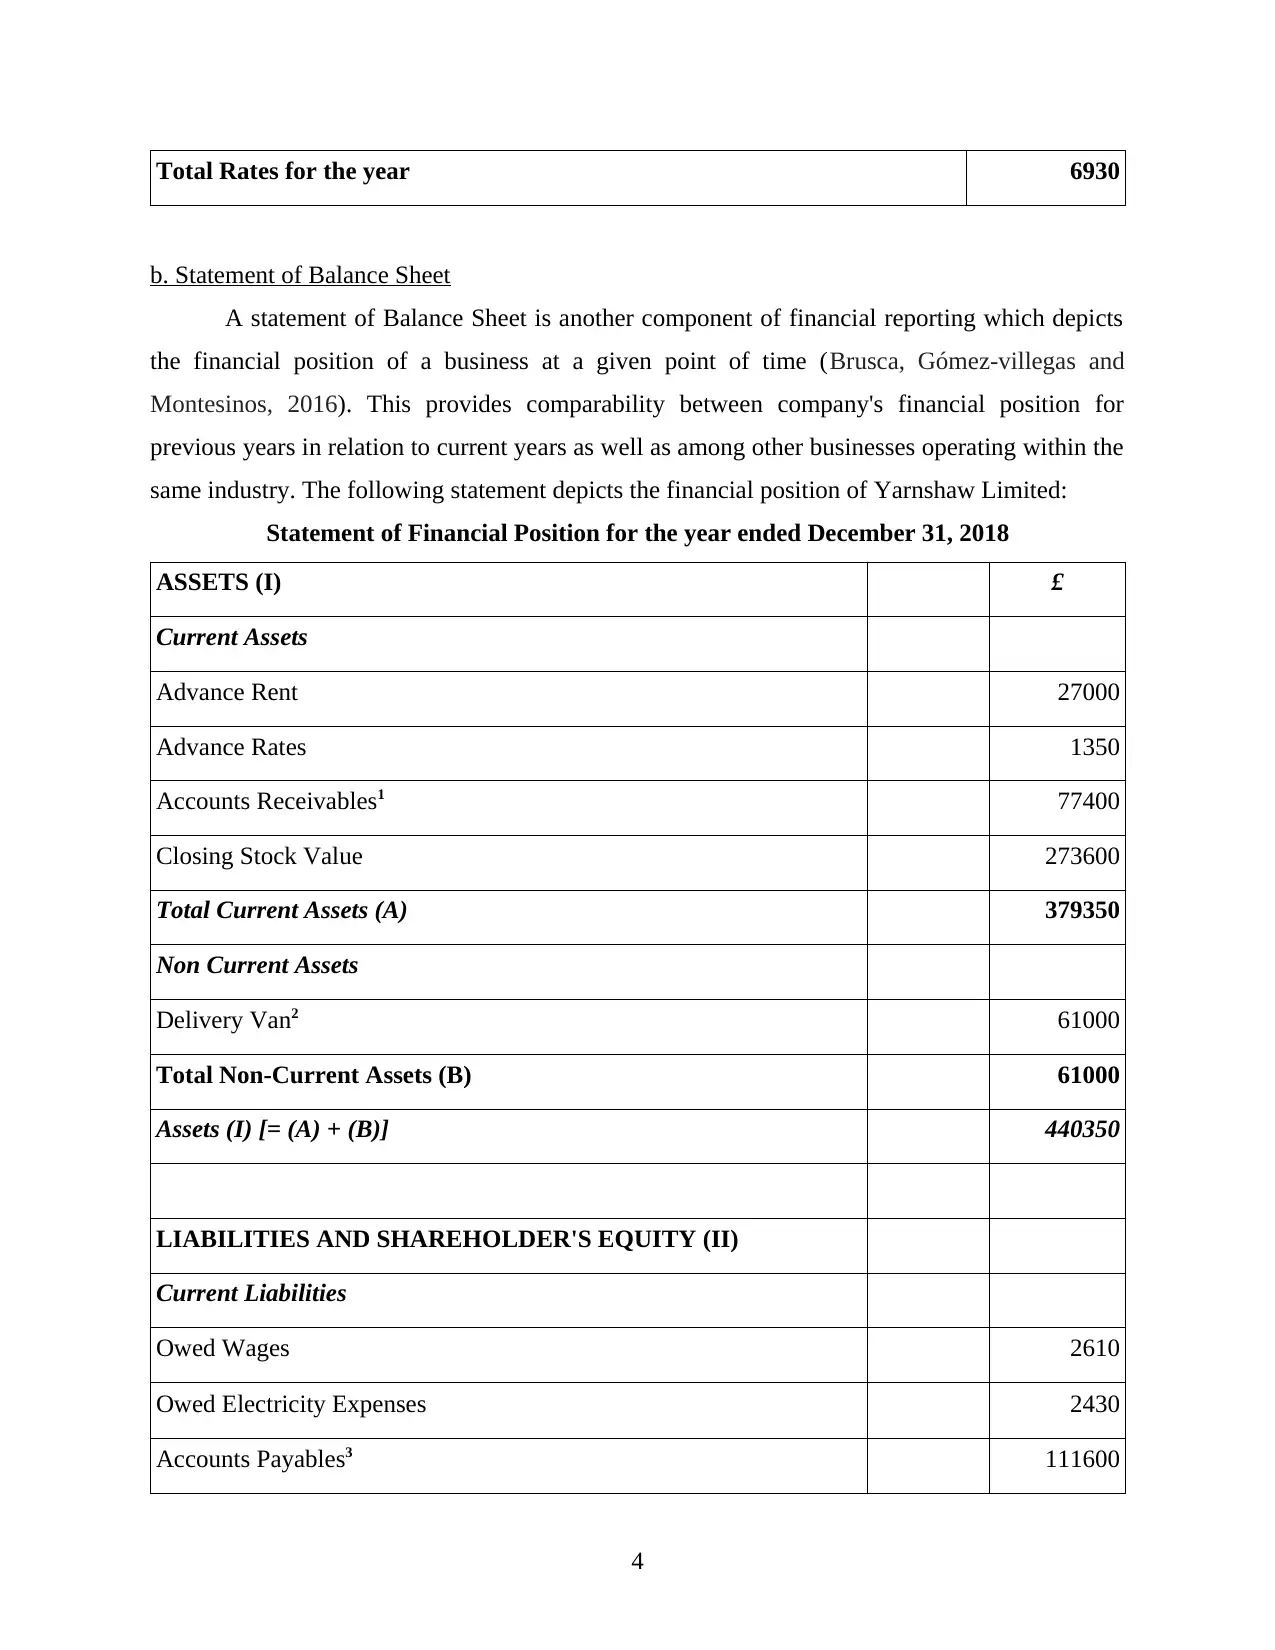
Total Rates for the year 6930
b. Statement of Balance Sheet
A statement of Balance Sheet is another component of financial reporting which depicts
the financial position of a business at a given point of time (Brusca, Gómez‐villegas and
Montesinos, 2016). This provides comparability between company's financial position for
previous years in relation to current years as well as among other businesses operating within the
same industry. The following statement depicts the financial position of Yarnshaw Limited:
Statement of Financial Position for the year ended December 31, 2018
ASSETS (I) £
Current Assets
Advance Rent 27000
Advance Rates 1350
Accounts Receivables1 77400
Closing Stock Value 273600
Total Current Assets (A) 379350
Non Current Assets
Delivery Van2 61000
Total Non-Current Assets (B) 61000
Assets (I) [= (A) + (B)] 440350
LIABILITIES AND SHAREHOLDER'S EQUITY (II)
Current Liabilities
Owed Wages 2610
Owed Electricity Expenses 2430
Accounts Payables3 111600
4
⊘ This is a preview!⊘
Do you want full access?
Subscribe today to unlock all pages.
Trusted by 1+ million students worldwide
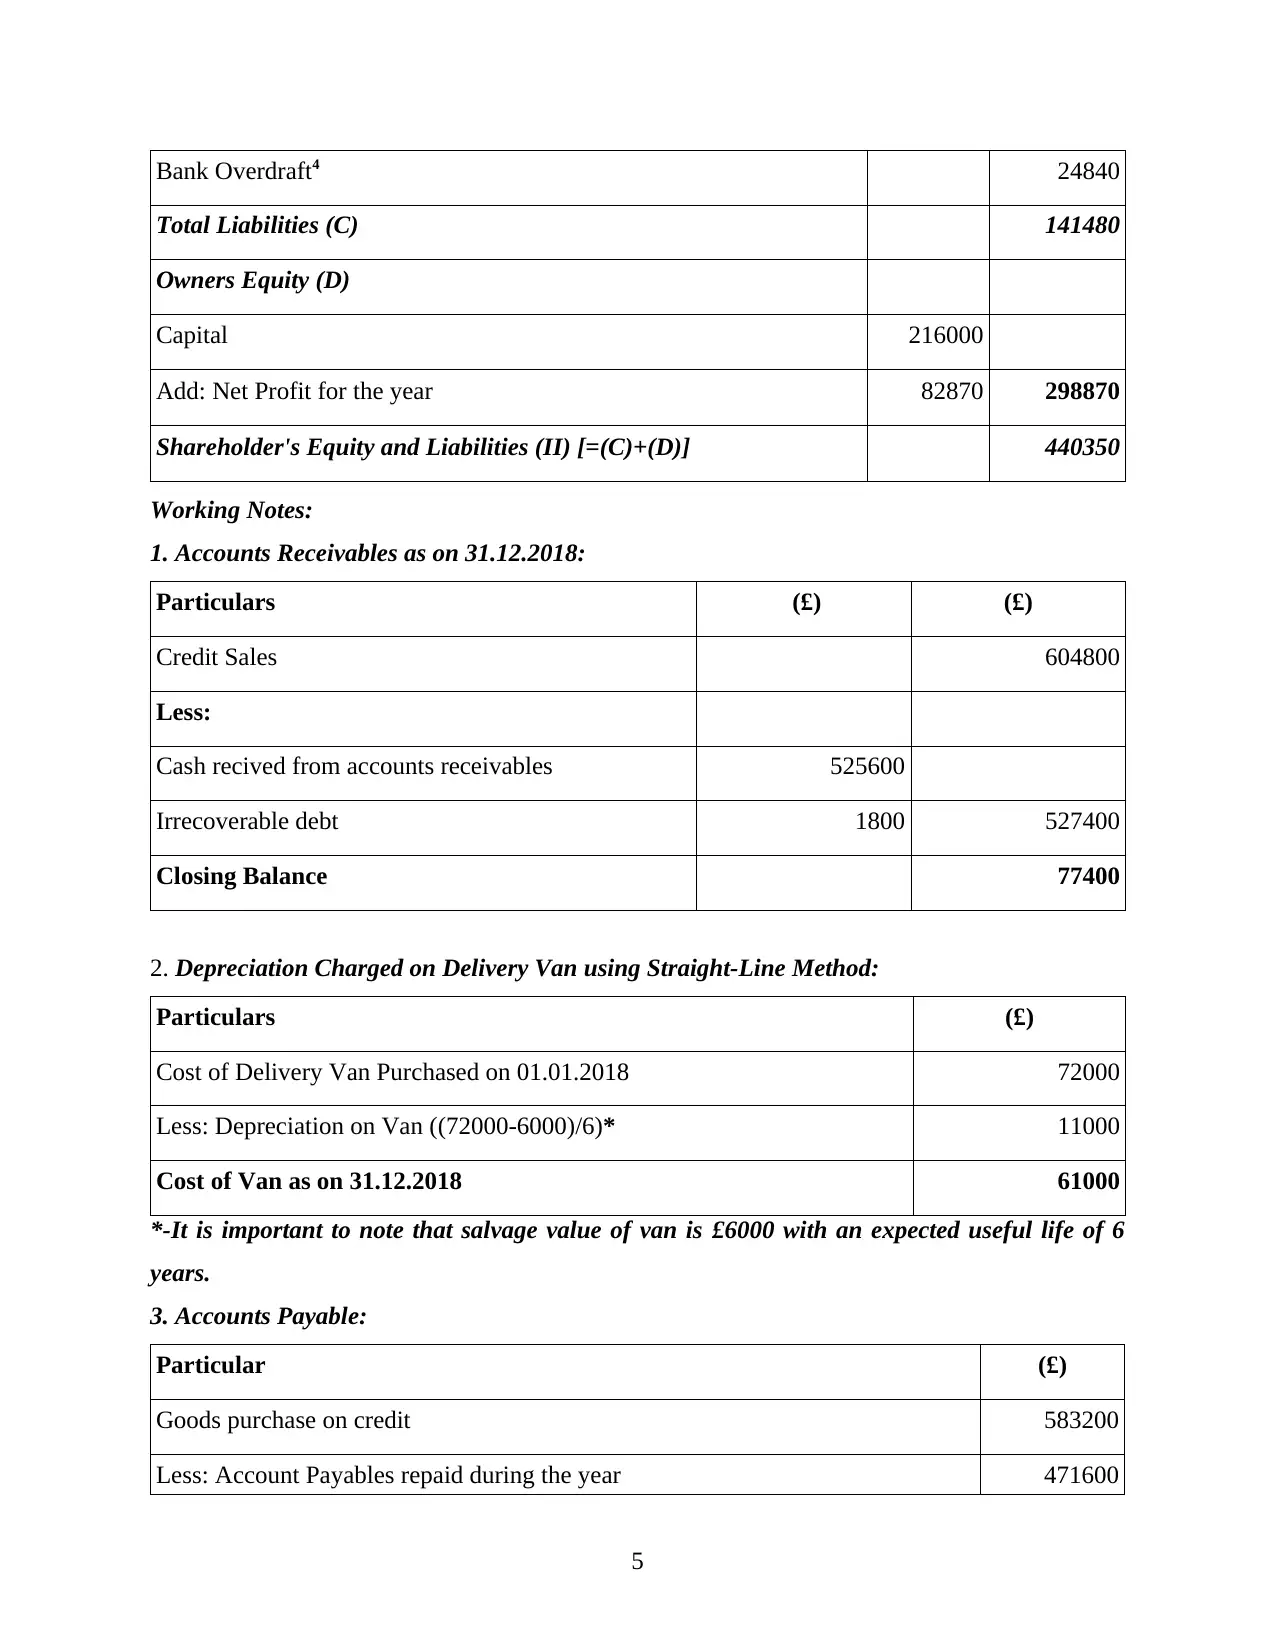
Bank Overdraft4 24840
Total Liabilities (C) 141480
Owners Equity (D)
Capital 216000
Add: Net Profit for the year 82870 298870
Shareholder's Equity and Liabilities (II) [=(C)+(D)] 440350
Working Notes:
1. Accounts Receivables as on 31.12.2018:
Particulars (£) (£)
Credit Sales 604800
Less:
Cash recived from accounts receivables 525600
Irrecoverable debt 1800 527400
Closing Balance 77400
2. Depreciation Charged on Delivery Van using Straight-Line Method:
Particulars (£)
Cost of Delivery Van Purchased on 01.01.2018 72000
Less: Depreciation on Van ((72000-6000)/6)* 11000
Cost of Van as on 31.12.2018 61000
*-It is important to note that salvage value of van is £6000 with an expected useful life of 6
years.
3. Accounts Payable:
Particular (£)
Goods purchase on credit 583200
Less: Account Payables repaid during the year 471600
5
Paraphrase This Document
Need a fresh take? Get an instant paraphrase of this document with our AI Paraphraser
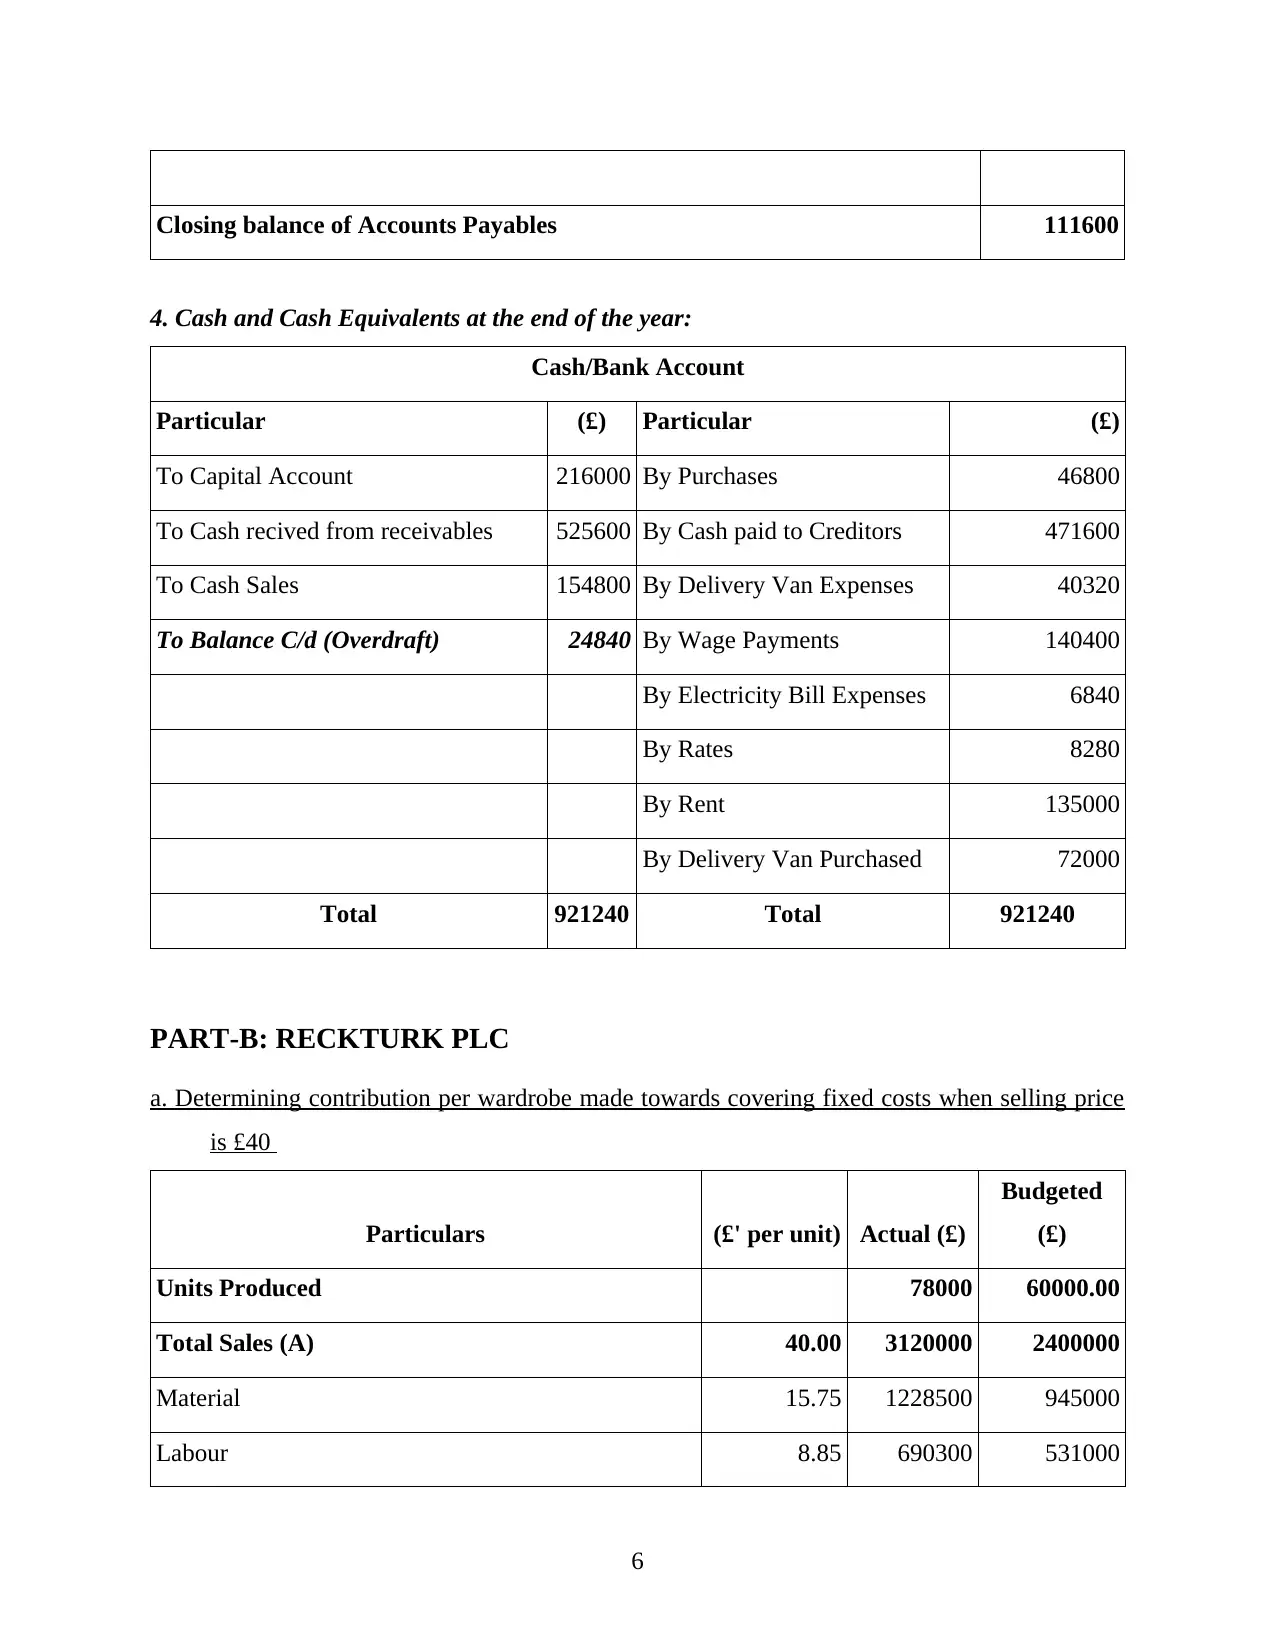
Closing balance of Accounts Payables 111600
4. Cash and Cash Equivalents at the end of the year:
Cash/Bank Account
Particular (£) Particular (£)
To Capital Account 216000 By Purchases 46800
To Cash recived from receivables 525600 By Cash paid to Creditors 471600
To Cash Sales 154800 By Delivery Van Expenses 40320
To Balance C/d (Overdraft) 24840 By Wage Payments 140400
By Electricity Bill Expenses 6840
By Rates 8280
By Rent 135000
By Delivery Van Purchased 72000
Total 921240 Total 921240
PART-B: RECKTURK PLC
a. Determining contribution per wardrobe made towards covering fixed costs when selling price
is £40
Particulars (£' per unit) Actual (£)
Budgeted
(£)
Units Produced 78000 60000.00
Total Sales (A) 40.00 3120000 2400000
Material 15.75 1228500 945000
Labour 8.85 690300 531000
6
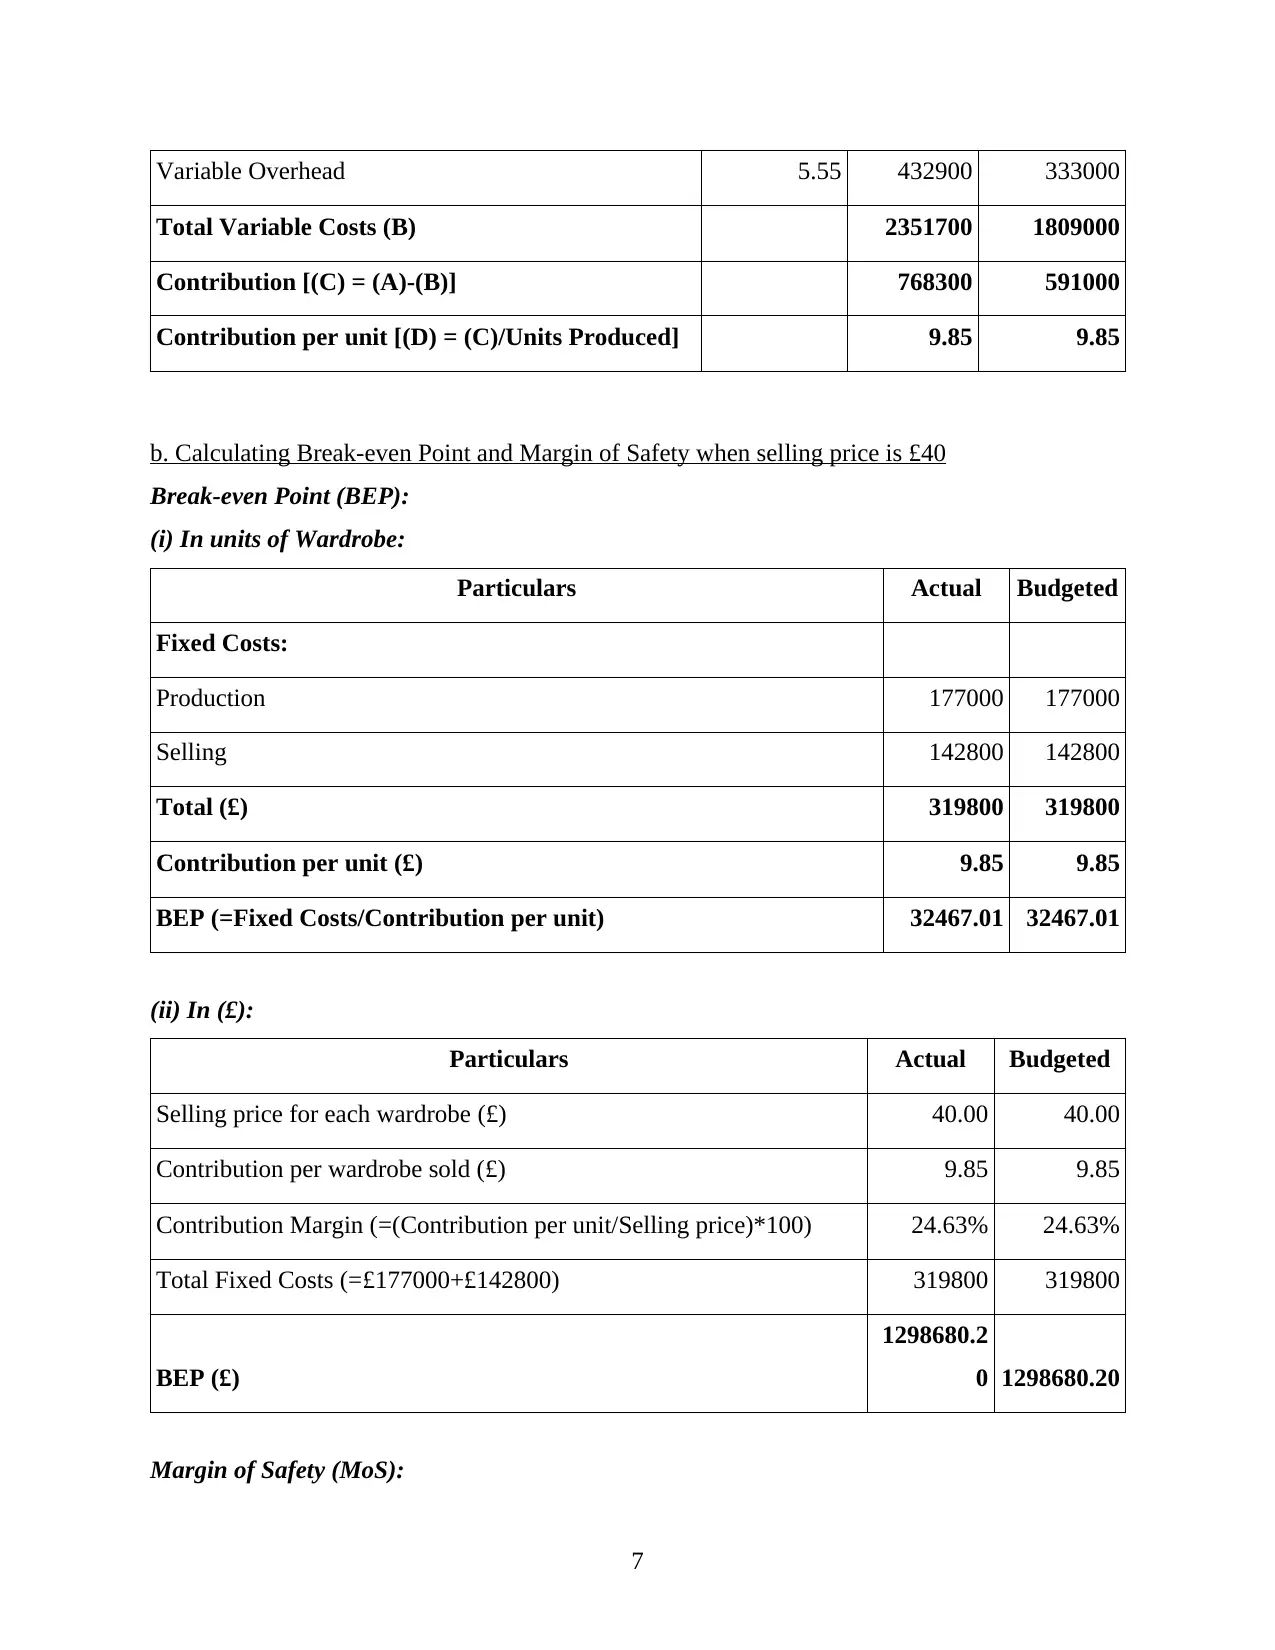
Variable Overhead 5.55 432900 333000
Total Variable Costs (B) 2351700 1809000
Contribution [(C) = (A)-(B)] 768300 591000
Contribution per unit [(D) = (C)/Units Produced] 9.85 9.85
b. Calculating Break-even Point and Margin of Safety when selling price is £40
Break-even Point (BEP):
(i) In units of Wardrobe:
Particulars Actual Budgeted
Fixed Costs:
Production 177000 177000
Selling 142800 142800
Total (£) 319800 319800
Contribution per unit (£) 9.85 9.85
BEP (=Fixed Costs/Contribution per unit) 32467.01 32467.01
(ii) In (£):
Particulars Actual Budgeted
Selling price for each wardrobe (£) 40.00 40.00
Contribution per wardrobe sold (£) 9.85 9.85
Contribution Margin (=(Contribution per unit/Selling price)*100) 24.63% 24.63%
Total Fixed Costs (=£177000+£142800) 319800 319800
BEP (£)
1298680.2
0 1298680.20
Margin of Safety (MoS):
7
⊘ This is a preview!⊘
Do you want full access?
Subscribe today to unlock all pages.
Trusted by 1+ million students worldwide
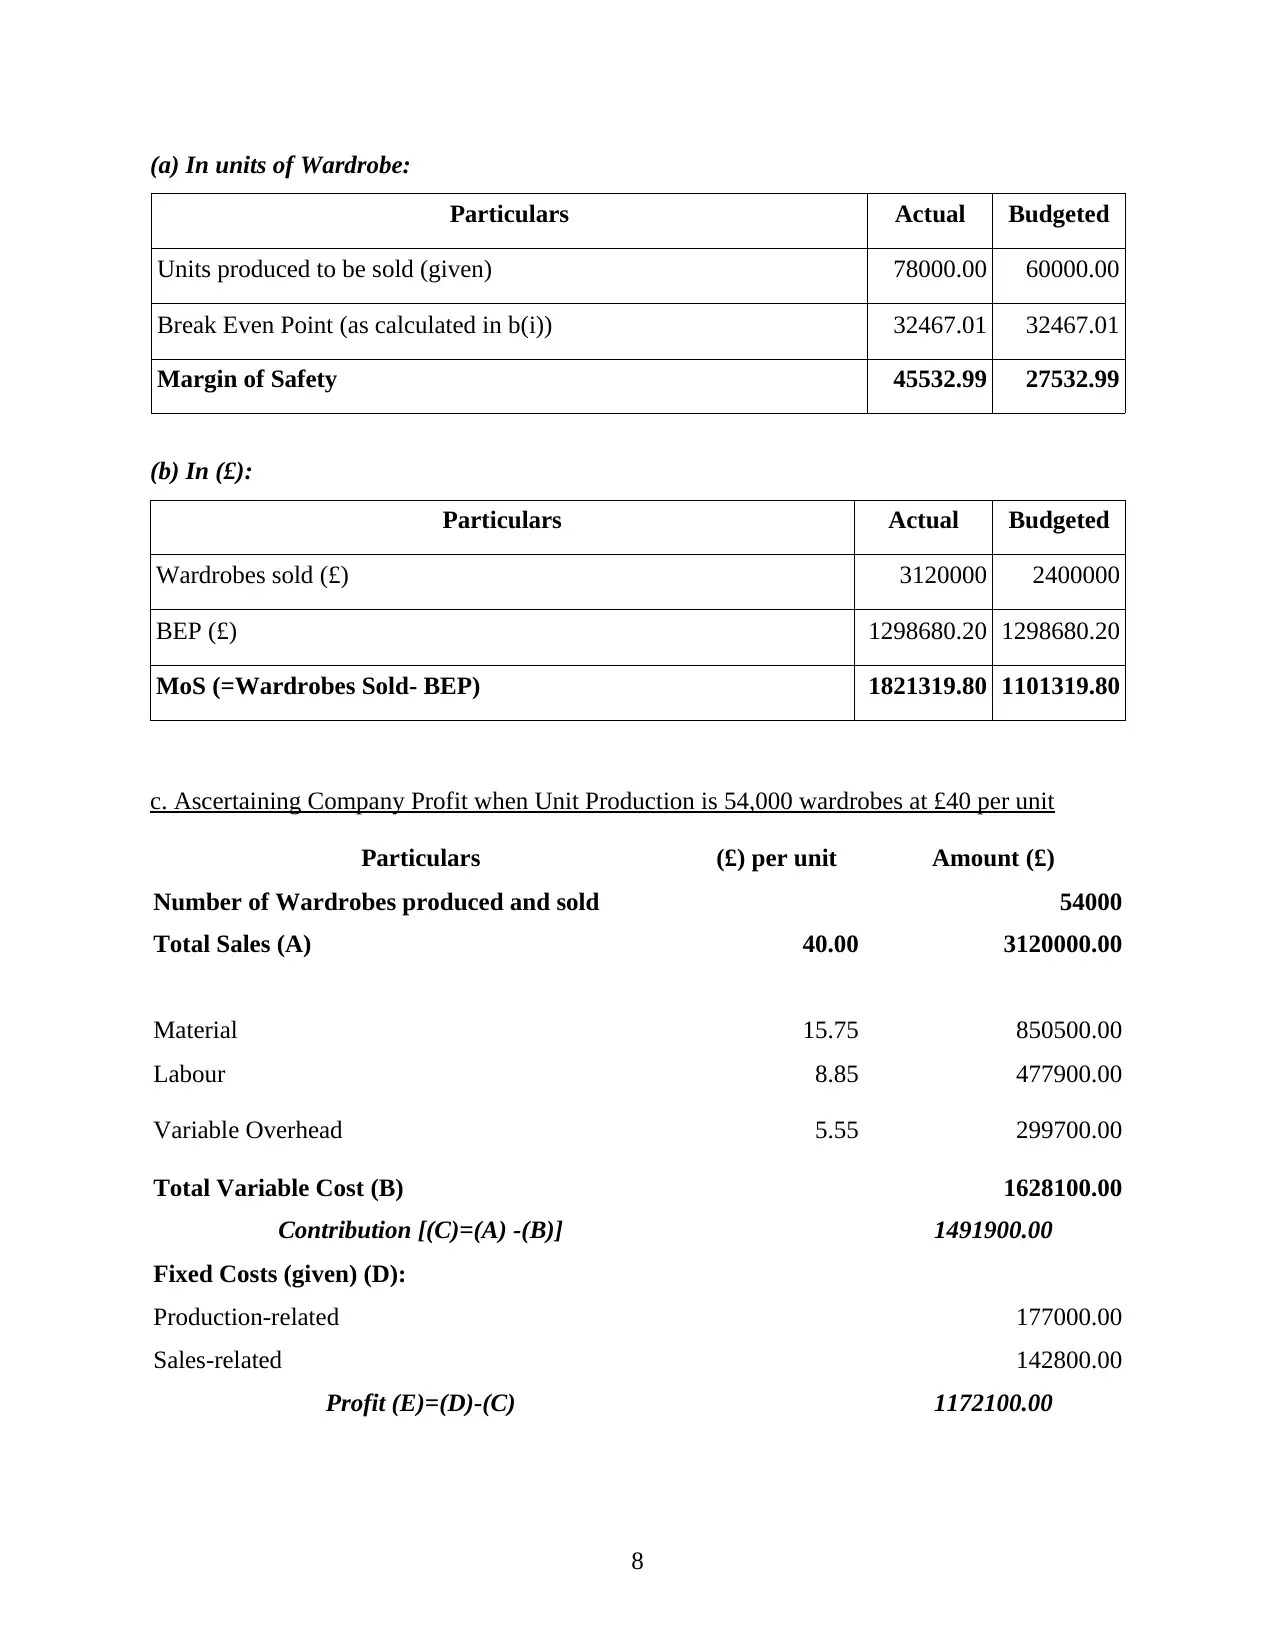
(a) In units of Wardrobe:
Particulars Actual Budgeted
Units produced to be sold (given) 78000.00 60000.00
Break Even Point (as calculated in b(i)) 32467.01 32467.01
Margin of Safety 45532.99 27532.99
(b) In (£):
Particulars Actual Budgeted
Wardrobes sold (£) 3120000 2400000
BEP (£) 1298680.20 1298680.20
MoS (=Wardrobes Sold- BEP) 1821319.80 1101319.80
c. Ascertaining Company Profit when Unit Production is 54,000 wardrobes at £40 per unit
Particulars (£) per unit Amount (£)
Number of Wardrobes produced and sold 54000
Total Sales (A) 40.00 3120000.00
Material 15.75 850500.00
Labour 8.85 477900.00
Variable Overhead 5.55 299700.00
Total Variable Cost (B) 1628100.00
Contribution [(C)=(A) -(B)] 1491900.00
Fixed Costs (given) (D):
Production-related 177000.00
Sales-related 142800.00
Profit (E)=(D)-(C) 1172100.00
8
Particulars Actual Budgeted
Units produced to be sold (given) 78000.00 60000.00
Break Even Point (as calculated in b(i)) 32467.01 32467.01
Margin of Safety 45532.99 27532.99
(b) In (£):
Particulars Actual Budgeted
Wardrobes sold (£) 3120000 2400000
BEP (£) 1298680.20 1298680.20
MoS (=Wardrobes Sold- BEP) 1821319.80 1101319.80
c. Ascertaining Company Profit when Unit Production is 54,000 wardrobes at £40 per unit
Particulars (£) per unit Amount (£)
Number of Wardrobes produced and sold 54000
Total Sales (A) 40.00 3120000.00
Material 15.75 850500.00
Labour 8.85 477900.00
Variable Overhead 5.55 299700.00
Total Variable Cost (B) 1628100.00
Contribution [(C)=(A) -(B)] 1491900.00
Fixed Costs (given) (D):
Production-related 177000.00
Sales-related 142800.00
Profit (E)=(D)-(C) 1172100.00
8
Paraphrase This Document
Need a fresh take? Get an instant paraphrase of this document with our AI Paraphraser
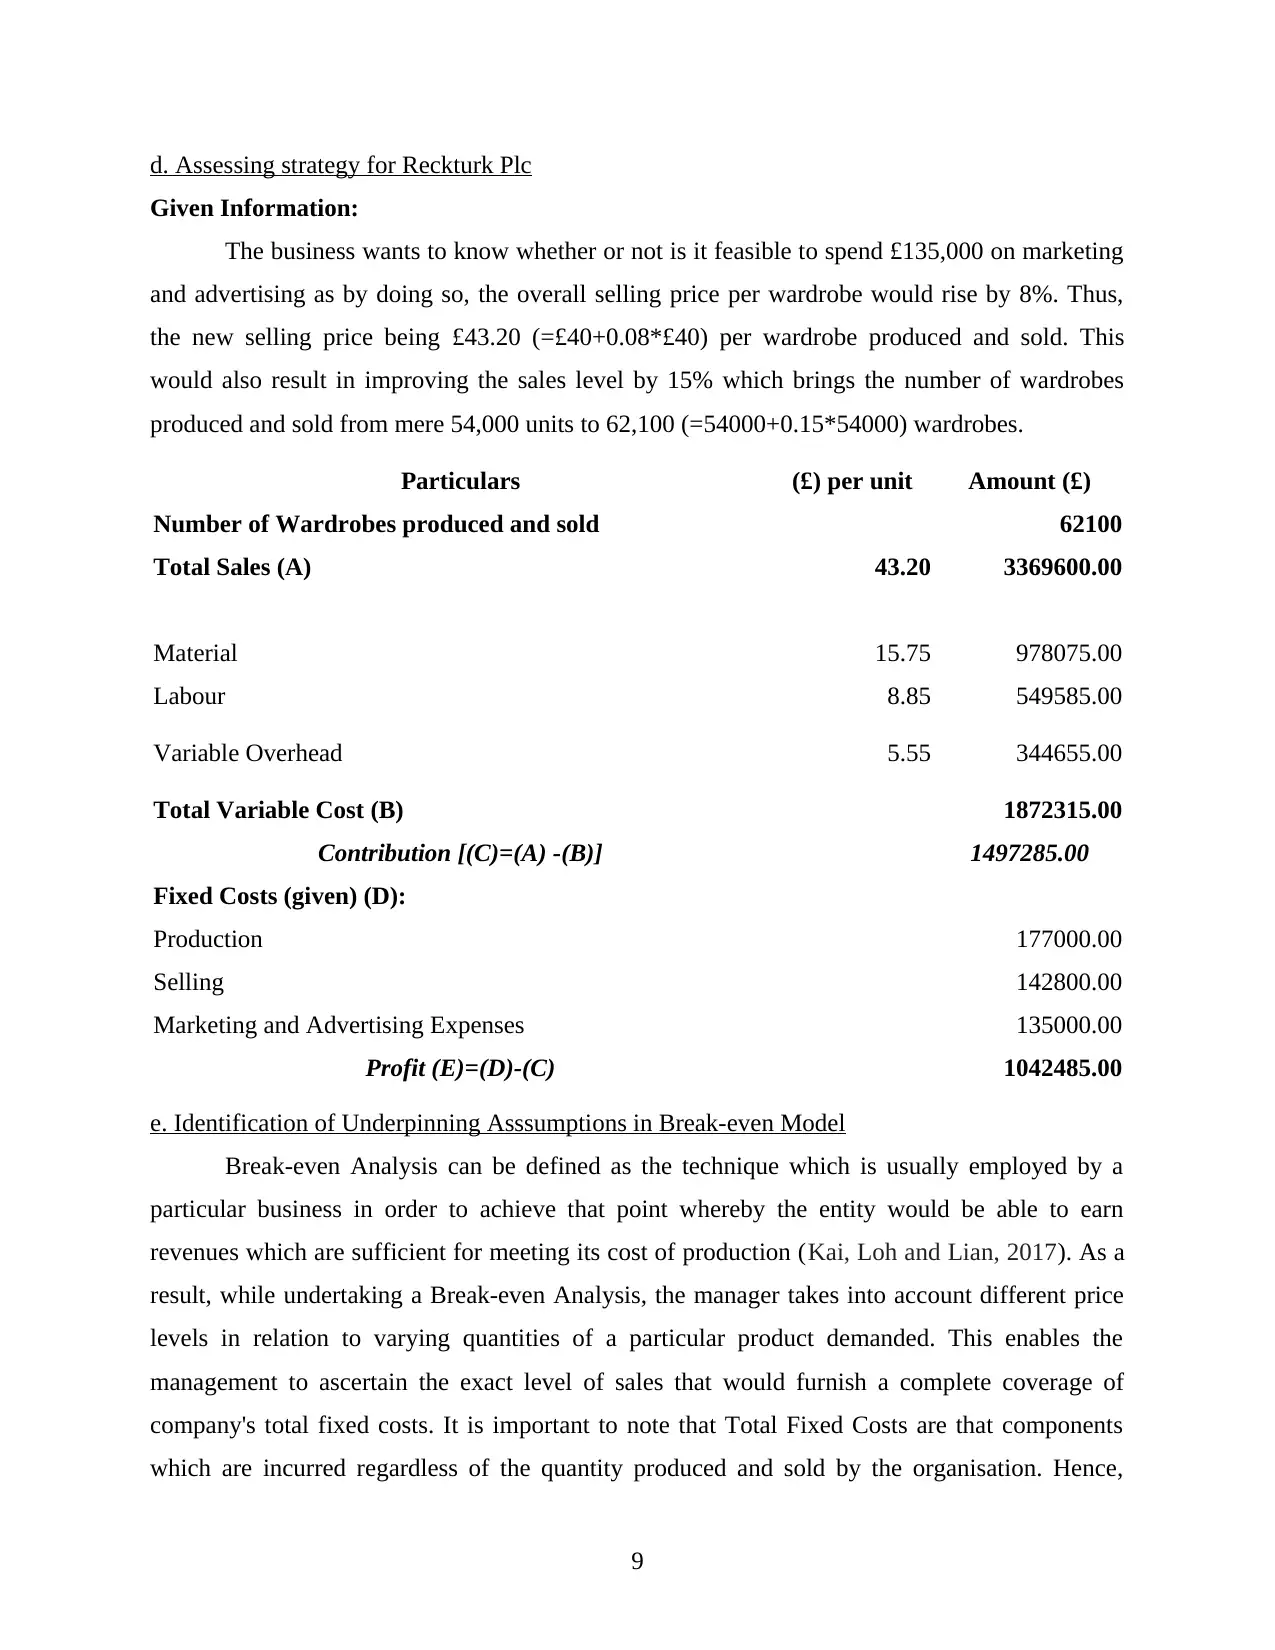
d. Assessing strategy for Reckturk Plc
Given Information:
The business wants to know whether or not is it feasible to spend £135,000 on marketing
and advertising as by doing so, the overall selling price per wardrobe would rise by 8%. Thus,
the new selling price being £43.20 (=£40+0.08*£40) per wardrobe produced and sold. This
would also result in improving the sales level by 15% which brings the number of wardrobes
produced and sold from mere 54,000 units to 62,100 (=54000+0.15*54000) wardrobes.
Particulars (£) per unit Amount (£)
Number of Wardrobes produced and sold 62100
Total Sales (A) 43.20 3369600.00
Material 15.75 978075.00
Labour 8.85 549585.00
Variable Overhead 5.55 344655.00
Total Variable Cost (B) 1872315.00
Contribution [(C)=(A) -(B)] 1497285.00
Fixed Costs (given) (D):
Production 177000.00
Selling 142800.00
Marketing and Advertising Expenses 135000.00
Profit (E)=(D)-(C) 1042485.00
e. Identification of Underpinning Asssumptions in Break-even Model
Break-even Analysis can be defined as the technique which is usually employed by a
particular business in order to achieve that point whereby the entity would be able to earn
revenues which are sufficient for meeting its cost of production (Kai, Loh and Lian, 2017). As a
result, while undertaking a Break-even Analysis, the manager takes into account different price
levels in relation to varying quantities of a particular product demanded. This enables the
management to ascertain the exact level of sales that would furnish a complete coverage of
company's total fixed costs. It is important to note that Total Fixed Costs are that components
which are incurred regardless of the quantity produced and sold by the organisation. Hence,
9
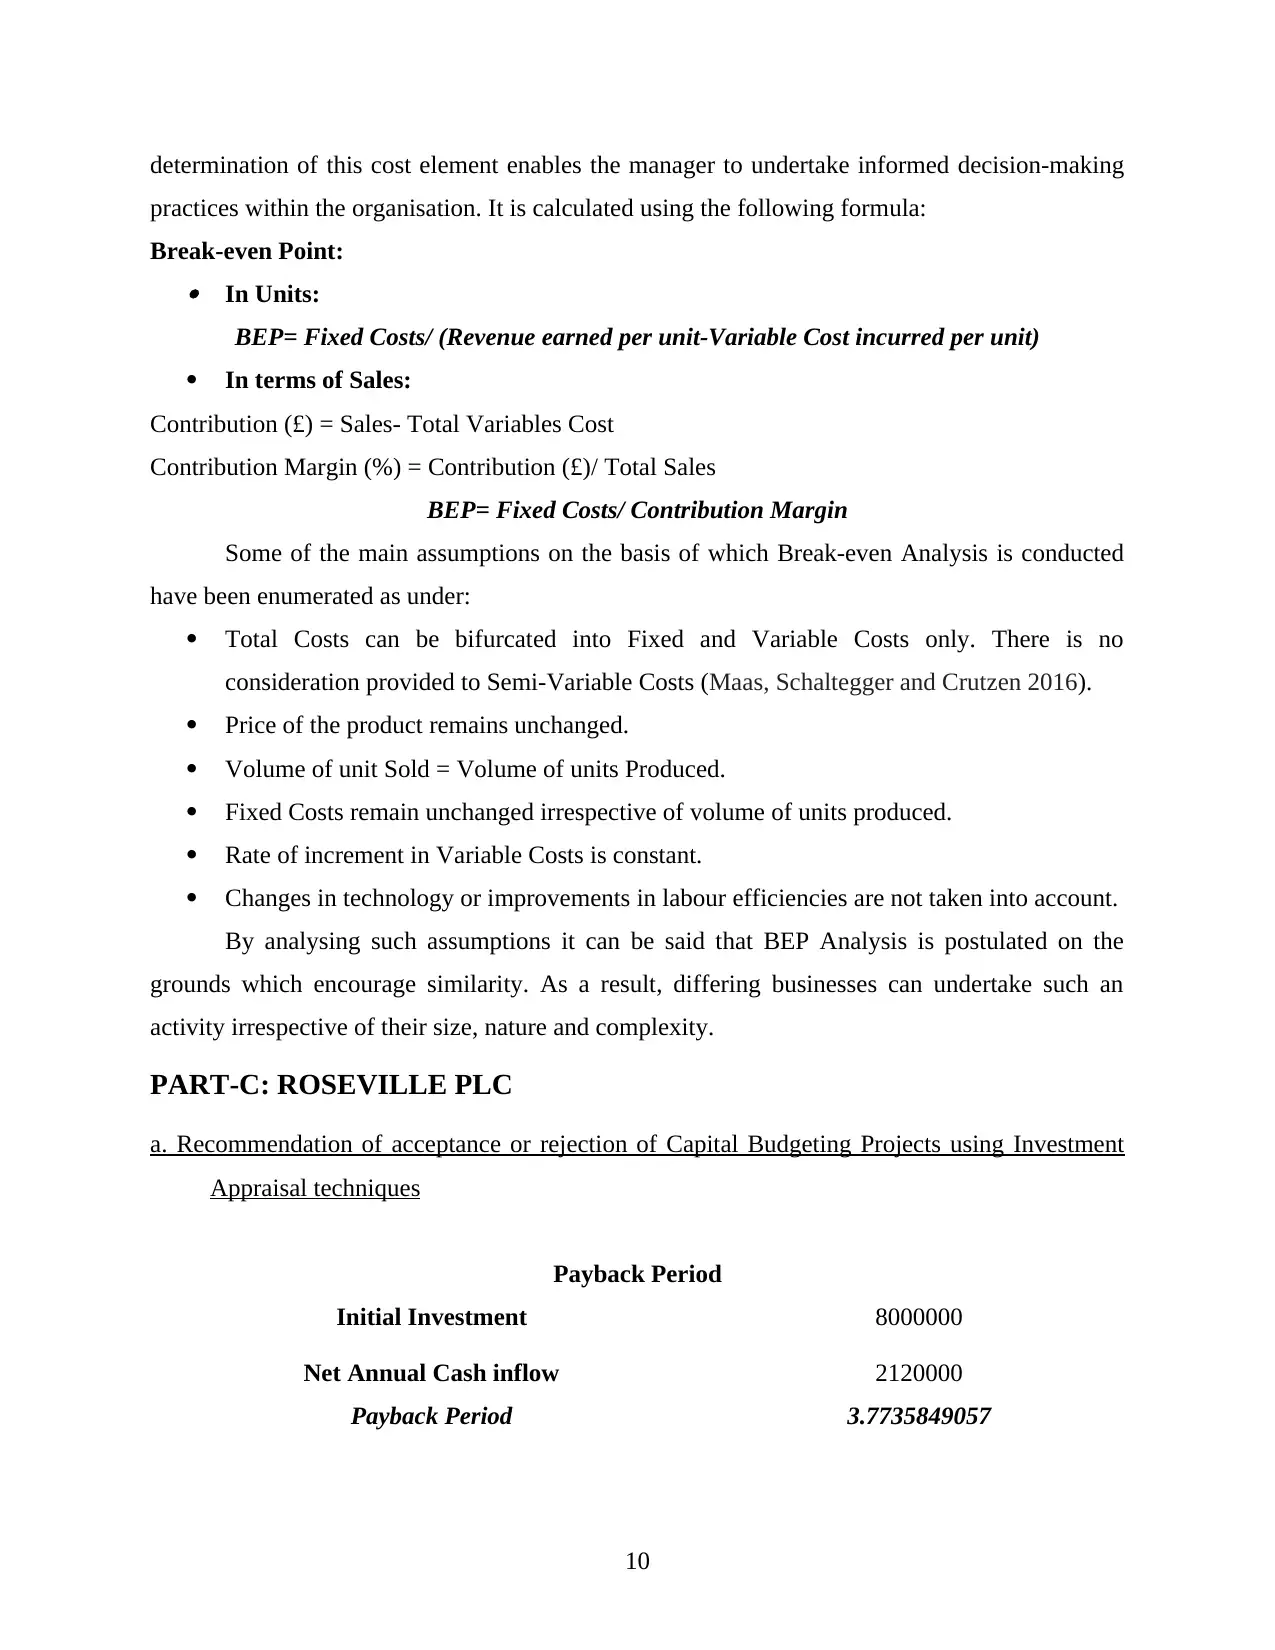
determination of this cost element enables the manager to undertake informed decision-making
practices within the organisation. It is calculated using the following formula:
Break-even Point: In Units:
BEP= Fixed Costs/ (Revenue earned per unit-Variable Cost incurred per unit)
In terms of Sales:
Contribution (£) = Sales- Total Variables Cost
Contribution Margin (%) = Contribution (£)/ Total Sales
BEP= Fixed Costs/ Contribution Margin
Some of the main assumptions on the basis of which Break-even Analysis is conducted
have been enumerated as under:
Total Costs can be bifurcated into Fixed and Variable Costs only. There is no
consideration provided to Semi-Variable Costs (Maas, Schaltegger and Crutzen 2016).
Price of the product remains unchanged.
Volume of unit Sold = Volume of units Produced.
Fixed Costs remain unchanged irrespective of volume of units produced.
Rate of increment in Variable Costs is constant.
Changes in technology or improvements in labour efficiencies are not taken into account.
By analysing such assumptions it can be said that BEP Analysis is postulated on the
grounds which encourage similarity. As a result, differing businesses can undertake such an
activity irrespective of their size, nature and complexity.
PART-C: ROSEVILLE PLC
a. Recommendation of acceptance or rejection of Capital Budgeting Projects using Investment
Appraisal techniques
Payback Period
Initial Investment 8000000
Net Annual Cash inflow 2120000
Payback Period 3.7735849057
10
⊘ This is a preview!⊘
Do you want full access?
Subscribe today to unlock all pages.
Trusted by 1+ million students worldwide
1 out of 17
Related Documents


Your All-in-One AI-Powered Toolkit for Academic Success.
+13062052269
info@desklib.com
Available 24*7 on WhatsApp / Email
![[object Object]](/_next/static/media/star-bottom.7253800d.svg)
Unlock your academic potential
Copyright © 2020–2026 A2Z Services. All Rights Reserved. Developed and managed by ZUCOL.