Accounting & Finance for Managers: Next plc and H&M Performance Report
VerifiedAdded on 2019/12/28
|23
|6028
|23
Report
AI Summary
This report provides a comprehensive analysis of the financial performance of Next plc and Hennes & Mauritz. It begins with an introduction to accounting and financial aspects, emphasizing their importance in business success. The report then delves into a detailed comparison of the two companies using financial ratios, including profitability, liquidity, and efficiency ratios, analyzing trends from 2010 to 2015. The analysis covers current ratios, quick ratios, debt-equity ratios, asset turnover, inventory turnover, receivable turnover, gross profit margin, net profit margin, return on equity, and operating cash flow. The report also examines non-financial ratios such as revenue/employees and operating income/employees. Furthermore, the report discusses the limitations of financial ratios and concludes with an overview of investment appraisal techniques. This report helps investors and stakeholders make informed investment decisions by assessing the financial and non-financial aspects of the two companies. The report is a valuable resource for students and professionals seeking to understand financial analysis and company performance.

ACCOUNTING & FINANCE
FOR MANAGERS
FOR MANAGERS
Paraphrase This Document
Need a fresh take? Get an instant paraphrase of this document with our AI Paraphraser
TABLE OF CONTENTS
INTRODUCTION...........................................................................................................................1
QUESTION 1...................................................................................................................................1
1. Analysis of financial and non-financial ratios of Next plc and Hennes & Mauritz..........1
2. Using charts for making comparison of two companies....................................................4
3. Recommendations for improvement in the performance...................................................7
4. Limitations of financial ratios............................................................................................8
QUESTION 2...................................................................................................................................9
1. Use of investment appraisal techniques.............................................................................9
2. Limitations of capital budgeting tools..............................................................................12
CONCLUSION..............................................................................................................................13
REFERENCES..............................................................................................................................14
INTRODUCTION
Accounting and financial aspects are the main parts of a business organization which
plays a vital role in the growth and success of it. Finance manager of the firm has responsibility
to make effectual decisions which aid in the productivity and profitability of firm. In this,
investment appraisal techniques provide assistance to the firm in making suitable decisions.
Further, ratio is also the most effective financial tool through which investor can make most
profitable business decision. In the present report, financial and non-financial ratios of two
companies such as Next plc and Hennes & Mauritz will be analyzed. The main objective of this
report is to make assessment of the financial and non-financial aspects. It enables investors and
other stakeholders to make suitable investment decision. Besides this, report will also shed light
on investment appraisal techniques which assists Hilltop limited in making investment decisions.
QUESTION 1
1. Analysis of financial and non-financial ratios of Next plc and Hennes & Mauritz
Financial ratios include profitability, liquidity and efficiency ratios etc. which help in
analyzing the financial health and performance of the firm. Analysis of the financial ratios of
Next plc and Hennes and Mauritz are as follows:
Financial ratios: In this, financial statements of the firm area analyzed by the manager
with the help of profitability, liquidity, solvency and efficiency ratios. By this, company is able
to make comparison of its strategies which are employed them during the each accounting year.
In addition to this, it also facilitates comparison of the financial performance of one organization
with another one.
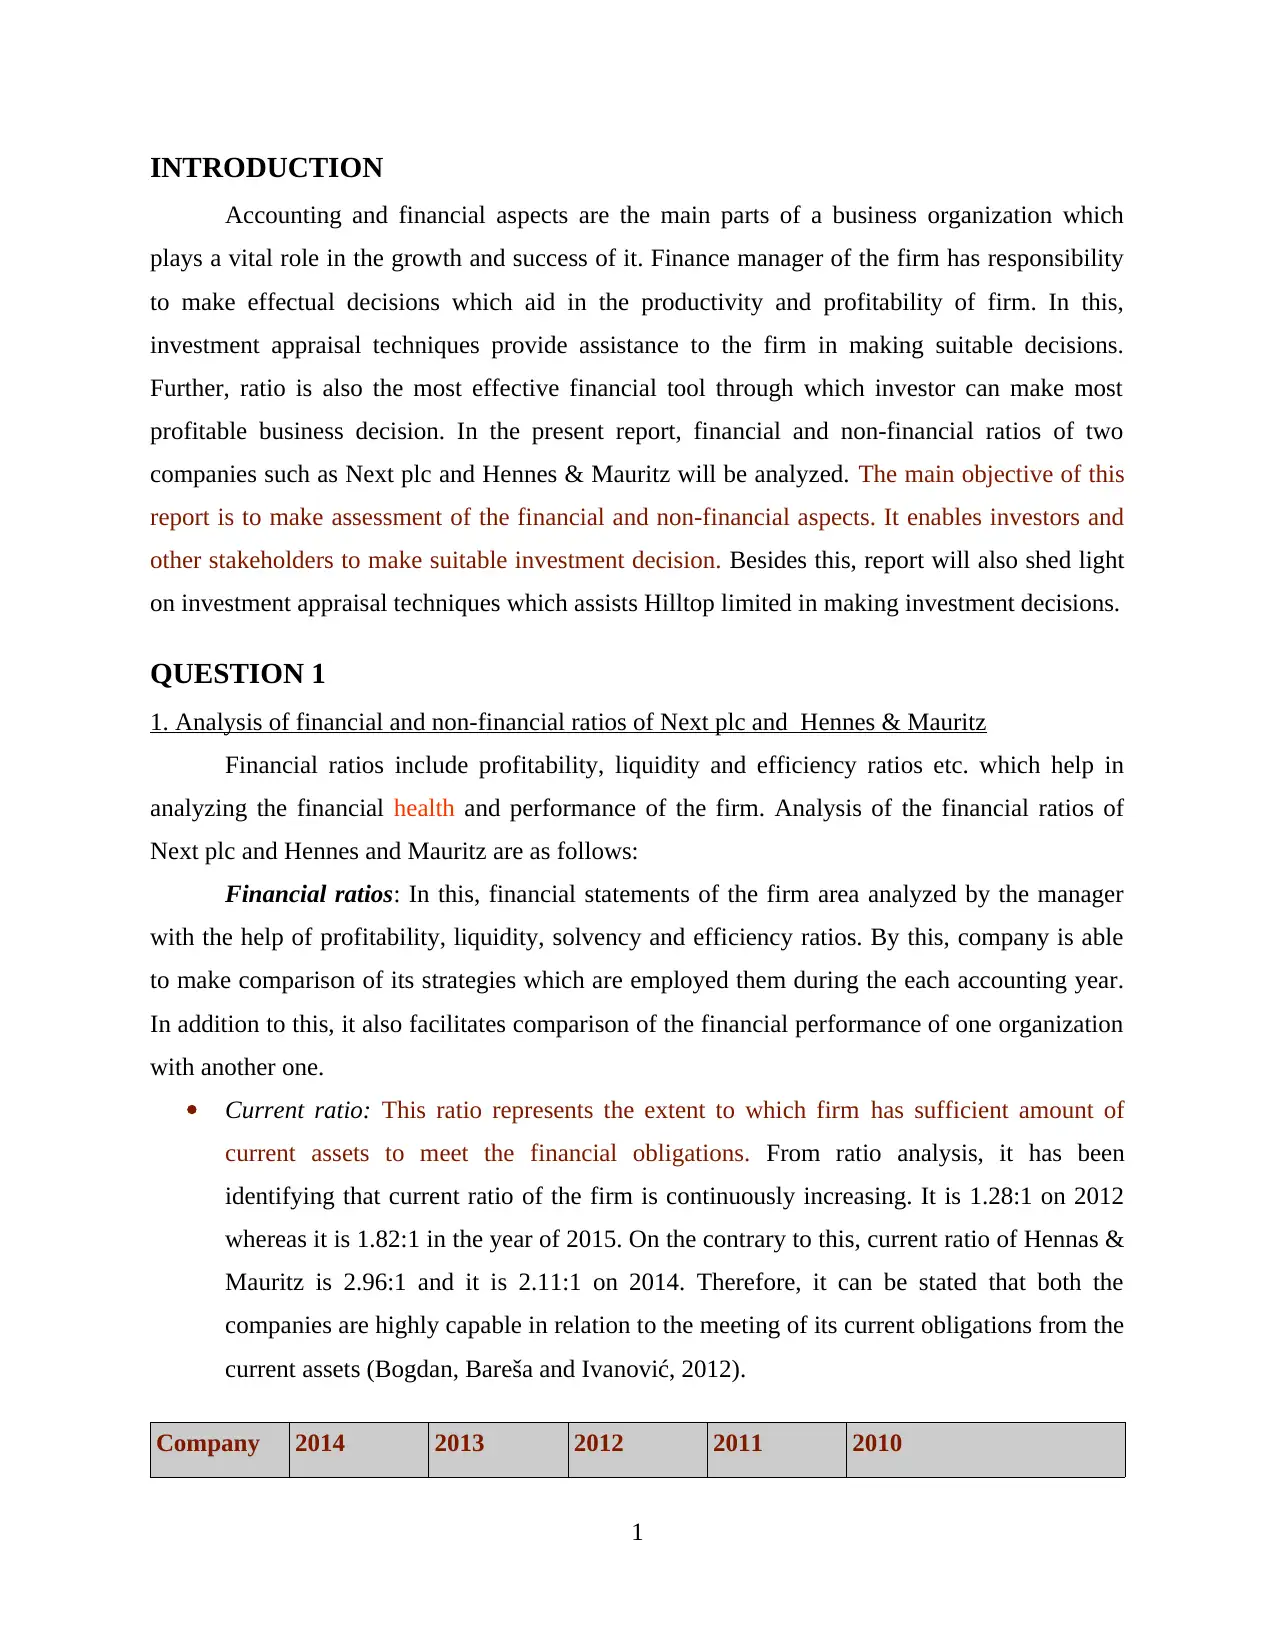
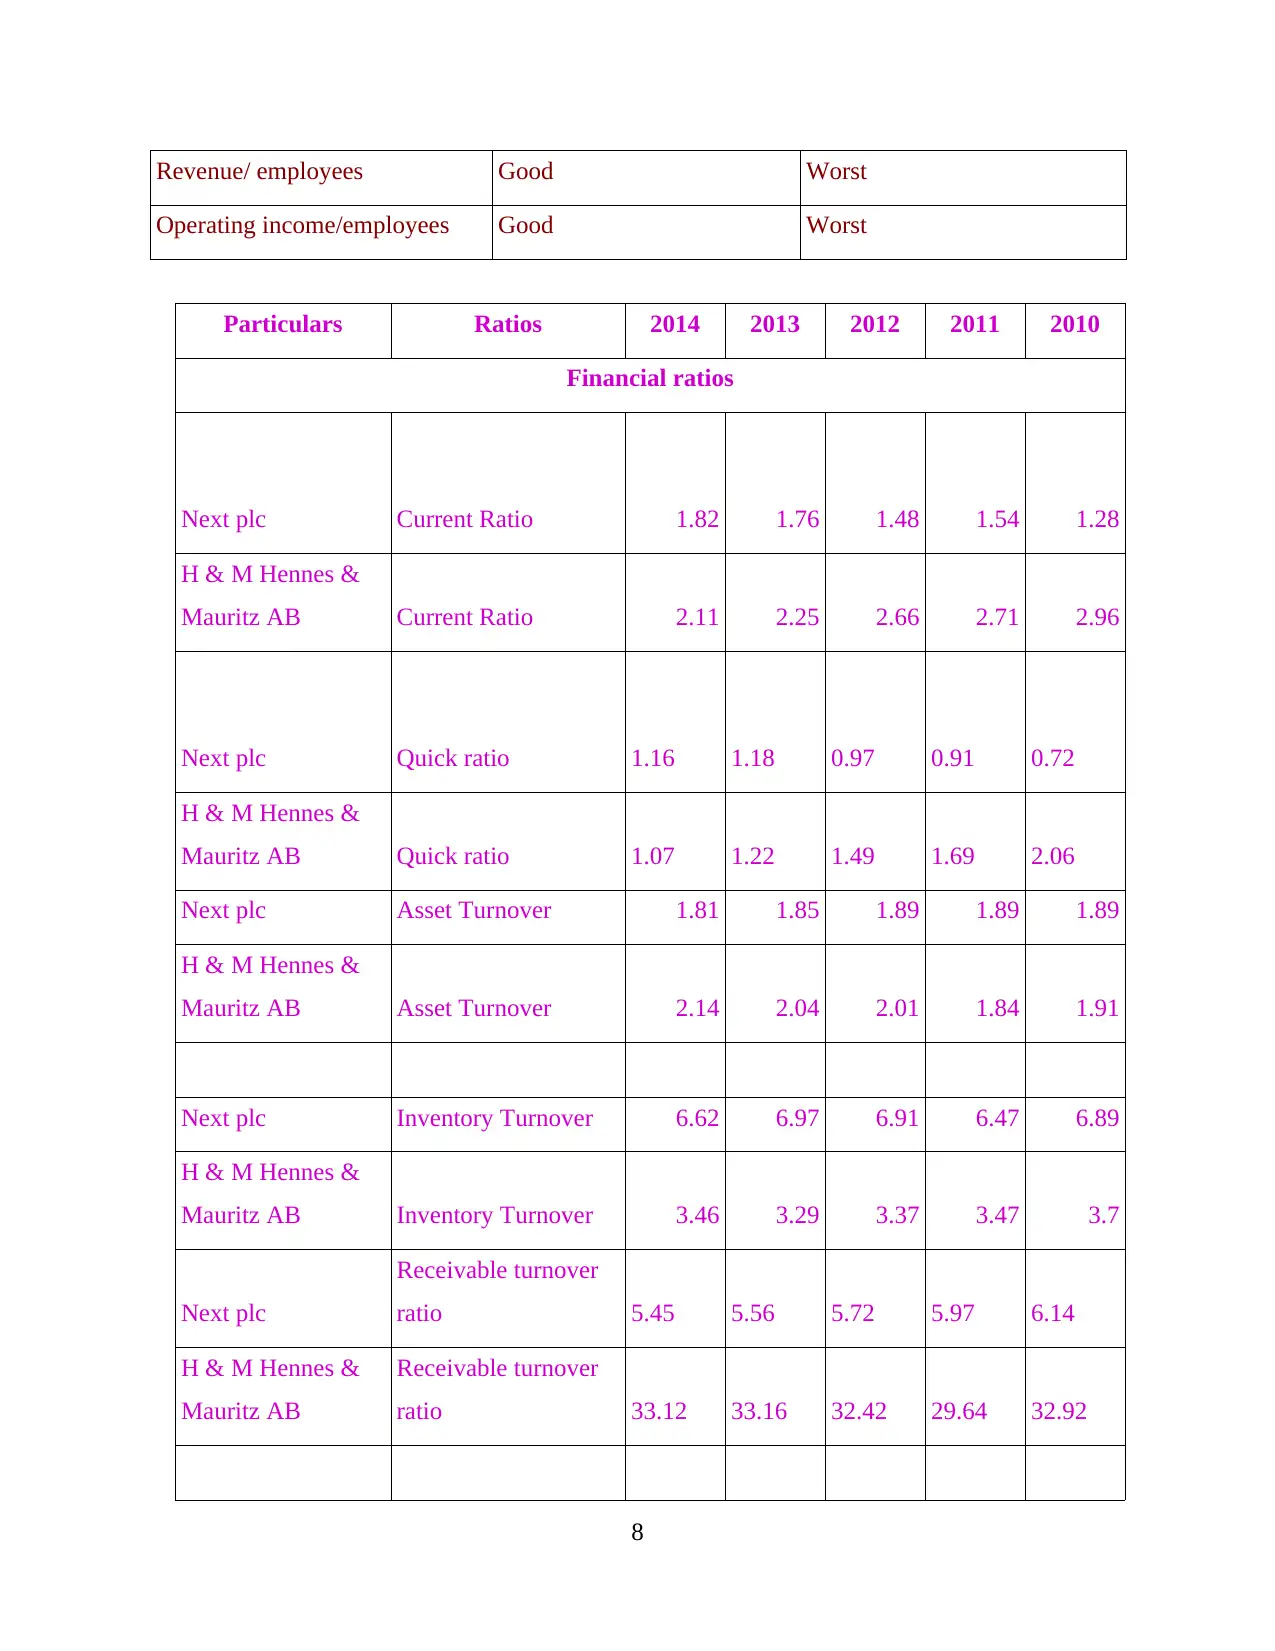
Current ratio: This ratio represents the extent to which firm has sufficient amount of
current assets to meet the financial obligations. From ratio analysis, it has been
identifying that current ratio of the firm is continuously increasing. It is 1.28:1 on 2012
whereas it is 1.82:1 in the year of 2015. On the contrary to this, current ratio of Hennas &
Mauritz is 2.96:1 and it is 2.11:1 on 2014. Therefore, it can be stated that both the
companies are highly capable in relation to the meeting of its current obligations from the
current assets (Bogdan, Bareša and Ivanović, 2012).
Company 2014 2013 2012 2011 2010
1
Accounting and financial aspects are the main parts of a business organization which
plays a vital role in the growth and success of it. Finance manager of the firm has responsibility
to make effectual decisions which aid in the productivity and profitability of firm. In this,
investment appraisal techniques provide assistance to the firm in making suitable decisions.
Further, ratio is also the most effective financial tool through which investor can make most
profitable business decision. In the present report, financial and non-financial ratios of two
companies such as Next plc and Hennes & Mauritz will be analyzed. The main objective of this
report is to make assessment of the financial and non-financial aspects. It enables investors and
other stakeholders to make suitable investment decision. Besides this, report will also shed light
on investment appraisal techniques which assists Hilltop limited in making investment decisions.
QUESTION 1
1. Analysis of financial and non-financial ratios of Next plc and Hennes & Mauritz
Financial ratios include profitability, liquidity and efficiency ratios etc. which help in
analyzing the financial health and performance of the firm. Analysis of the financial ratios of
Next plc and Hennes and Mauritz are as follows:
Financial ratios: In this, financial statements of the firm area analyzed by the manager
with the help of profitability, liquidity, solvency and efficiency ratios. By this, company is able
to make comparison of its strategies which are employed them during the each accounting year.
In addition to this, it also facilitates comparison of the financial performance of one organization
with another one.
Current ratio: This ratio represents the extent to which firm has sufficient amount of
current assets to meet the financial obligations. From ratio analysis, it has been
identifying that current ratio of the firm is continuously increasing. It is 1.28:1 on 2012
whereas it is 1.82:1 in the year of 2015. On the contrary to this, current ratio of Hennas &
Mauritz is 2.96:1 and it is 2.11:1 on 2014. Therefore, it can be stated that both the
companies are highly capable in relation to the meeting of its current obligations from the
current assets (Bogdan, Bareša and Ivanović, 2012).
Company 2014 2013 2012 2011 2010
1
⊘ This is a preview!⊘
Do you want full access?
Subscribe today to unlock all pages.
Trusted by 1+ million students worldwide
Next plc 1.82 1.76 1.48 1.54 1.28
H&M 2.11 2.25 2.66 2.71 2.96
Quick ratio: This ratio entails the level to which company can quickly convert its current
assets to meet the financial obligations. As compared to previous years quick ratio of
Next plc is 1.16:1 which shows decreasing trend. It shows that company is starting to
invest money in the other productive activities. Thus, it is one of the main cause due to
which current assets of the firm except stock and prepaid expenses are decreasing. In
addition to this, quick ratio of Hennes & Mauritz is 1.07:1 in the financial year 2014.
Acid test ratio of both the firms exceed ideal quick ratio which is .5:1. This aspect reflects
that both the companies have large amount of current assets which can be easily
convertible into cash (Goyenko, Holden and Trzcinka, 2009).
Company 2014 2013 2012 2011 2010
Next plc 1.16 1.18 0.97 0.91 0.72
H&M 1.07 1.22 1.49 1.69 2.06
Debt-equity ratio: It provides information about the extent to which finance is raised by
the firm through debt and equity. Financial structure of Next plc shows continuously
fluctuating in the performance. Debt-equity ratio of Next plc lies between 2.31 to 2.96. In
the year of 2015, debt-equity ratio of the firm is 2.61:1. Thus, this ratio clearly shows that
company have fulfilled moreover, it financial needs from debt instruments rather than
equity.
Company 2014 2013 2012 2011 2010
Next plc 0.72 0.74 0.70 0.75 0.72
H&M - - - - -
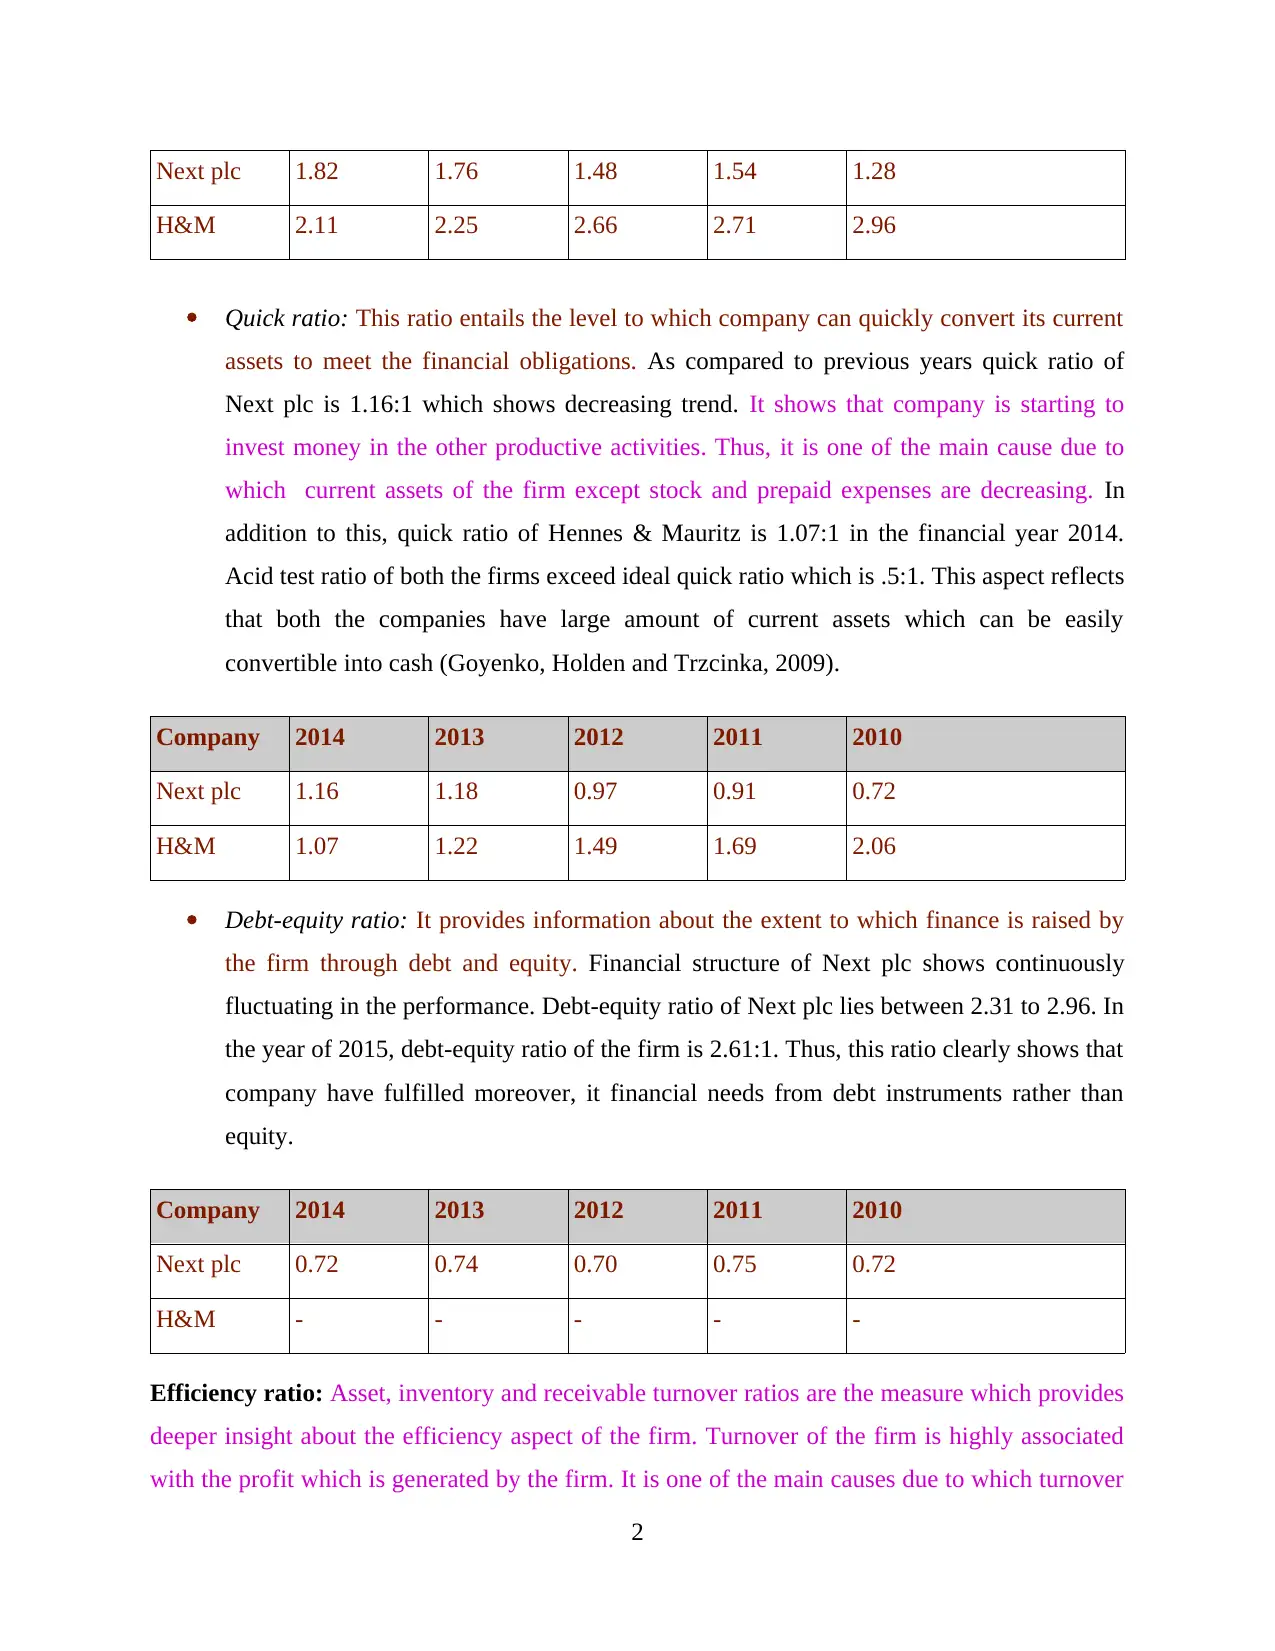
Efficiency ratio: Asset, inventory and receivable turnover ratios are the measure which provides
deeper insight about the efficiency aspect of the firm. Turnover of the firm is highly associated
with the profit which is generated by the firm. It is one of the main causes due to which turnover
2
H&M 2.11 2.25 2.66 2.71 2.96
Quick ratio: This ratio entails the level to which company can quickly convert its current
assets to meet the financial obligations. As compared to previous years quick ratio of
Next plc is 1.16:1 which shows decreasing trend. It shows that company is starting to
invest money in the other productive activities. Thus, it is one of the main cause due to
which current assets of the firm except stock and prepaid expenses are decreasing. In
addition to this, quick ratio of Hennes & Mauritz is 1.07:1 in the financial year 2014.
Acid test ratio of both the firms exceed ideal quick ratio which is .5:1. This aspect reflects
that both the companies have large amount of current assets which can be easily
convertible into cash (Goyenko, Holden and Trzcinka, 2009).
Company 2014 2013 2012 2011 2010
Next plc 1.16 1.18 0.97 0.91 0.72
H&M 1.07 1.22 1.49 1.69 2.06
Debt-equity ratio: It provides information about the extent to which finance is raised by
the firm through debt and equity. Financial structure of Next plc shows continuously
fluctuating in the performance. Debt-equity ratio of Next plc lies between 2.31 to 2.96. In
the year of 2015, debt-equity ratio of the firm is 2.61:1. Thus, this ratio clearly shows that
company have fulfilled moreover, it financial needs from debt instruments rather than
equity.
Company 2014 2013 2012 2011 2010
Next plc 0.72 0.74 0.70 0.75 0.72
H&M - - - - -
Efficiency ratio: Asset, inventory and receivable turnover ratios are the measure which provides
deeper insight about the efficiency aspect of the firm. Turnover of the firm is highly associated
with the profit which is generated by the firm. It is one of the main causes due to which turnover
2
Paraphrase This Document
Need a fresh take? Get an instant paraphrase of this document with our AI Paraphraser
ratio is undertaken for the purpose of evaluation. These are ratio are highly significant which
helps hem in assessing the extent to which business success in generating sales from assets and
inventory. Besides this, receivable turnover ratio entails the information about the days for which
company needs to wait for collecting or getting the payment of credit sales. Through this,
company is able to make planning for the future more effectively and efficiently.
Asset turnover ratio: This measure provides information about the sales which is
generated by the firm by making utilization of assets. During the financial period of 2011
to 2013 asset turnover ratio of Next plc is constant which is 1.89:1. In comparison to this,
asset turnover ratio of the firm is 1.81:1 in the accounting year of 2015. It represents that
in the year of 2014 and 2015 company fails to generate high amount of sales. On the
contrary to this, asset turnover ratio of Hennes & Mauritz is continuously increasing.
Thus, it can be said that strategic framework of Hennes & Mauritz is very sound.
Company 2014 2013 2012 2011 2010
Next plc 1.81 1.85 1.89 1.89 1.89
H&M 2.14 2.04 2.01 1.84 1.91
Inventory turnover ratio: It reflects the number of times inventory is sold and used during
the year. Next plc inventory turnover ratio is 6.62:1 in the year of 2015. Whereas, in the
period of 2015 stock turnover ratio of Hennes & Mauritz is 3.46. On the basis of this
aspect, it can be assessed that Next plc have made of its inventory more effectively and
efficiently (Hays, DeLurgio and Gilbert, 2009).
Company 2014 2013 2012 2011 2010
Next plc 6.62 6.97 6.91 6.47 6.89
H&M 3.46 3.29 3.37 3.47 3.70
Receivable turnover ratio: It provides deeper insight about the frequency in which
company receives payment from their debtors. This ratio of both the firms is declined
which reflects that companies are able to receive its payment within the less period.
Through this, companies are able to carry out its business operations more smoothly.
3
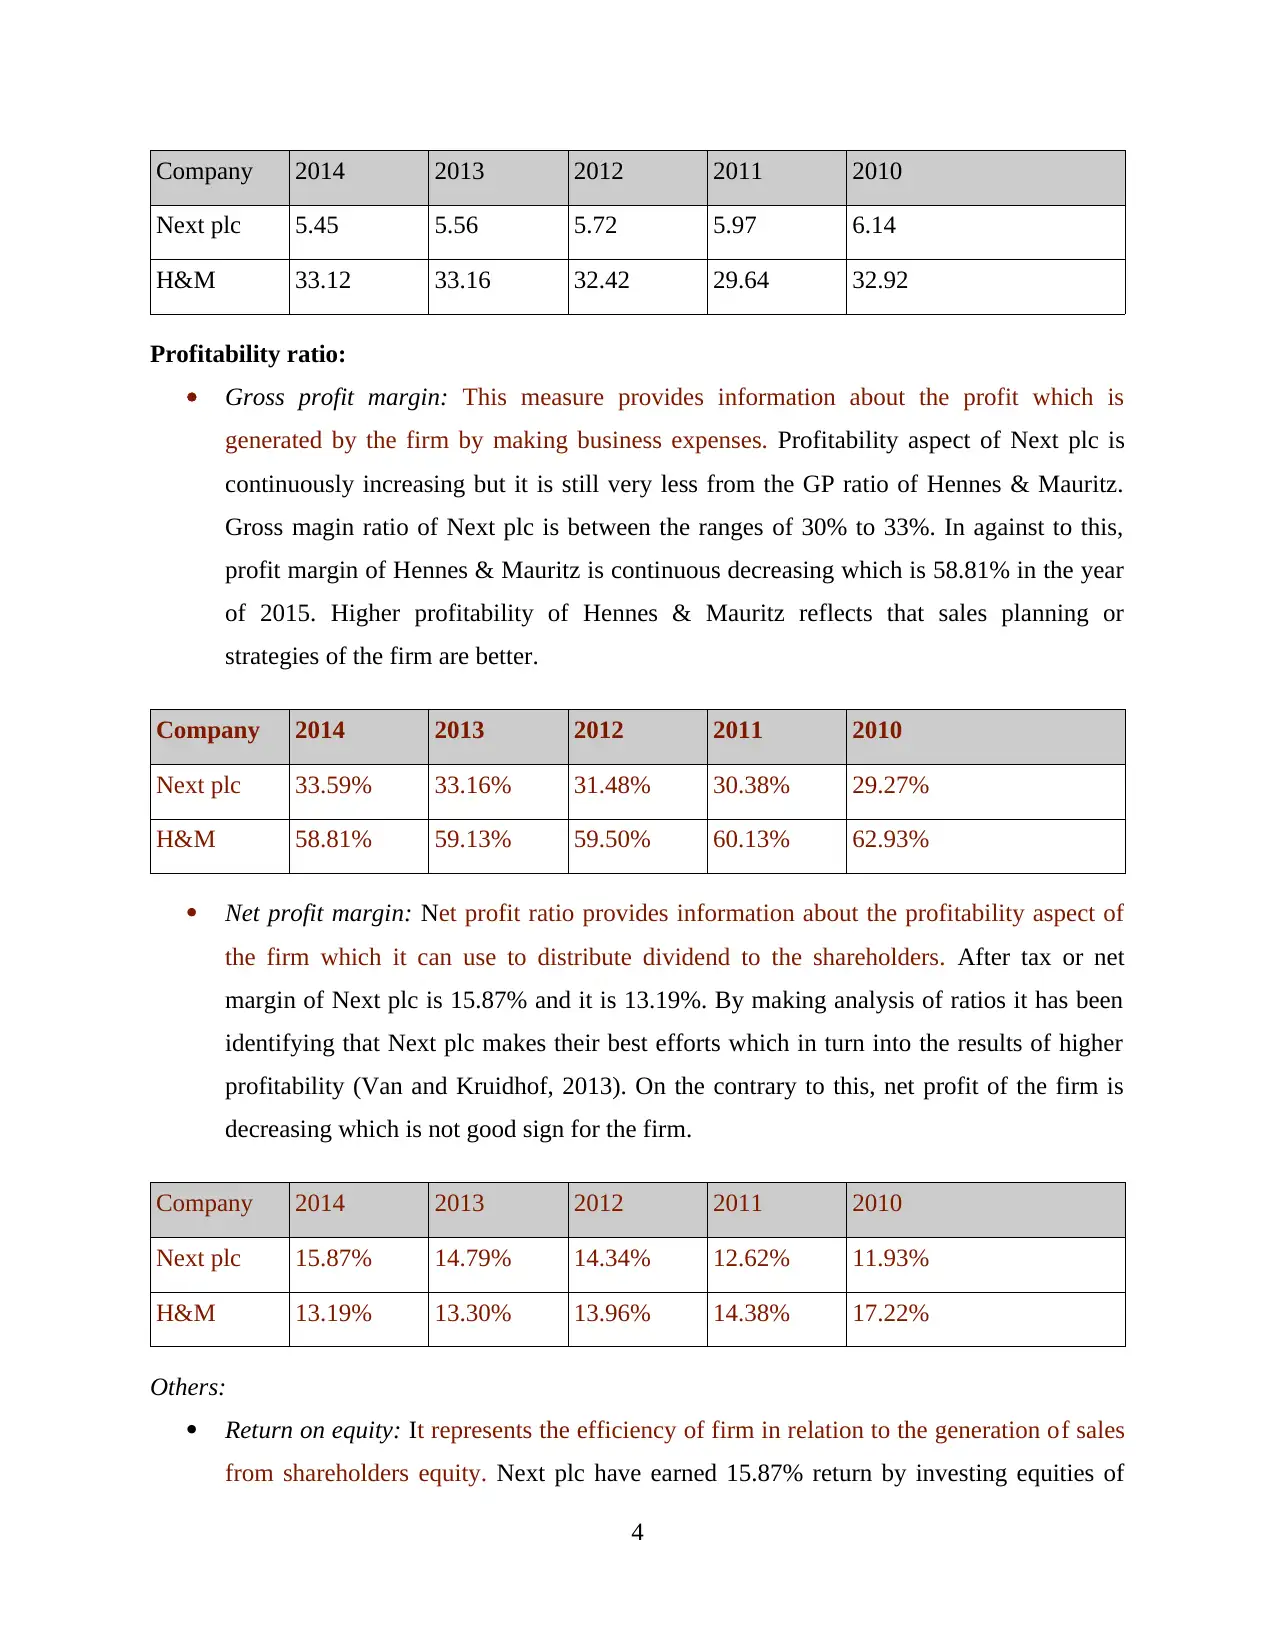
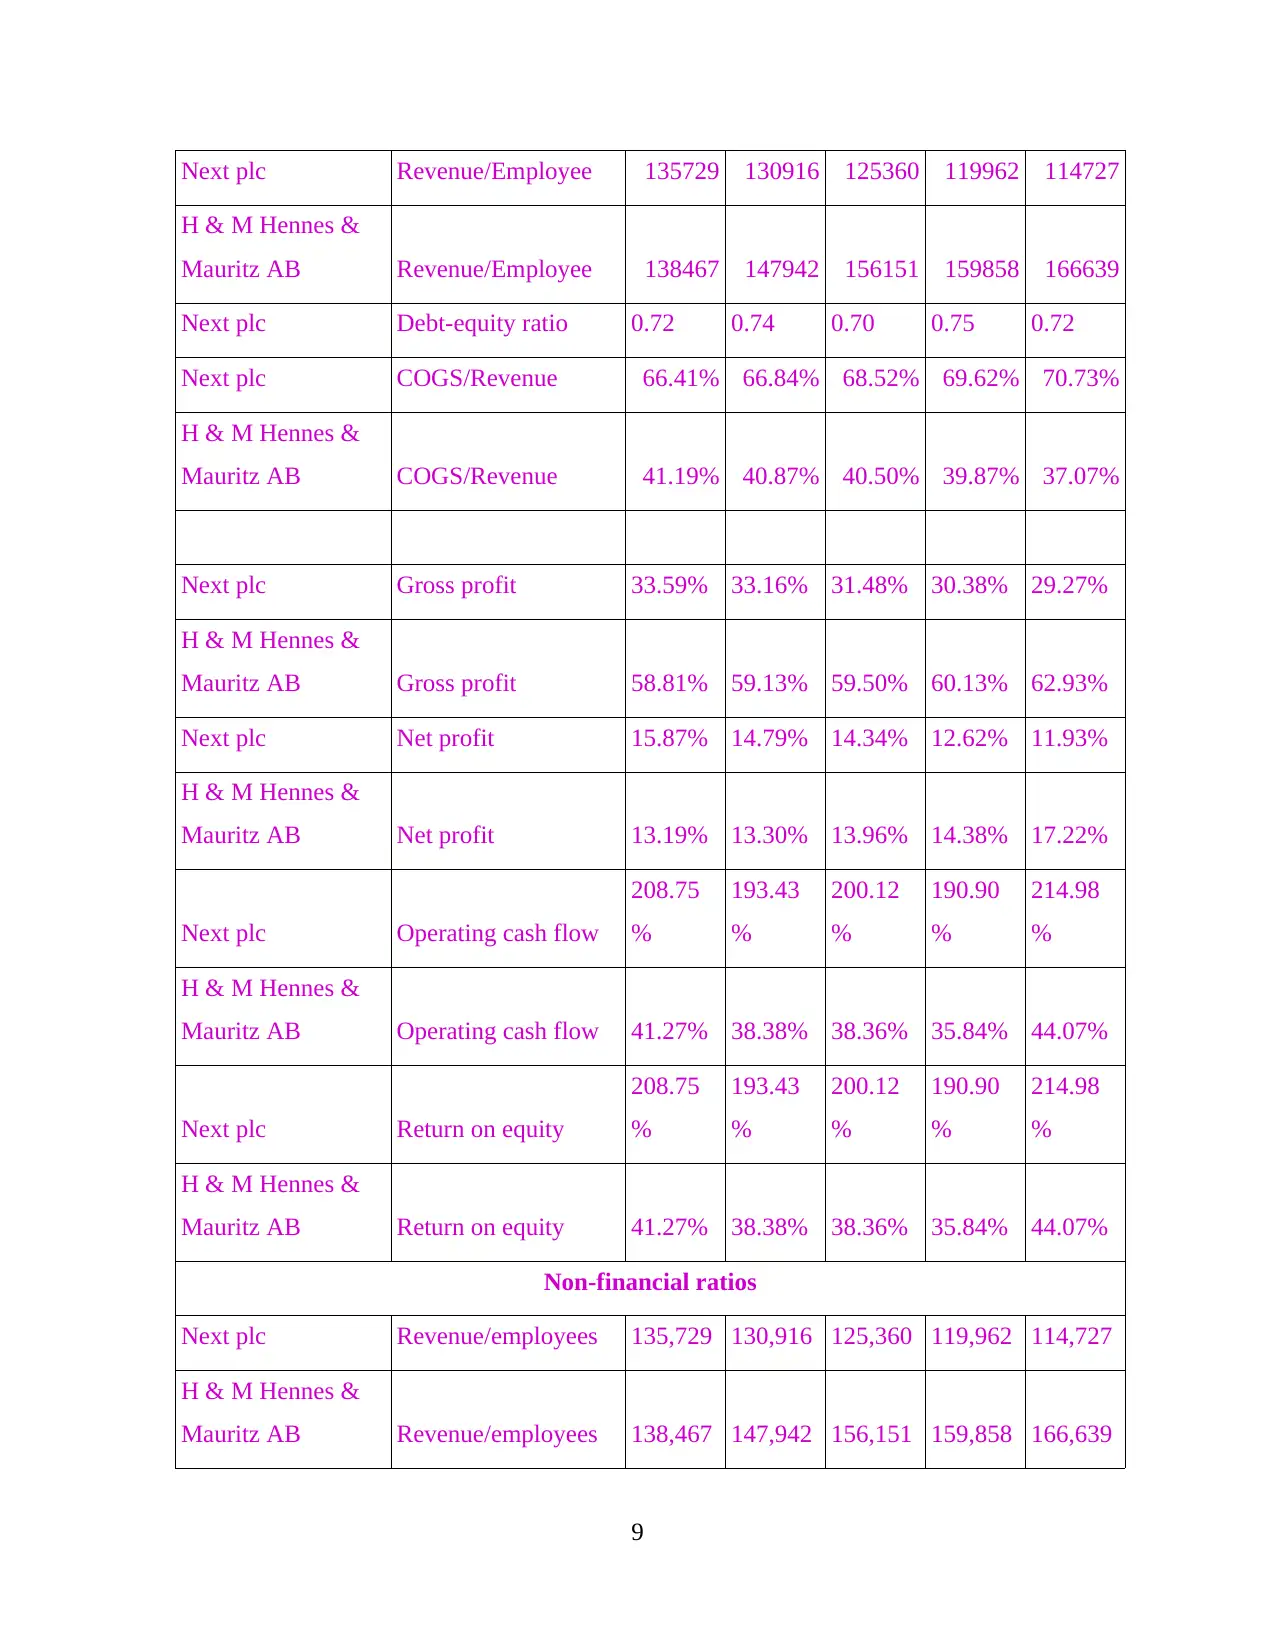
Company 2014 2013 2012 2011 2010
Next plc 5.45 5.56 5.72 5.97 6.14
H&M 33.12 33.16 32.42 29.64 32.92
Profitability ratio:
Gross profit margin: This measure provides information about the profit which is
generated by the firm by making business expenses. Profitability aspect of Next plc is
continuously increasing but it is still very less from the GP ratio of Hennes & Mauritz.
Gross magin ratio of Next plc is between the ranges of 30% to 33%. In against to this,
profit margin of Hennes & Mauritz is continuous decreasing which is 58.81% in the year
of 2015. Higher profitability of Hennes & Mauritz reflects that sales planning or
strategies of the firm are better.
Company 2014 2013 2012 2011 2010
Next plc 33.59% 33.16% 31.48% 30.38% 29.27%
H&M 58.81% 59.13% 59.50% 60.13% 62.93%
Net profit margin: Net profit ratio provides information about the profitability aspect of
the firm which it can use to distribute dividend to the shareholders. After tax or net
margin of Next plc is 15.87% and it is 13.19%. By making analysis of ratios it has been
identifying that Next plc makes their best efforts which in turn into the results of higher
profitability (Van and Kruidhof, 2013). On the contrary to this, net profit of the firm is
decreasing which is not good sign for the firm.
Company 2014 2013 2012 2011 2010
Next plc 15.87% 14.79% 14.34% 12.62% 11.93%
H&M 13.19% 13.30% 13.96% 14.38% 17.22%
Others:
Return on equity: It represents the efficiency of firm in relation to the generation of sales
from shareholders equity. Next plc have earned 15.87% return by investing equities of
4
⊘ This is a preview!⊘
Do you want full access?
Subscribe today to unlock all pages.
Trusted by 1+ million students worldwide
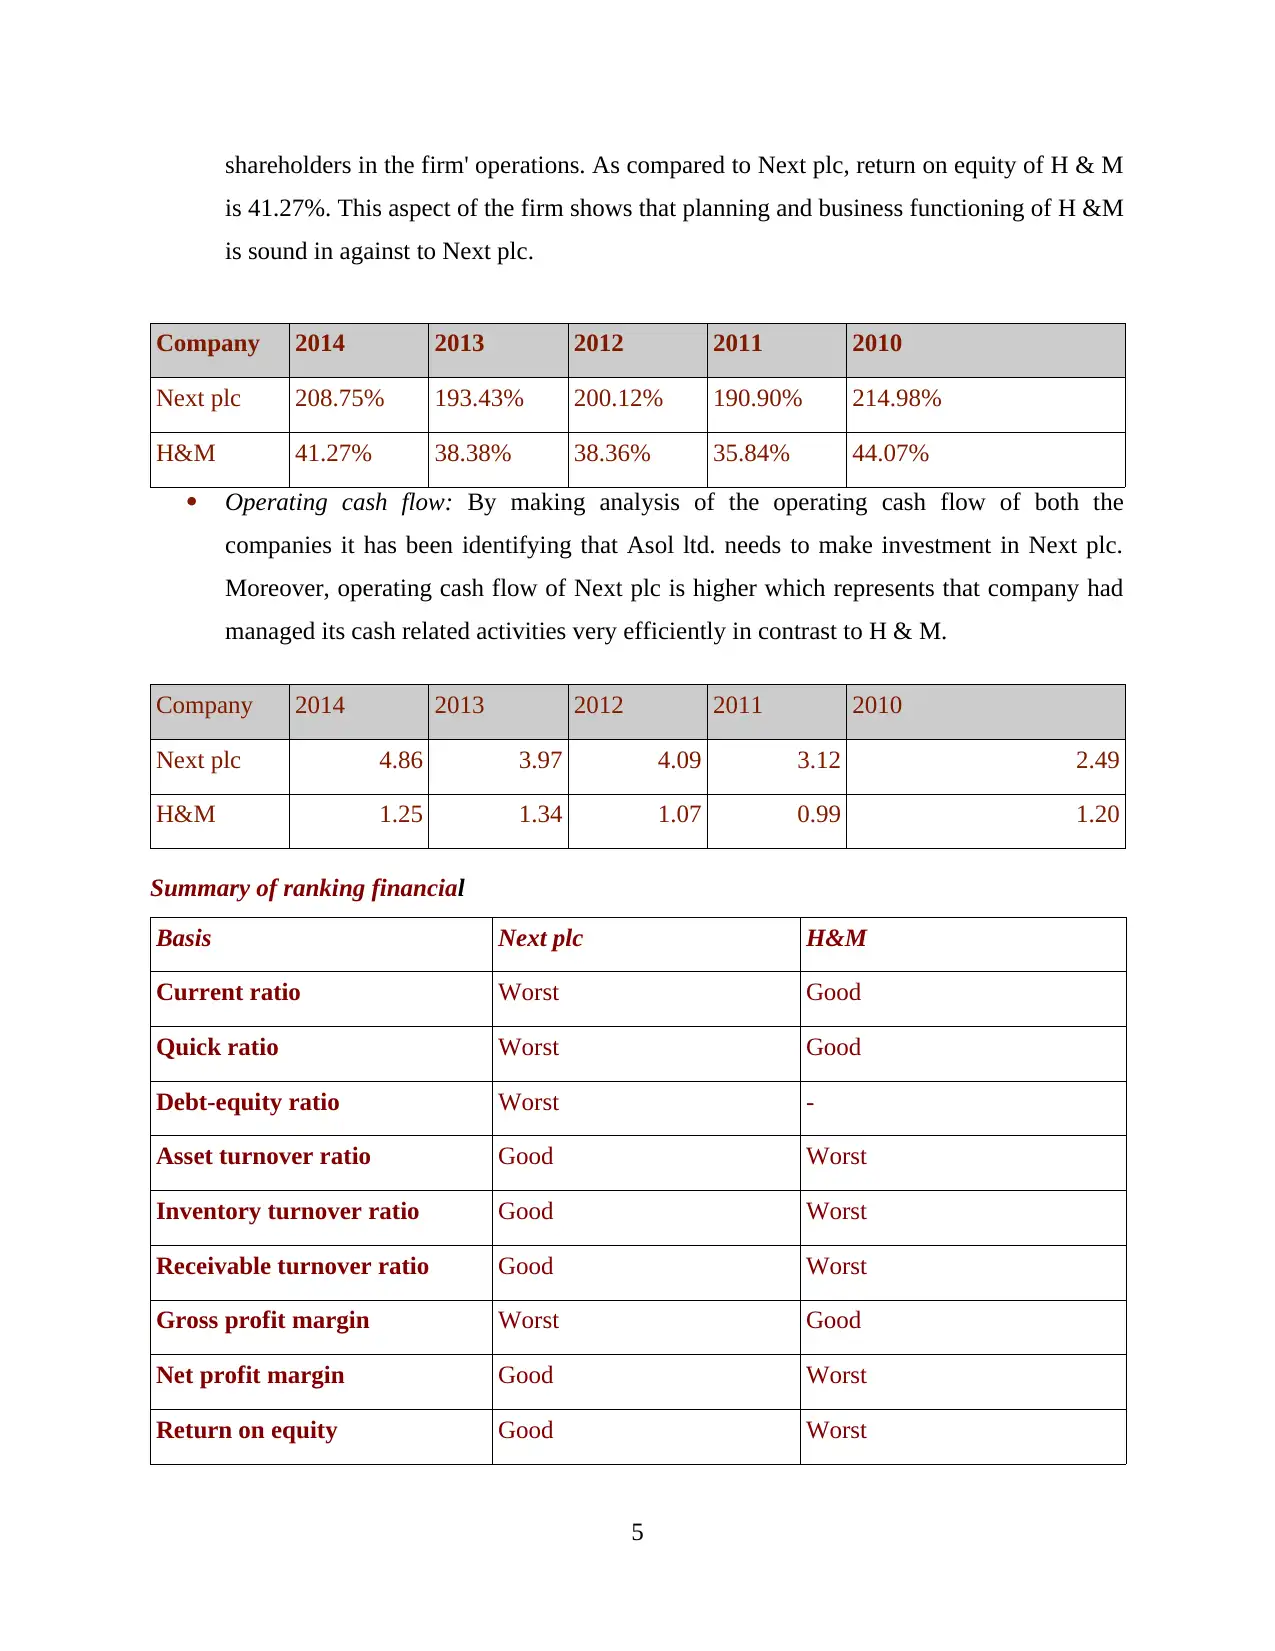
shareholders in the firm' operations. As compared to Next plc, return on equity of H & M
is 41.27%. This aspect of the firm shows that planning and business functioning of H &M
is sound in against to Next plc.
Company 2014 2013 2012 2011 2010
Next plc 208.75% 193.43% 200.12% 190.90% 214.98%
H&M 41.27% 38.38% 38.36% 35.84% 44.07%
Operating cash flow: By making analysis of the operating cash flow of both the
companies it has been identifying that Asol ltd. needs to make investment in Next plc.
Moreover, operating cash flow of Next plc is higher which represents that company had
managed its cash related activities very efficiently in contrast to H & M.
Company 2014 2013 2012 2011 2010
Next plc 4.86 3.97 4.09 3.12 2.49
H&M 1.25 1.34 1.07 0.99 1.20
Summary of ranking financial
Basis Next plc H&M
Current ratio Worst Good
Quick ratio Worst Good
Debt-equity ratio Worst -
Asset turnover ratio Good Worst
Inventory turnover ratio Good Worst
Receivable turnover ratio Good Worst
Gross profit margin Worst Good
Net profit margin Good Worst
Return on equity Good Worst
5
Paraphrase This Document
Need a fresh take? Get an instant paraphrase of this document with our AI Paraphraser
Operating cash flow Good Worst
Limitations of financial ratios: Along with the advantages, there are several aspects
which restrict the significance of ratio analysis. Different companies prepare their financial
statements by taking into account different accounting principles or concepts. This aspect closely
influences the outcome of ratio analysis. For instance, a company undertakes accounting cost
concept whereas, competitor firm does not undertake such aspect. In this, it is quite difficult for
the finance manager to assess the efficiency aspect of firm in the right direction. In addition to
this, if both the companies operate in different business environment or countries then manager
of the firm is unable to make comparison of financial performance. Moreover, tax policies as
well as other rules and regulations highly differ from country to country. These aspects also have
significant impact upon the financial statement and performance of the firm. All these aspects
badly hamper the effectiveness of ratio analysis.
Non-financial ratio:
It consists of those which provide assistance to manager in assessing the extent to which
business is performing well. Manager of the firm can easily assess the growth and success of the
firm by making evaluation of the staff turnover ratio. Revenue and operating income is one of
the main factors which clearly provide information regarding the efficiency, ability and
satisfaction aspect of the personnel. With the help of such ratios company is able to make
planning for the future more effectively and efficiently.
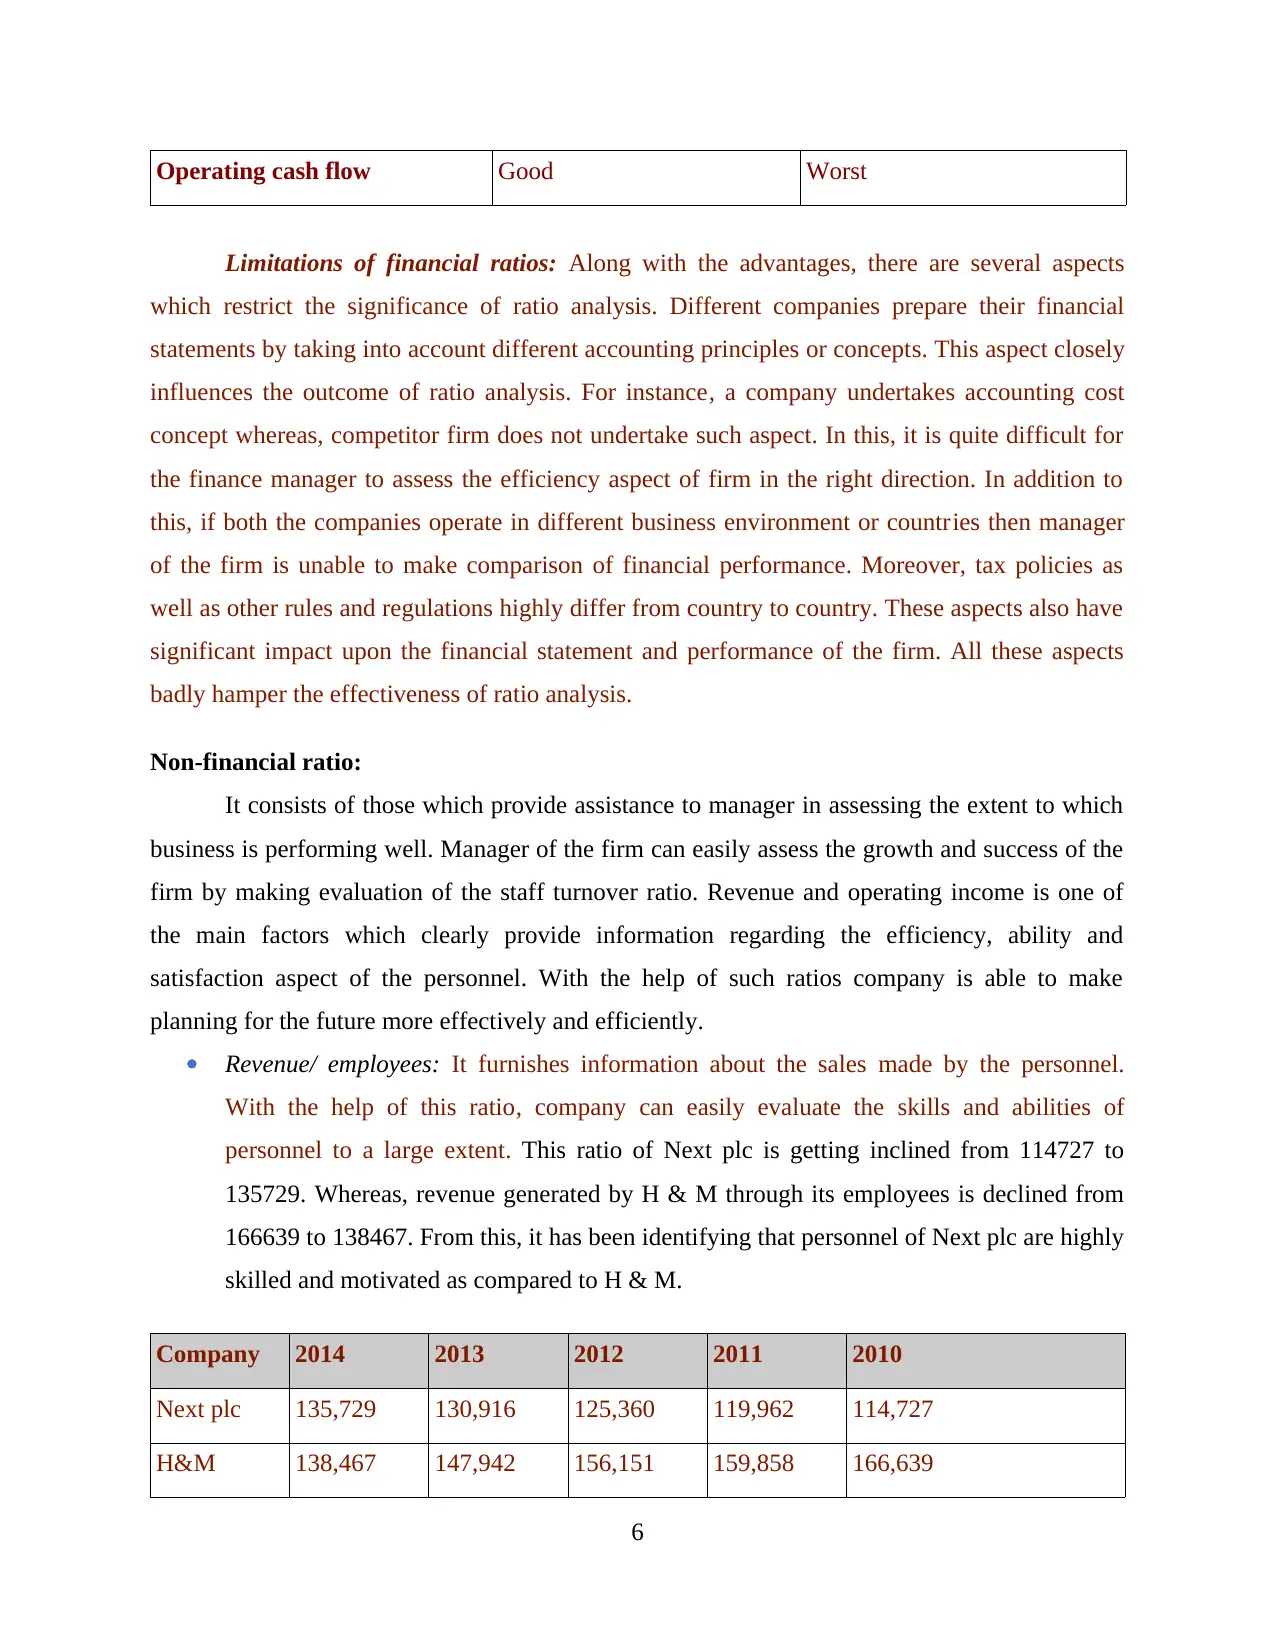
Revenue/ employees: It furnishes information about the sales made by the personnel.
With the help of this ratio, company can easily evaluate the skills and abilities of
personnel to a large extent. This ratio of Next plc is getting inclined from 114727 to
135729. Whereas, revenue generated by H & M through its employees is declined from
166639 to 138467. From this, it has been identifying that personnel of Next plc are highly
skilled and motivated as compared to H & M.
Company 2014 2013 2012 2011 2010
Next plc 135,729 130,916 125,360 119,962 114,727
H&M 138,467 147,942 156,151 159,858 166,639
6
Limitations of financial ratios: Along with the advantages, there are several aspects
which restrict the significance of ratio analysis. Different companies prepare their financial
statements by taking into account different accounting principles or concepts. This aspect closely
influences the outcome of ratio analysis. For instance, a company undertakes accounting cost
concept whereas, competitor firm does not undertake such aspect. In this, it is quite difficult for
the finance manager to assess the efficiency aspect of firm in the right direction. In addition to
this, if both the companies operate in different business environment or countries then manager
of the firm is unable to make comparison of financial performance. Moreover, tax policies as
well as other rules and regulations highly differ from country to country. These aspects also have
significant impact upon the financial statement and performance of the firm. All these aspects
badly hamper the effectiveness of ratio analysis.
Non-financial ratio:
It consists of those which provide assistance to manager in assessing the extent to which
business is performing well. Manager of the firm can easily assess the growth and success of the
firm by making evaluation of the staff turnover ratio. Revenue and operating income is one of
the main factors which clearly provide information regarding the efficiency, ability and
satisfaction aspect of the personnel. With the help of such ratios company is able to make
planning for the future more effectively and efficiently.
Revenue/ employees: It furnishes information about the sales made by the personnel.
With the help of this ratio, company can easily evaluate the skills and abilities of
personnel to a large extent. This ratio of Next plc is getting inclined from 114727 to
135729. Whereas, revenue generated by H & M through its employees is declined from
166639 to 138467. From this, it has been identifying that personnel of Next plc are highly
skilled and motivated as compared to H & M.
Company 2014 2013 2012 2011 2010
Next plc 135,729 130,916 125,360 119,962 114,727
H&M 138,467 147,942 156,151 159,858 166,639
6
Operating income/employees: Employees earnings before interest and tax of Next plc are
continuously increasing which is positive sign for the firm. Further, operating income of
H & M is get decreased from 42580 to 28008. It reflects that human resources of Next plc
have made their great efforts and thereby make contribution in the growth and success of
firm.
Company 2014 2013 2012 2011 2010
Next plc 27,985 25,301 24,561 21,192 19,719
H&M 23,395 25,420 28,120 29,616 37878
Brand Image – The brand image of Next PLC is positive in the retail industry. It comes
among the top positions of retail players. It is the largest clothing retailer in terms of
sales. The brand image is good among the customers as company supplies quality goods
and services. It is positive because financial health and performance of Next plc is good.
In addition to this, return on equity of Next Plc is continuously increasing which build
effective corporate image in the mind of shareholders. Further, company consistently
offer dividend to the shareholders which also develop positive image in the mind of
existing and potential investors. Company also makes repayment of loan within the
suitable time frame. All these aspect may result into effective brand image. Adaptability – Next plc holds a great strength of adaptability. This is very crucial in ever
evolving retail market. The strength of adaptability can be noticed in the delivery services
and home shopping networks. Efficiency ratios as well as return on equity and operating
cash flow increasing. On the basis of this aspect it can be stated that Next plc is able to
make modification in the strategic framework in accordance with the changing market
conditions.
On the basis all the above mentioned analysis it is suggested to the investors that they
needs to make investment in Next plc. Through this, investors are able to enhance its profitability
aspects.
Summary of ranking non-financial
Basis Next plc H&M
7
⊘ This is a preview!⊘
Do you want full access?
Subscribe today to unlock all pages.
Trusted by 1+ million students worldwide
Revenue/ employees Good Worst
Operating income/employees Good Worst
Particulars Ratios 2014 2013 2012 2011 2010
Financial ratios
Next plc Current Ratio 1.82 1.76 1.48 1.54 1.28
H & M Hennes &
Mauritz AB Current Ratio 2.11 2.25 2.66 2.71 2.96
Next plc Quick ratio 1.16 1.18 0.97 0.91 0.72
H & M Hennes &
Mauritz AB Quick ratio 1.07 1.22 1.49 1.69 2.06
Next plc Asset Turnover 1.81 1.85 1.89 1.89 1.89
H & M Hennes &
Mauritz AB Asset Turnover 2.14 2.04 2.01 1.84 1.91
Next plc Inventory Turnover 6.62 6.97 6.91 6.47 6.89
H & M Hennes &
Mauritz AB Inventory Turnover 3.46 3.29 3.37 3.47 3.7
Next plc
Receivable turnover
ratio 5.45 5.56 5.72 5.97 6.14
H & M Hennes &
Mauritz AB
Receivable turnover
ratio 33.12 33.16 32.42 29.64 32.92
8
Paraphrase This Document
Need a fresh take? Get an instant paraphrase of this document with our AI Paraphraser
Next plc Revenue/Employee 135729 130916 125360 119962 114727
H & M Hennes &
Mauritz AB Revenue/Employee 138467 147942 156151 159858 166639
Next plc Debt-equity ratio 0.72 0.74 0.70 0.75 0.72
Next plc COGS/Revenue 66.41% 66.84% 68.52% 69.62% 70.73%
H & M Hennes &
Mauritz AB COGS/Revenue 41.19% 40.87% 40.50% 39.87% 37.07%
Next plc Gross profit 33.59% 33.16% 31.48% 30.38% 29.27%
H & M Hennes &
Mauritz AB Gross profit 58.81% 59.13% 59.50% 60.13% 62.93%
Next plc Net profit 15.87% 14.79% 14.34% 12.62% 11.93%
H & M Hennes &
Mauritz AB Net profit 13.19% 13.30% 13.96% 14.38% 17.22%
Next plc Operating cash flow
208.75
%
193.43
%
200.12
%
190.90
%
214.98
%
H & M Hennes &
Mauritz AB Operating cash flow 41.27% 38.38% 38.36% 35.84% 44.07%
Next plc Return on equity
208.75
%
193.43
%
200.12
%
190.90
%
214.98
%
H & M Hennes &
Mauritz AB Return on equity 41.27% 38.38% 38.36% 35.84% 44.07%
Non-financial ratios
Next plc Revenue/employees 135,729 130,916 125,360 119,962 114,727
H & M Hennes &
Mauritz AB Revenue/employees 138,467 147,942 156,151 159,858 166,639
9
H & M Hennes &
Mauritz AB Revenue/Employee 138467 147942 156151 159858 166639
Next plc Debt-equity ratio 0.72 0.74 0.70 0.75 0.72
Next plc COGS/Revenue 66.41% 66.84% 68.52% 69.62% 70.73%
H & M Hennes &
Mauritz AB COGS/Revenue 41.19% 40.87% 40.50% 39.87% 37.07%
Next plc Gross profit 33.59% 33.16% 31.48% 30.38% 29.27%
H & M Hennes &
Mauritz AB Gross profit 58.81% 59.13% 59.50% 60.13% 62.93%
Next plc Net profit 15.87% 14.79% 14.34% 12.62% 11.93%
H & M Hennes &
Mauritz AB Net profit 13.19% 13.30% 13.96% 14.38% 17.22%
Next plc Operating cash flow
208.75
%
193.43
%
200.12
%
190.90
%
214.98
%
H & M Hennes &
Mauritz AB Operating cash flow 41.27% 38.38% 38.36% 35.84% 44.07%
Next plc Return on equity
208.75
%
193.43
%
200.12
%
190.90
%
214.98
%
H & M Hennes &
Mauritz AB Return on equity 41.27% 38.38% 38.36% 35.84% 44.07%
Non-financial ratios
Next plc Revenue/employees 135,729 130,916 125,360 119,962 114,727
H & M Hennes &
Mauritz AB Revenue/employees 138,467 147,942 156,151 159,858 166,639
9
Next plc
Operating
income/employees 27,985 25,301 24,561 21,192 19,719
H & M Hennes &
Mauritz AB
Operating
income/employees 23,395 25,420 28,120 29,616 37878
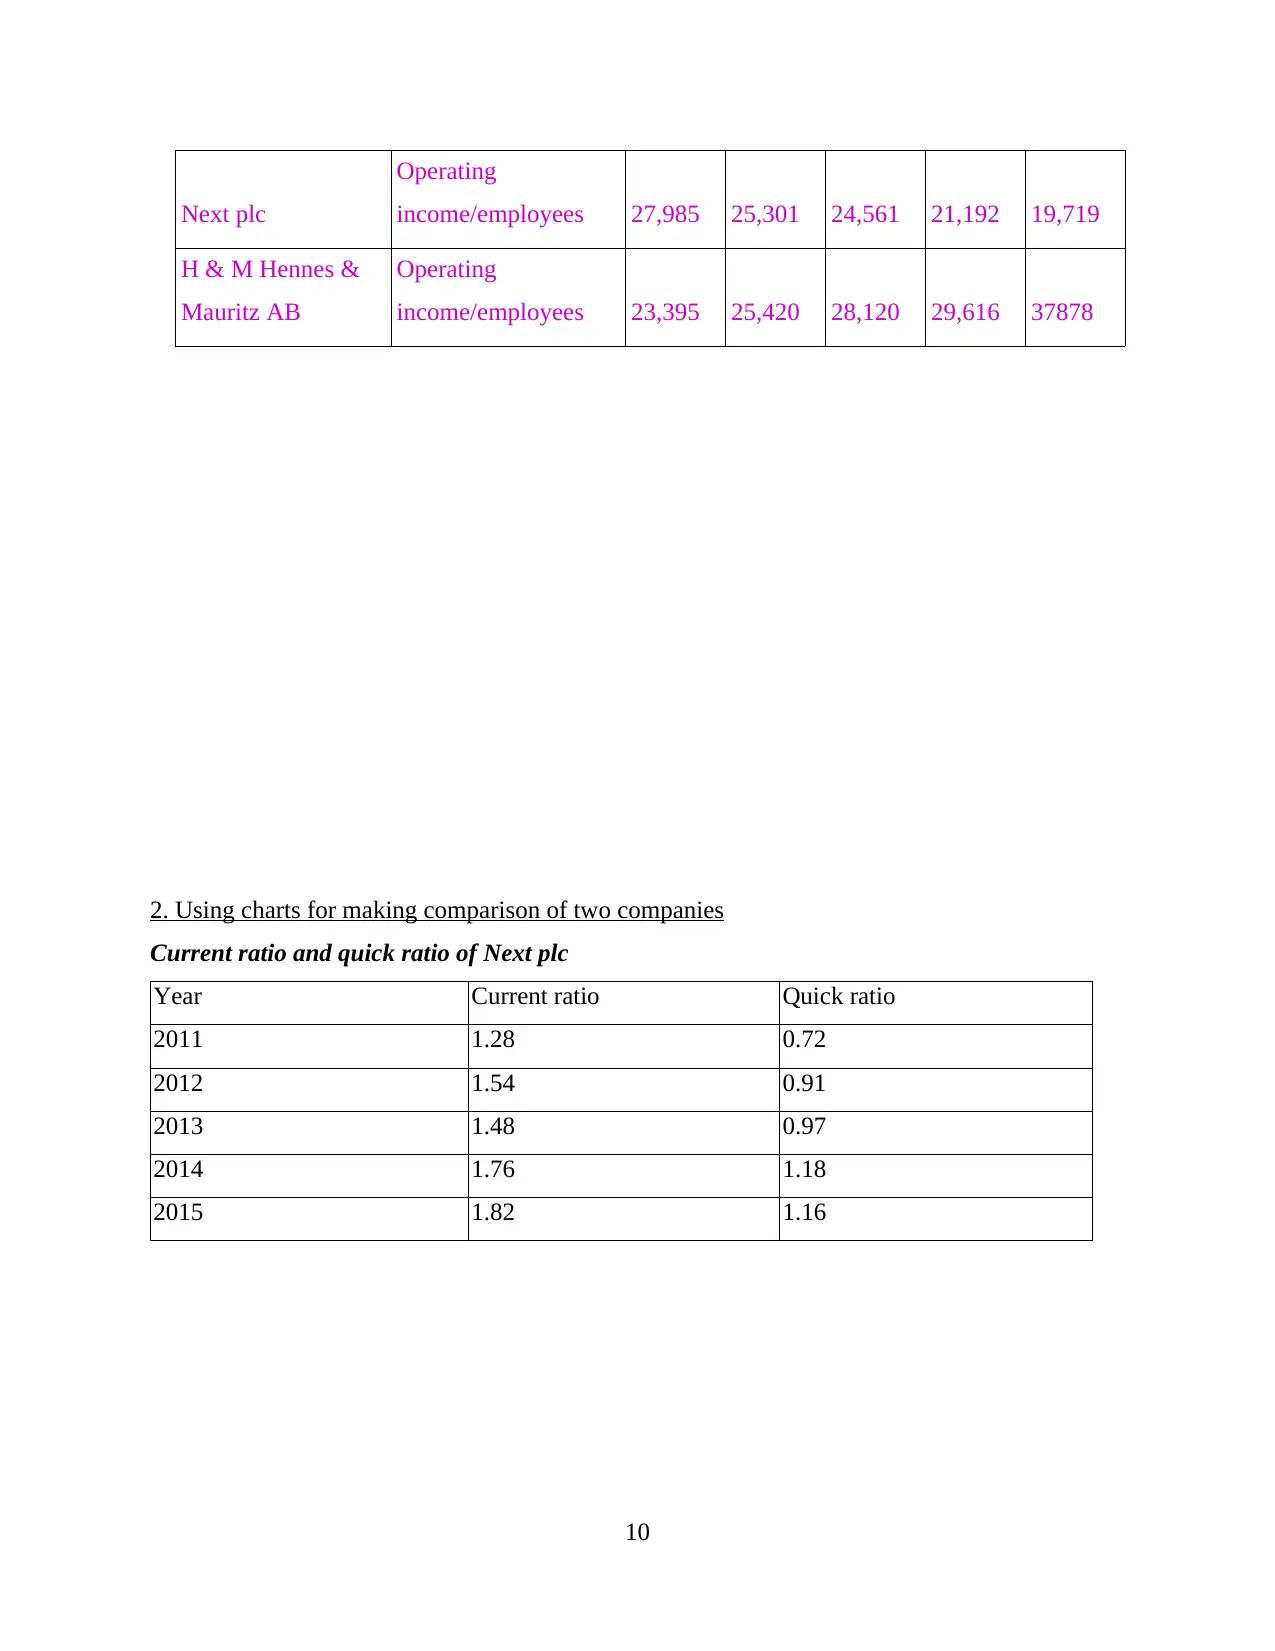
2. Using charts for making comparison of two companies
Current ratio and quick ratio of Next plc
Year Current ratio Quick ratio
2011 1.28 0.72
2012 1.54 0.91
2013 1.48 0.97
2014 1.76 1.18
2015 1.82 1.16
10
Operating
income/employees 27,985 25,301 24,561 21,192 19,719
H & M Hennes &
Mauritz AB
Operating
income/employees 23,395 25,420 28,120 29,616 37878
2. Using charts for making comparison of two companies
Current ratio and quick ratio of Next plc
Year Current ratio Quick ratio
2011 1.28 0.72
2012 1.54 0.91
2013 1.48 0.97
2014 1.76 1.18
2015 1.82 1.16
10
⊘ This is a preview!⊘
Do you want full access?
Subscribe today to unlock all pages.
Trusted by 1+ million students worldwide
1 out of 23
Related Documents


Your All-in-One AI-Powered Toolkit for Academic Success.
+13062052269
info@desklib.com
Available 24*7 on WhatsApp / Email
![[object Object]](/_next/static/media/star-bottom.7253800d.svg)
Unlock your academic potential
Copyright © 2020–2026 A2Z Services. All Rights Reserved. Developed and managed by ZUCOL.