Accounting and Finance for Managers: Company Financial Report
VerifiedAdded on  2023/01/03
|17
|3809
|52
Report
AI Summary
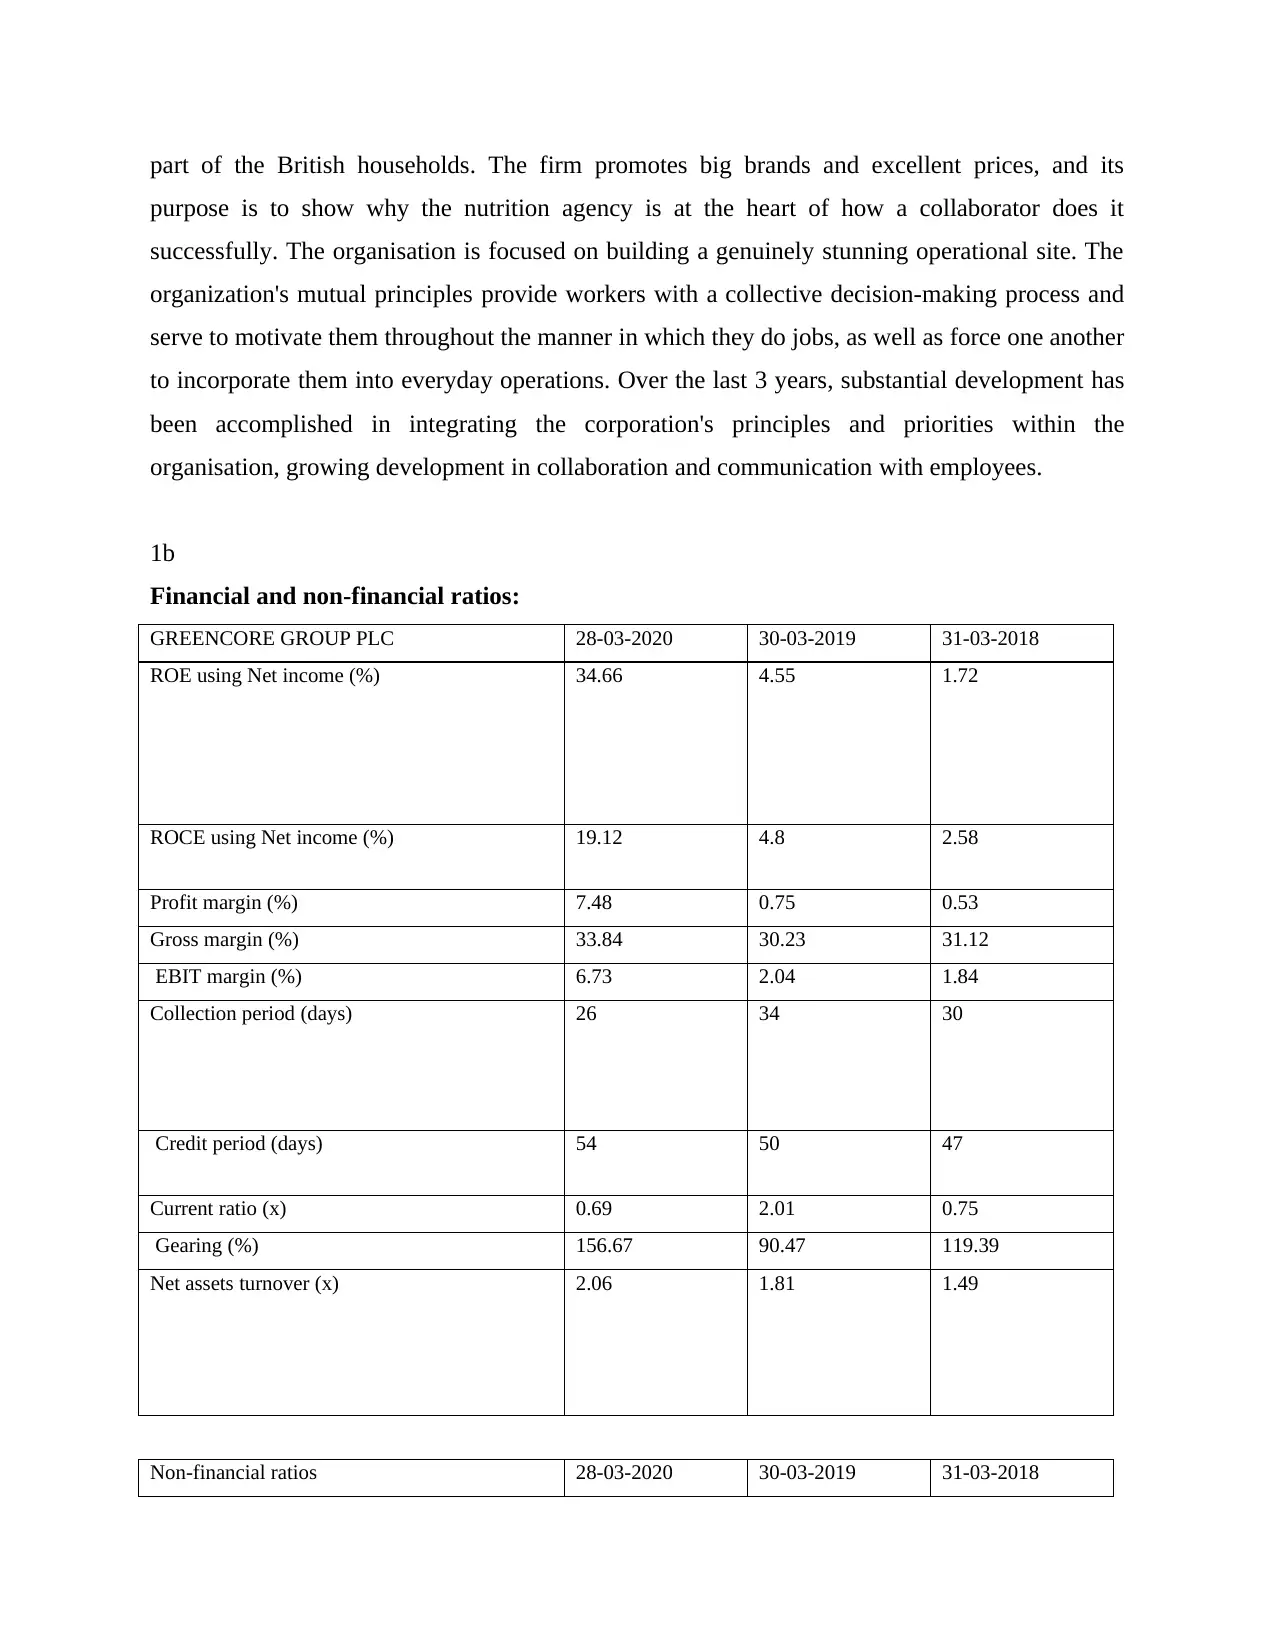
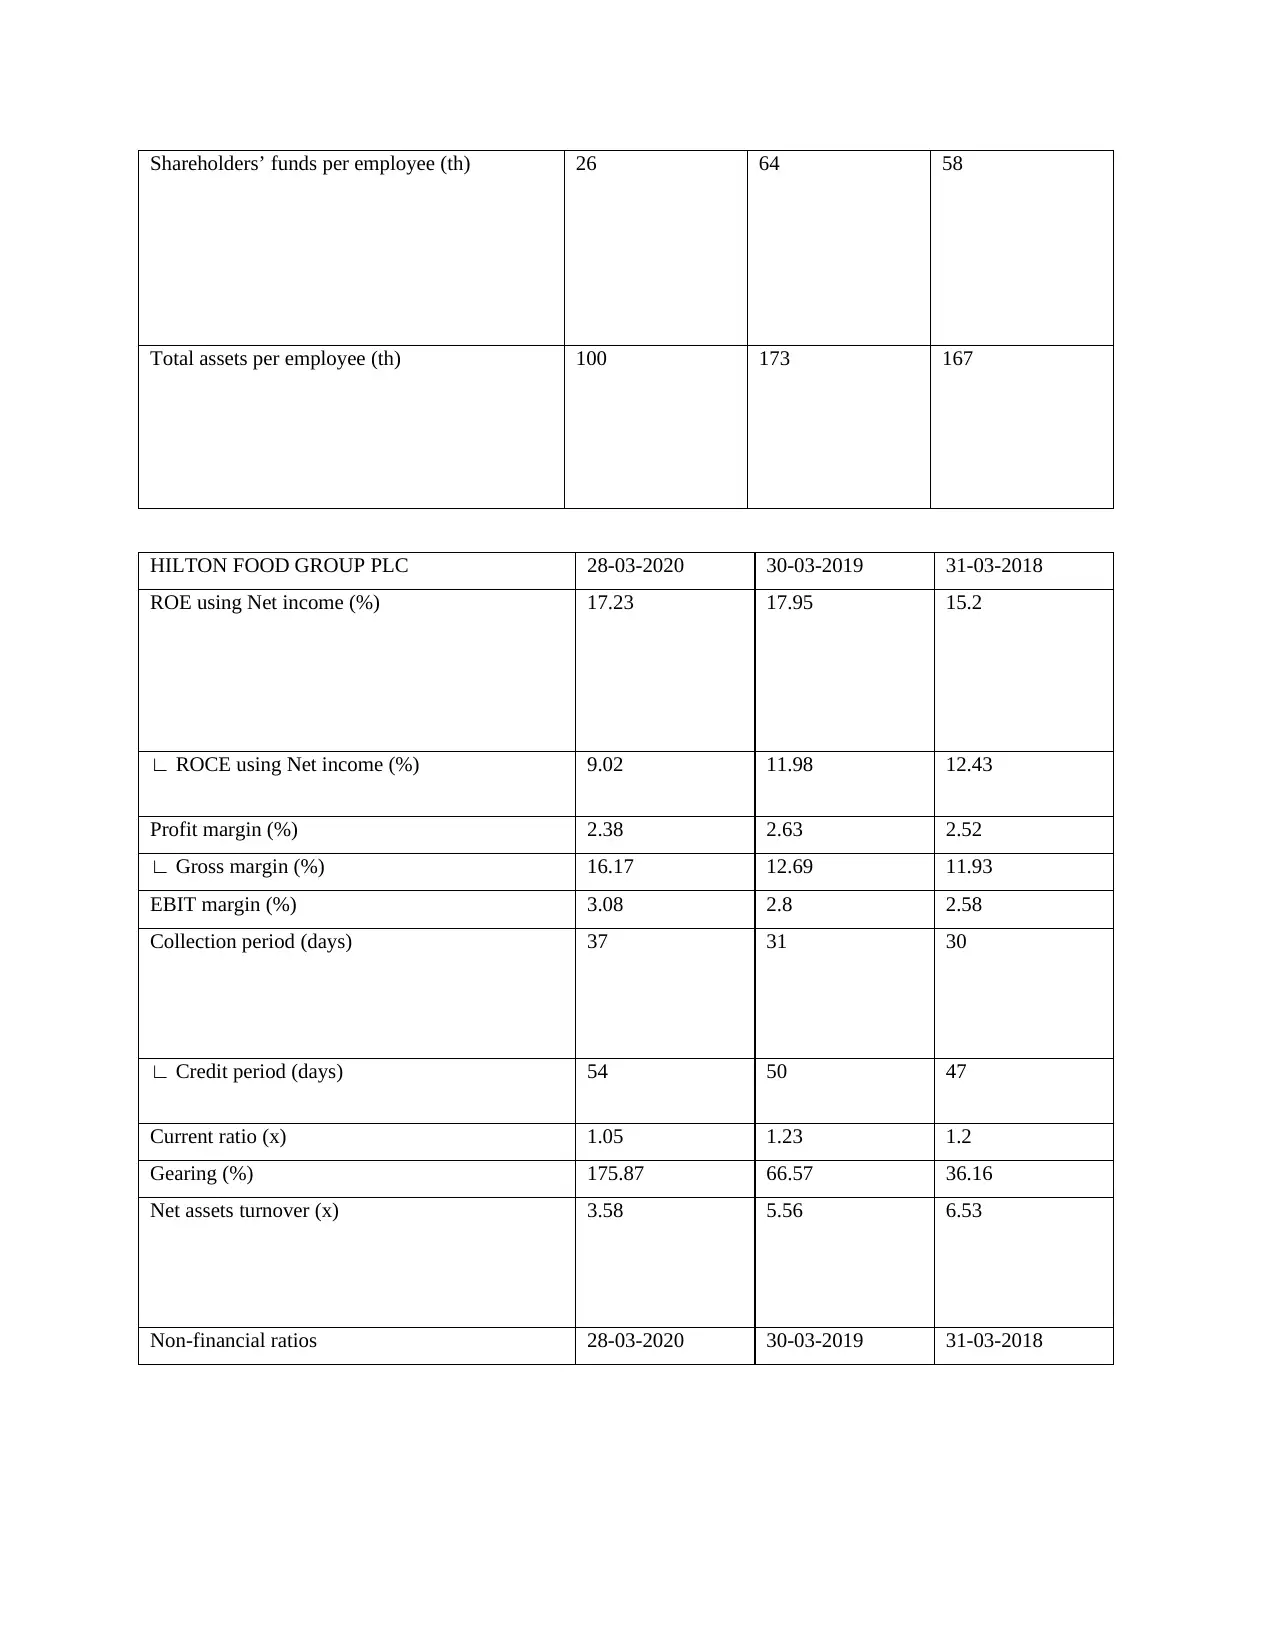
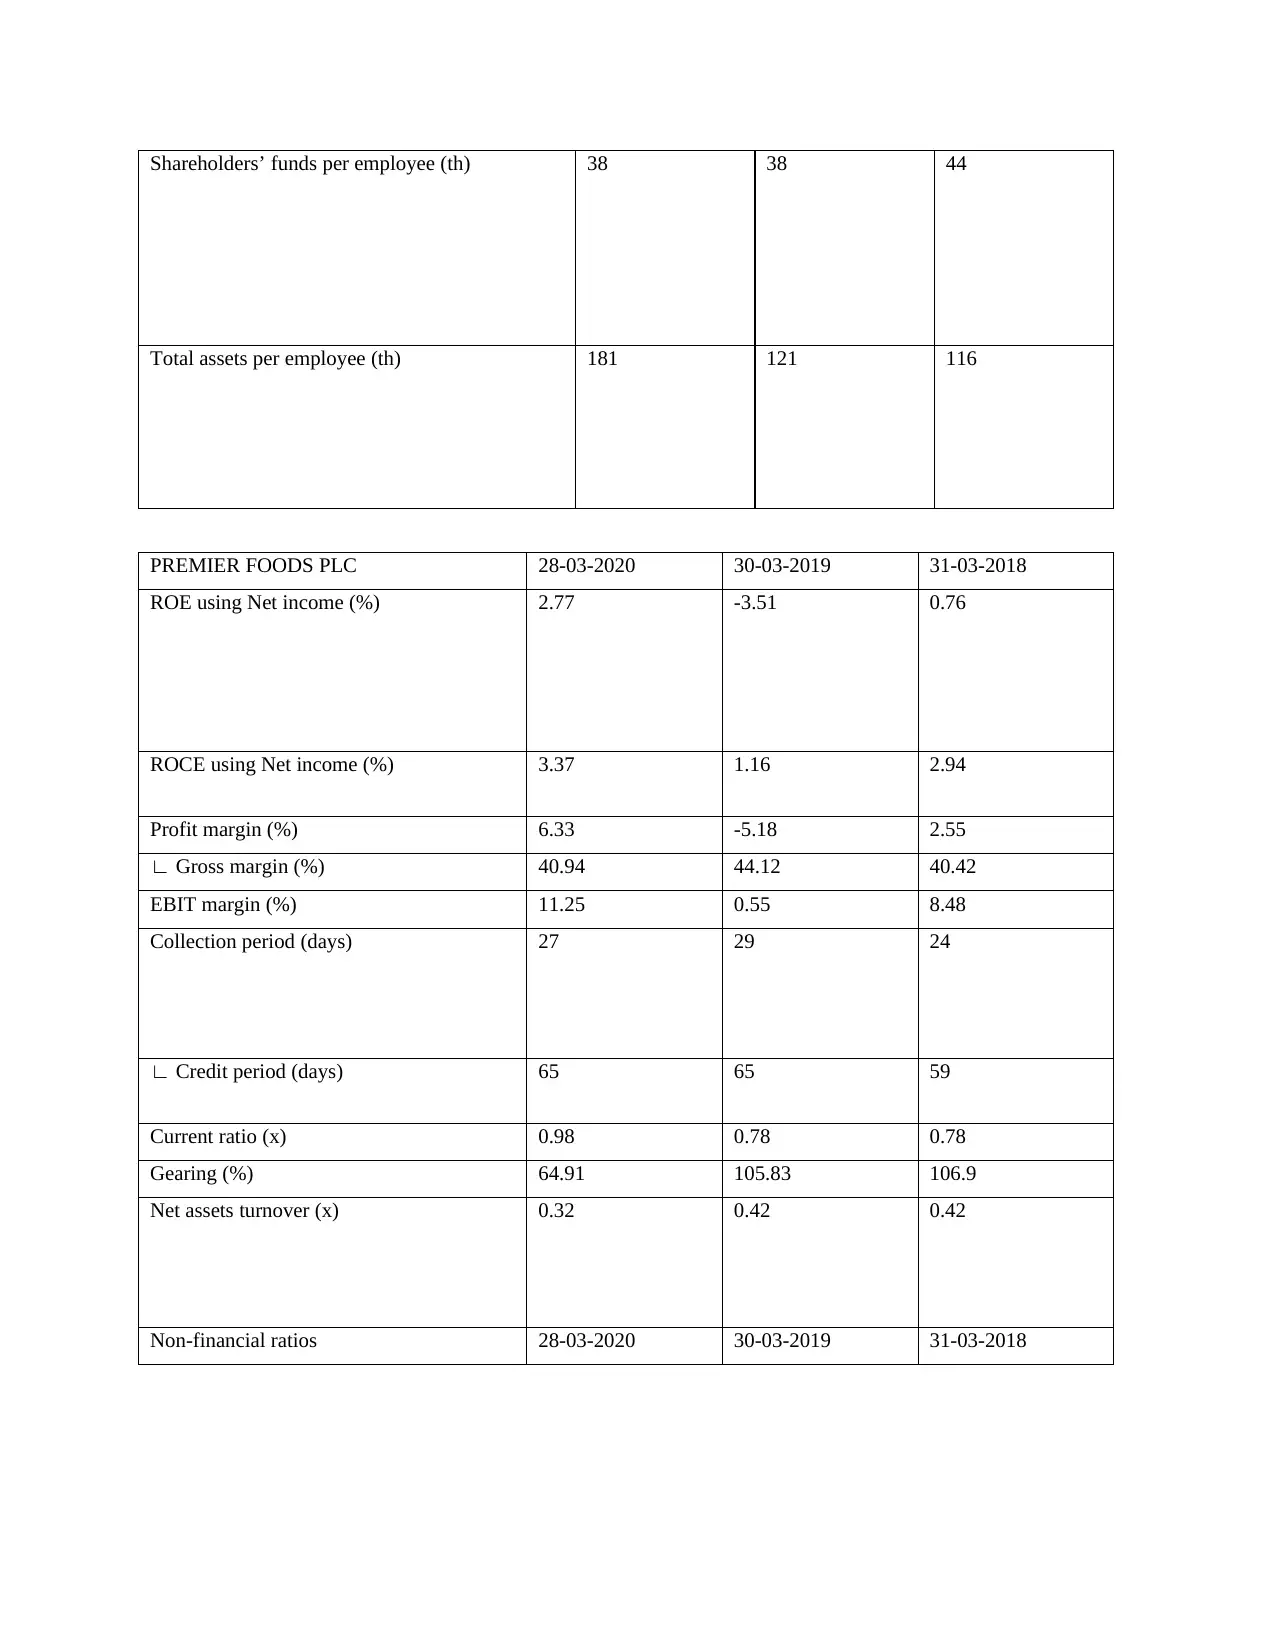
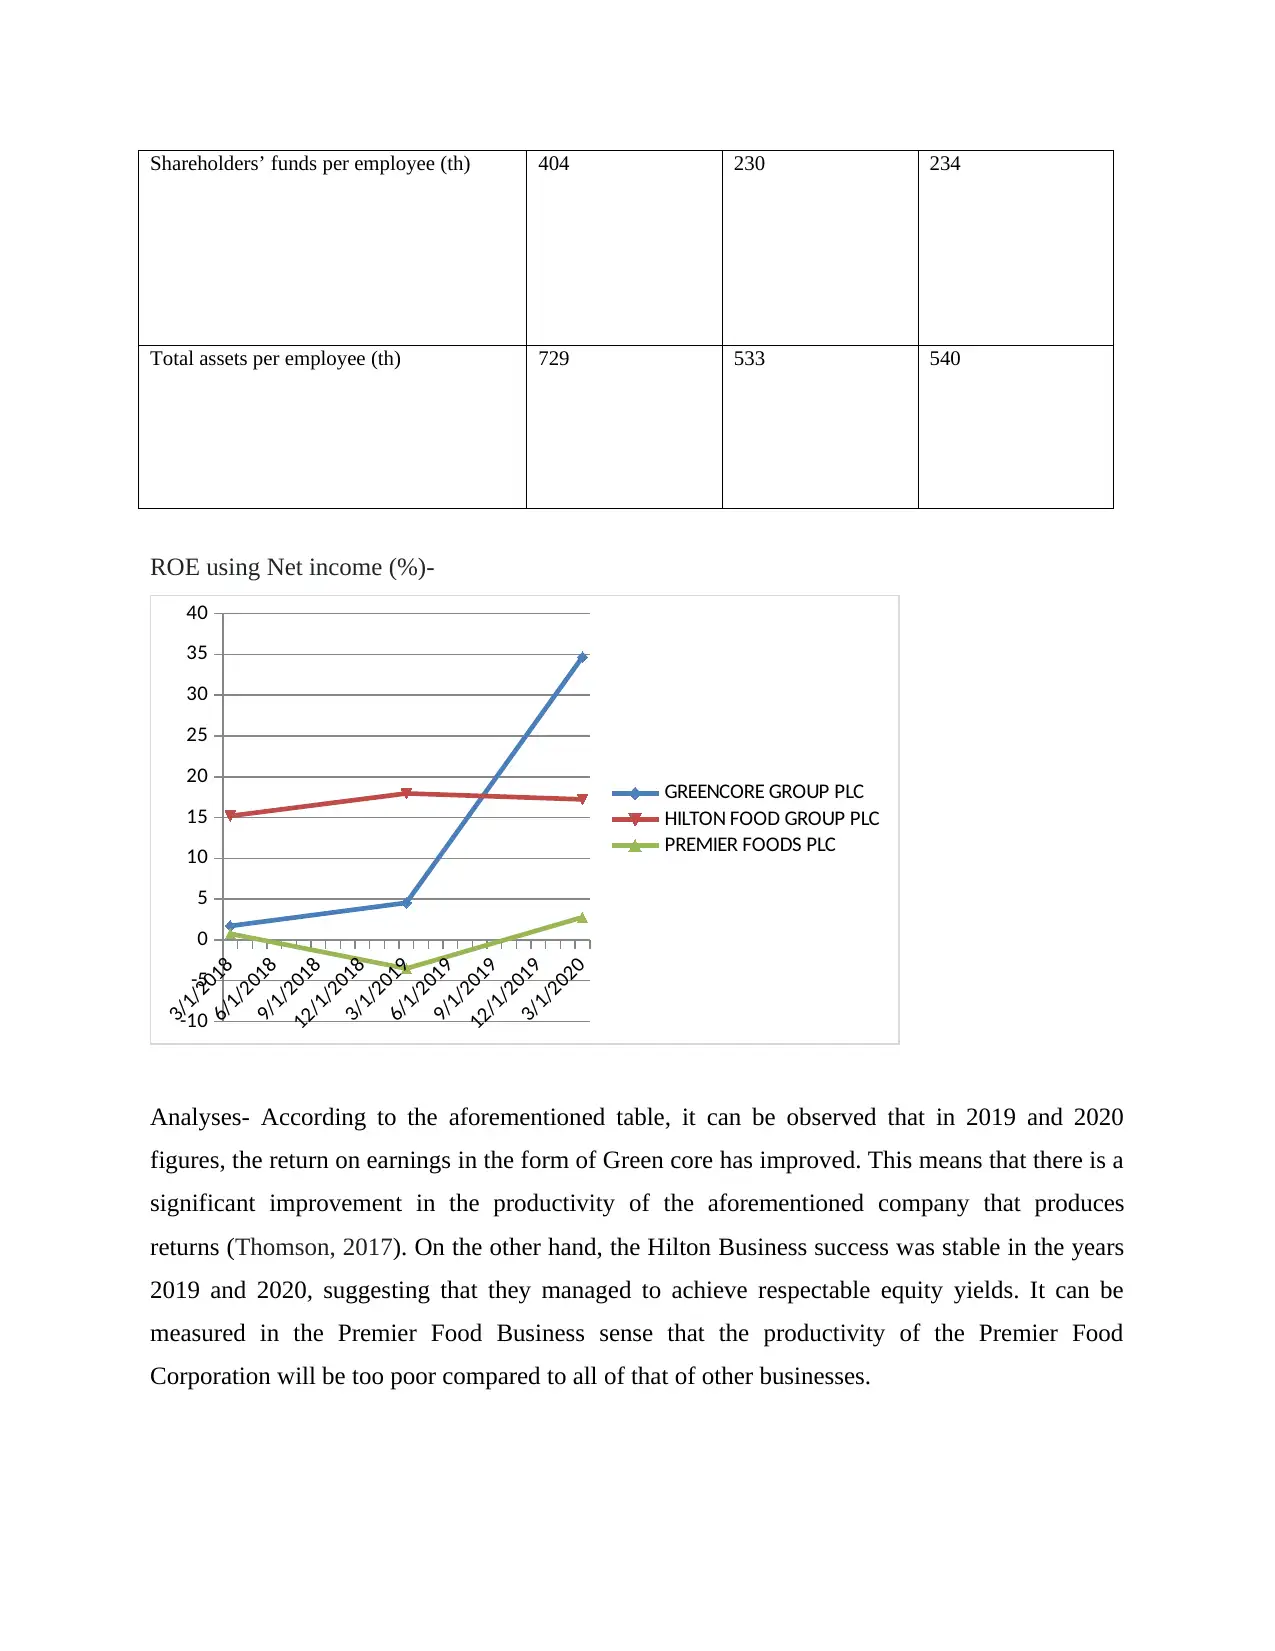
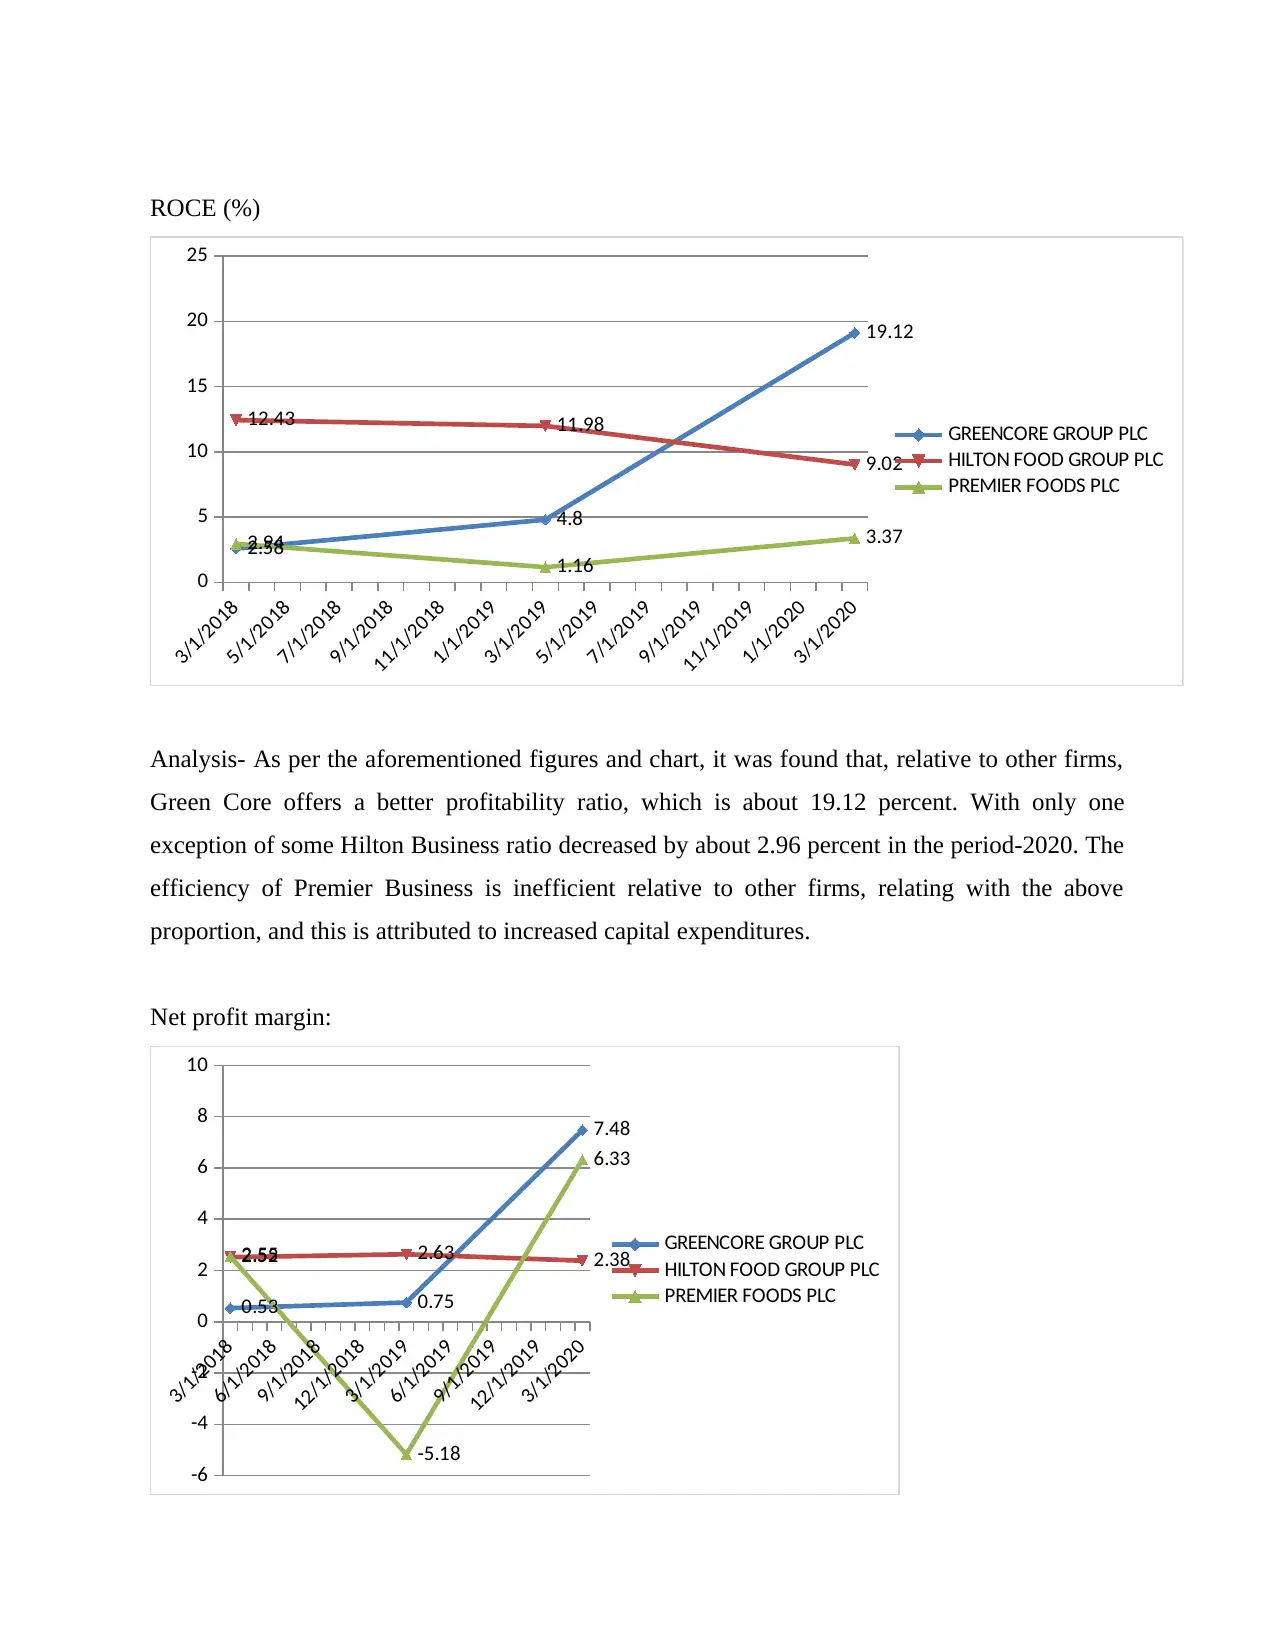
This report provides a comprehensive analysis of the financial performance of three companies: Green-Core Group Plc, Hilton Food Group Plc, and Premier Foods Plc. The analysis is based on financial and non-financial ratios, including ROE, ROCE, profit margin, gross margin, EBIT margin, collection period, credit period, current ratio, gearing, and net assets turnover. The report examines the companies' strategies, objectives, and key strengths, and provides a comparative assessment of their financial health over a three-year period (2018-2020). The analysis includes graphical representations of key ratios, providing insights into trends and performance variations. The findings highlight the relative strengths and weaknesses of each company, offering valuable insights for financial management and strategic decision-making.

Accounting
and
Finance for Managers
and
Finance for Managers
Paraphrase This Document
Need a fresh take? Get an instant paraphrase of this document with our AI Paraphraser

Contents
INTRODUCTION...........................................................................................................................3
SECTION A.....................................................................................................................................3
SECTION B...................................................................................................................................14
CONCLUSION..............................................................................................................................16
REFERENCES..............................................................................................................................17

INTRODUCTION
This report analyses a detailed review and appraisal of three companies: the company of the
Green-Core group, the Hilton Food Group and the Premier Food Group, both of which belong to
the very same economy and are main competitor (McLaney and Atrill, 2016). The ratio analysis
and development direction, aims and objectives of these undertakings are found from the very
first portion, while the second section discusses all multiple methods of lengthier financing.
SECTION A
1a.
Green core Group Plc: In an increasing food market, the company's desire to boost competition
relies on two biggest parts: widening its consumer offering and motivating consumers to buy
more. The strategy of the company is to further reinforce our relevance to our buyers by pushing
income through a shared supply chain, increasing value across their portfolios, along with doing
more for clients. The accomplishment of the organization business aim depends on four major
strengths: home cooked meals, power people, Green core honesty and firm's performance. The
execution of this plan involves a broad and knowledgeable organisation called Green core,
undergirded by a shared dedication and doing company.
Hilton Food Group Plc: For a long time the business has been a lively company with high
expectations. The brand growth for success is what draws its clients. But their faith in lengthier
alliances has powered their rise in multinationals (Loughran and McDonald, 2016). The
company's responsibility is to help that now the company's corporate partners exceed their rivals.
The company’s objective as a corporation is Absolute Coordination. Business's devotion,
engagement and desire to do whatever it can to make its workers succeed. One job, one intent,
one shared aim. Managerial personnel are in the core of everything the company does. Corporate
ethnic background was always distinct and important. The company's principles describe the
ways in which they think of themselves first an entity and how they behave as individuals.
Business staff based on common principles and established strategies, act as relationships
alliances.
Premier Foods Plc: The company purpose guarantees them the delicious food which our
corporate clients want, food that is nutritious, easy to cook and comes in multiple forms, what
they're about to do anyway. That is why clients see their products in nearly 94% of the overall
⊘ This is a preview!⊘
Do you want full access?
Subscribe today to unlock all pages.

Trusted by 1+ million students worldwide

part of the British households. The firm promotes big brands and excellent prices, and its
purpose is to show why the nutrition agency is at the heart of how a collaborator does it
successfully. The organisation is focused on building a genuinely stunning operational site. The
organization's mutual principles provide workers with a collective decision-making process and
serve to motivate them throughout the manner in which they do jobs, as well as force one another
to incorporate them into everyday operations. Over the last 3 years, substantial development has
been accomplished in integrating the corporation's principles and priorities within the
organisation, growing development in collaboration and communication with employees.
1b
Financial and non-financial ratios:
GREENCORE GROUP PLC 28-03-2020 30-03-2019 31-03-2018
ROE using Net income (%) 34.66 4.55 1.72
ROCE using Net income (%) 19.12 4.8 2.58
Profit margin (%) 7.48 0.75 0.53
Gross margin (%) 33.84 30.23 31.12
EBIT margin (%) 6.73 2.04 1.84
Collection period (days) 26 34 30
Credit period (days) 54 50 47
Current ratio (x) 0.69 2.01 0.75
Gearing (%) 156.67 90.47 119.39
Net assets turnover (x) 2.06 1.81 1.49
Non-financial ratios 28-03-2020 30-03-2019 31-03-2018
Paraphrase This Document
Need a fresh take? Get an instant paraphrase of this document with our AI Paraphraser

Shareholders’ funds per employee (th) 26 64 58
Total assets per employee (th) 100 173 167
HILTON FOOD GROUP PLC 28-03-2020 30-03-2019 31-03-2018
ROE using Net income (%) 17.23 17.95 15.2
∟ ROCE using Net income (%) 9.02 11.98 12.43
Profit margin (%) 2.38 2.63 2.52
∟ Gross margin (%) 16.17 12.69 11.93
EBIT margin (%) 3.08 2.8 2.58
Collection period (days) 37 31 30
∟ Credit period (days) 54 50 47
Current ratio (x) 1.05 1.23 1.2
Gearing (%) 175.87 66.57 36.16
Net assets turnover (x) 3.58 5.56 6.53
Non-financial ratios 28-03-2020 30-03-2019 31-03-2018

Shareholders’ funds per employee (th) 38 38 44
Total assets per employee (th) 181 121 116
PREMIER FOODS PLC 28-03-2020 30-03-2019 31-03-2018
ROE using Net income (%) 2.77 -3.51 0.76
ROCE using Net income (%) 3.37 1.16 2.94
Profit margin (%) 6.33 -5.18 2.55
∟ Gross margin (%) 40.94 44.12 40.42
EBIT margin (%) 11.25 0.55 8.48
Collection period (days) 27 29 24
∟ Credit period (days) 65 65 59
Current ratio (x) 0.98 0.78 0.78
Gearing (%) 64.91 105.83 106.9
Net assets turnover (x) 0.32 0.42 0.42
Non-financial ratios 28-03-2020 30-03-2019 31-03-2018
⊘ This is a preview!⊘
Do you want full access?
Subscribe today to unlock all pages.

Trusted by 1+ million students worldwide

Shareholders’ funds per employee (th) 404 230 234
Total assets per employee (th) 729 533 540
ROE using Net income (%)-
3/1/2018
6/1/2018
9/1/2018
12/1/2018
3/1/2019
6/1/2019
9/1/2019
12/1/2019
3/1/2020
-10
-5
0
5
10
15
20
25
30
35
40
GREENCORE GROUP PLC
HILTON FOOD GROUP PLC
PREMIER FOODS PLC
Analyses- According to the aforementioned table, it can be observed that in 2019 and 2020
figures, the return on earnings in the form of Green core has improved. This means that there is a
significant improvement in the productivity of the aforementioned company that produces
returns (Thomson, 2017). On the other hand, the Hilton Business success was stable in the years
2019 and 2020, suggesting that they managed to achieve respectable equity yields. It can be
measured in the Premier Food Business sense that the productivity of the Premier Food
Corporation will be too poor compared to all of that of other businesses.
Paraphrase This Document
Need a fresh take? Get an instant paraphrase of this document with our AI Paraphraser

ROCE (%)
3/1/2018
5/1/2018
7/1/2018
9/1/2018
11/1/2018
1/1/2019
3/1/2019
5/1/2019
7/1/2019
9/1/2019
11/1/2019
1/1/2020
3/1/2020
0
5
10
15
20
25
2.58
4.8
19.12
12.43 11.98
9.02
2.94
1.16
3.37
GREENCORE GROUP PLC
HILTON FOOD GROUP PLC
PREMIER FOODS PLC
Analysis- As per the aforementioned figures and chart, it was found that, relative to other firms,
Green Core offers a better profitability ratio, which is about 19.12 percent. With only one
exception of some Hilton Business ratio decreased by about 2.96 percent in the period-2020. The
efficiency of Premier Business is inefficient relative to other firms, relating with the above
proportion, and this is attributed to increased capital expenditures.
Net profit margin:
3/1/2018
6/1/2018
9/1/2018
12/1/2018
3/1/2019
6/1/2019
9/1/2019
12/1/2019
3/1/2020
-6
-4
-2
0
2
4
6
8
10
0.53 0.75
7.48
2.52 2.63 2.382.55
-5.18
6.33
GREENCORE GROUP PLC
HILTON FOOD GROUP PLC
PREMIER FOODS PLC
3/1/2018
5/1/2018
7/1/2018
9/1/2018
11/1/2018
1/1/2019
3/1/2019
5/1/2019
7/1/2019
9/1/2019
11/1/2019
1/1/2020
3/1/2020
0
5
10
15
20
25
2.58
4.8
19.12
12.43 11.98
9.02
2.94
1.16
3.37
GREENCORE GROUP PLC
HILTON FOOD GROUP PLC
PREMIER FOODS PLC
Analysis- As per the aforementioned figures and chart, it was found that, relative to other firms,
Green Core offers a better profitability ratio, which is about 19.12 percent. With only one
exception of some Hilton Business ratio decreased by about 2.96 percent in the period-2020. The
efficiency of Premier Business is inefficient relative to other firms, relating with the above
proportion, and this is attributed to increased capital expenditures.
Net profit margin:
3/1/2018
6/1/2018
9/1/2018
12/1/2018
3/1/2019
6/1/2019
9/1/2019
12/1/2019
3/1/2020
-6
-4
-2
0
2
4
6
8
10
0.53 0.75
7.48
2.52 2.63 2.382.55
-5.18
6.33
GREENCORE GROUP PLC
HILTON FOOD GROUP PLC
PREMIER FOODS PLC

Analyses: Far as the Green-Core Business begins to grow, it may be confirmed that their
effectiveness during the year 2020 relative to year 2019 has been improved by a considerable
amount. In comparison, owing to higher prices, Premier Food had adverse operating revenue of
around -5.18 percent. It would be a nice condition, despite the increasing success of this Hilton
Food Manufacturer during those 3 years.
Gross margin-
3/1/2018
6/1/2018
9/1/2018
12/1/2018
3/1/2019
6/1/2019
9/1/2019
12/1/2019
3/1/2020
0
5
10
15
20
25
30
35
40
45
50
31.12 30.23
33.84
11.93 12.69
16.17
40.42
44.12 40.94
GREENCORE GROUP PLC
HILTON FOOD GROUP PLC
PREMIER FOODS PLC
Analyses: In all three years, Green Core business and Premier Fast food chain had same
productivity. Like Premier Food Manufacturer, in a similar manner, it's stronger off than other
businesses. In the other hand, relative to all firms, the performances of Hilton’s food
manufacturer are weak. This is due to the increased sales rates and dropping earnings.
EBIT-
⊘ This is a preview!⊘
Do you want full access?
Subscribe today to unlock all pages.

Trusted by 1+ million students worldwide

3/1/2018
6/1/2018
9/1/2018
12/1/2018
3/1/2019
6/1/2019
9/1/2019
12/1/2019
3/1/2020
0
2
4
6
8
10
12
1.84 2.04
6.73
2.58 2.8 3.08
8.48
0.55
11.25
GREENCORE GROUP PLC
HILTON FOOD GROUP PLC
PREMIER FOODS PLC
Analyses/interpretation- Hilton Food Corporation is able to retain its profits on an annual basis
until the amount of constant depreciation and amortization demonstrates its growth (Feldman,
2017). Green Central Business and the Premier Food Corporation, but at the other side, observed
a steady decline over the period-2019 and sustainable production in-2020 as well.
Collection period:
3/1/2018
6/1/2018
9/1/2018
12/1/2018
3/1/2019
6/1/2019
9/1/2019
12/1/2019
3/1/2020
0
5
10
15
20
25
30
35
40
30
34
26
30 31
37
24
29 27
GREENCORE GROUP PLC
HILTON FOOD GROUP PLC
PREMIER FOODS PLC
Analyses- Premier Business may be claimed that it is successful in recovering the receivables
from other two companies within a shortened time span in view of the creditor’s payment period.
Although Hilton Food Company tries to reimburse its debtors for quite a bit longer. In fact,
6/1/2018
9/1/2018
12/1/2018
3/1/2019
6/1/2019
9/1/2019
12/1/2019
3/1/2020
0
2
4
6
8
10
12
1.84 2.04
6.73
2.58 2.8 3.08
8.48
0.55
11.25
GREENCORE GROUP PLC
HILTON FOOD GROUP PLC
PREMIER FOODS PLC
Analyses/interpretation- Hilton Food Corporation is able to retain its profits on an annual basis
until the amount of constant depreciation and amortization demonstrates its growth (Feldman,
2017). Green Central Business and the Premier Food Corporation, but at the other side, observed
a steady decline over the period-2019 and sustainable production in-2020 as well.
Collection period:
3/1/2018
6/1/2018
9/1/2018
12/1/2018
3/1/2019
6/1/2019
9/1/2019
12/1/2019
3/1/2020
0
5
10
15
20
25
30
35
40
30
34
26
30 31
37
24
29 27
GREENCORE GROUP PLC
HILTON FOOD GROUP PLC
PREMIER FOODS PLC
Analyses- Premier Business may be claimed that it is successful in recovering the receivables
from other two companies within a shortened time span in view of the creditor’s payment period.
Although Hilton Food Company tries to reimburse its debtors for quite a bit longer. In fact,
Paraphrase This Document
Need a fresh take? Get an instant paraphrase of this document with our AI Paraphraser

Green Core Company has been able to decrease the turnaround time of trade debts over a
shortened duration in 2020 relative to 2019.
Credit period:
3/1/2018
6/1/2018
9/1/2018
12/1/2018
3/1/2019
6/1/2019
9/1/2019
12/1/2019
3/1/2020
0
10
20
30
40
50
60
70
47 50 54
59
65 65
GREENCORE GROUP PLC
HILTON FOOD GROUP PLC
PREMIER FOODS PLC
Analyses- Both Green Key Business and Hilton Fast Food chain have identical payout periods,
both under the same timeframe, clearing their legal and policy. Hilton Food Corporation takes
more time to meet its brief commitments.
Current ratio:
3/1/2018
6/1/2018
9/1/2018
12/1/2018
3/1/2019
6/1/2019
9/1/2019
12/1/2019
3/1/2020
0
0.5
1
1.5
2
2.5
0.75
2.01
0.69
1.2 1.23
1.05
0.78 0.78
0.98 GREENCORE GROUP PLC
HILTON FOOD GROUP PLC
PREMIER FOODS PLC

Analyses: In the above illustration, this may be it from the suggested current ratio generally
presumed to be 2 which Green Core plc only could maintain such a ratio in the year-2019 at this
level. Whereas other companies were reluctant to do so due to higher current obligations.
Net assets turnover ratio
3/1/2018
6/1/2018
9/1/2018
12/1/2018
3/1/2019
6/1/2019
9/1/2019
12/1/2019
3/1/2020
0
1
2
3
4
5
6
7
1.49 1.81 2.06
6.53
5.56
3.58
0.42 0.42 0.32
GREENCORE GROUP PLC
HILTON FOOD GROUP PLC
PREMIER FOODS PLC
Analysis- This can be seen on the basis of the above map that the Hilton Food Group business
has a healthier combination as this is prepared to handle its assets with much less timeline and
cost (Zhu, Zhang and Yu, 2017). Although Premier nutrition has a lower proportion, its states
that its cash cannot be regulated by the firm.
Shareholder fund per employee-
⊘ This is a preview!⊘
Do you want full access?
Subscribe today to unlock all pages.

Trusted by 1+ million students worldwide
1 out of 17
Related Documents

Your All-in-One AI-Powered Toolkit for Academic Success.
 +13062052269
info@desklib.com
Available 24*7 on WhatsApp / Email
Unlock your academic potential
Copyright © 2020–2025 A2Z Services. All Rights Reserved. Developed and managed by ZUCOL.