Finance Report: D1 and D2 Profitability and ROI Analysis

Verified

Added on  2023/01/10

|5
|408
|21
Report
AI Summary
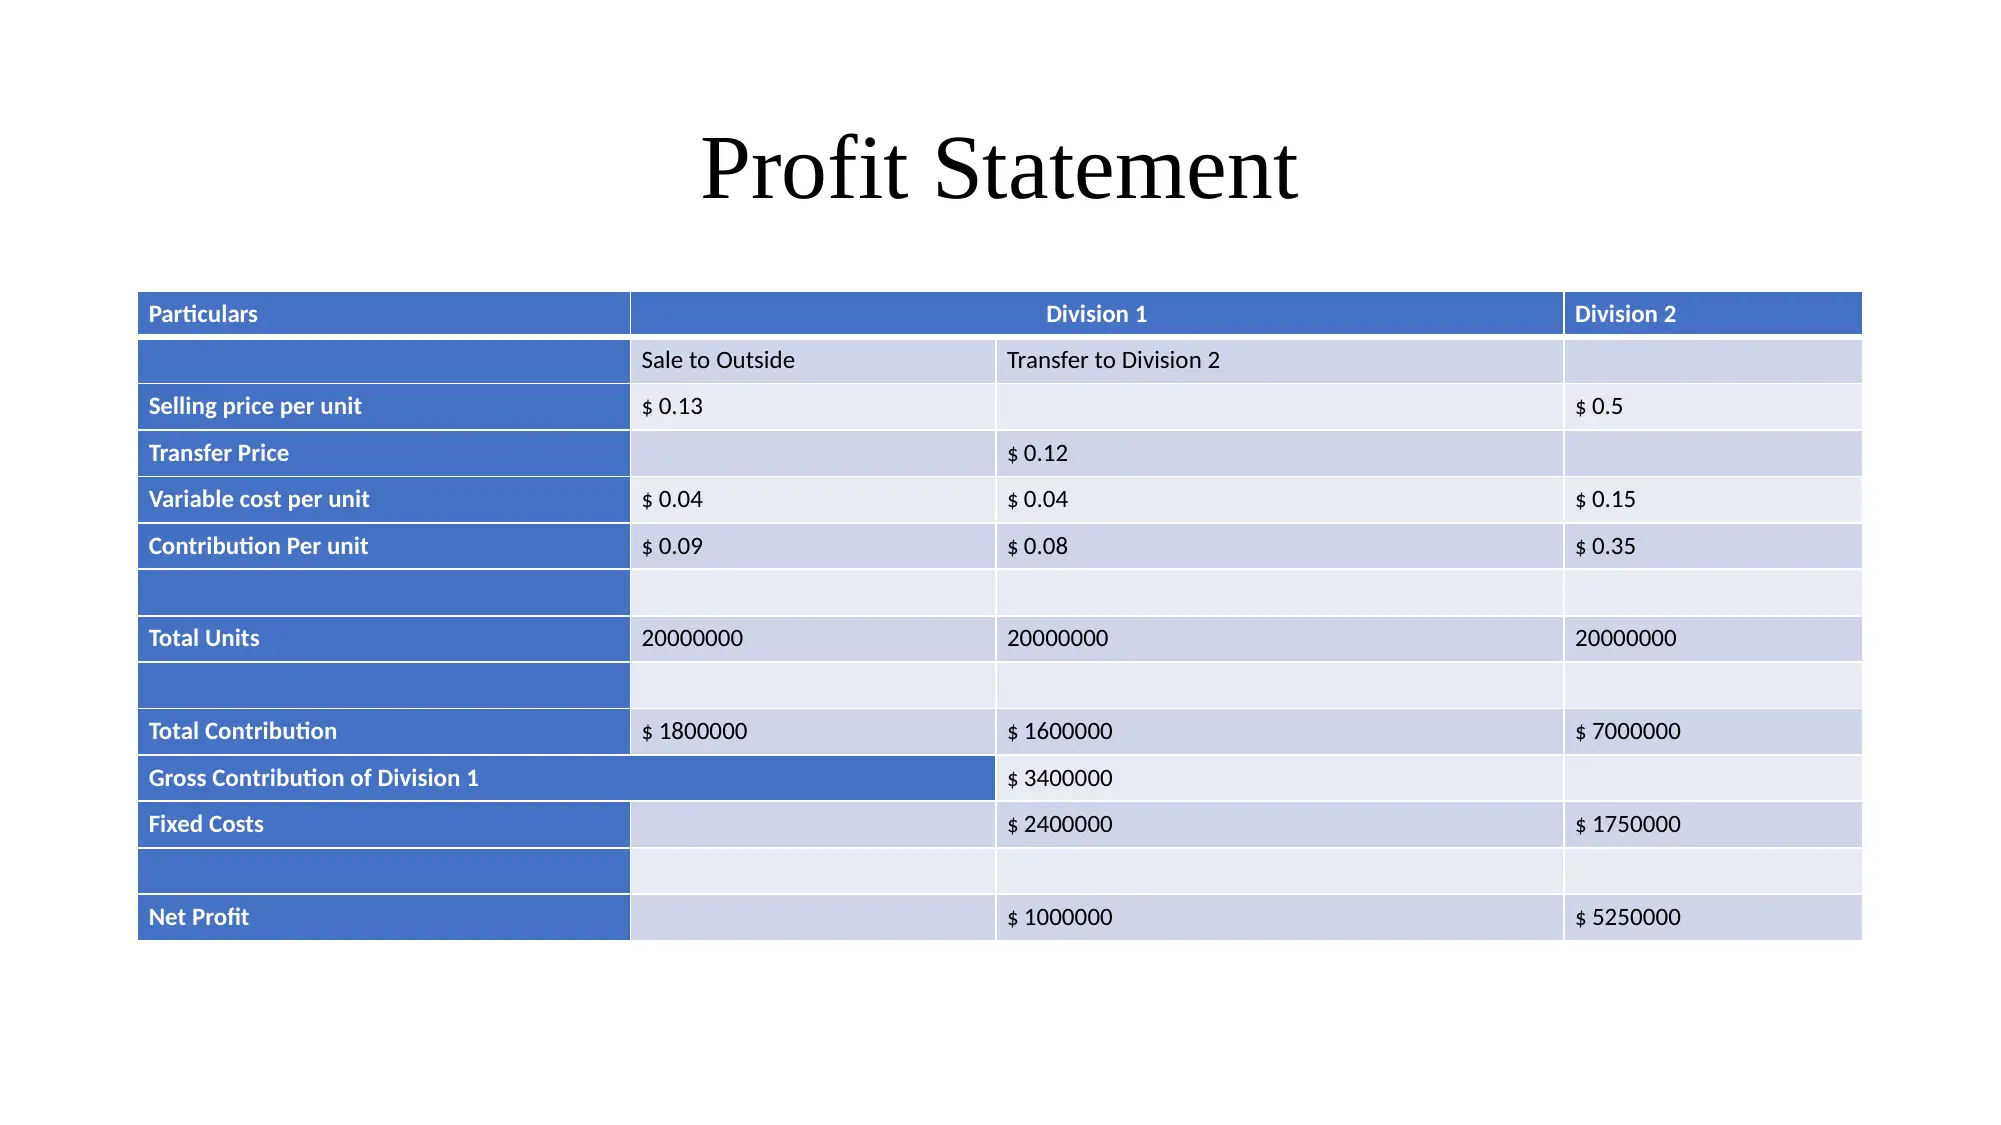
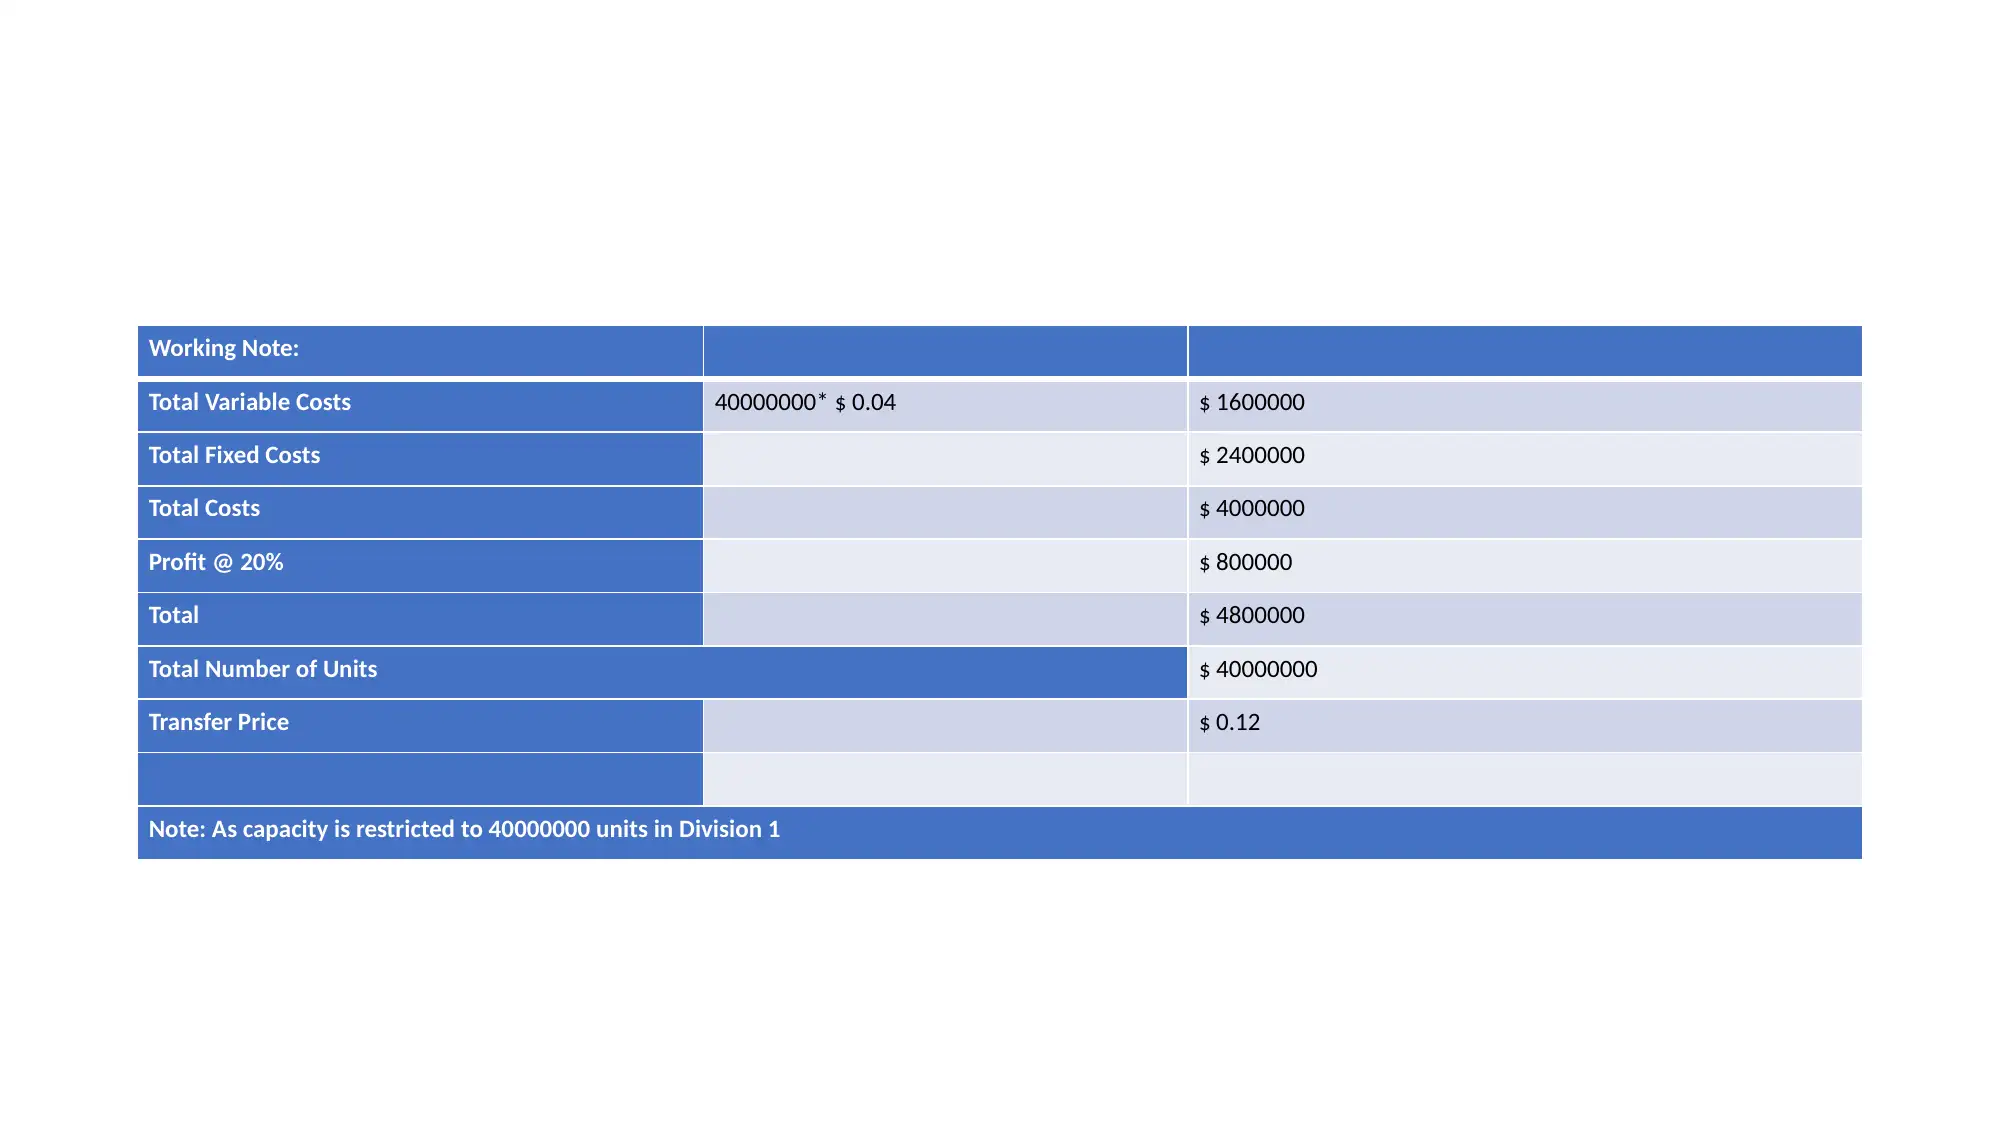
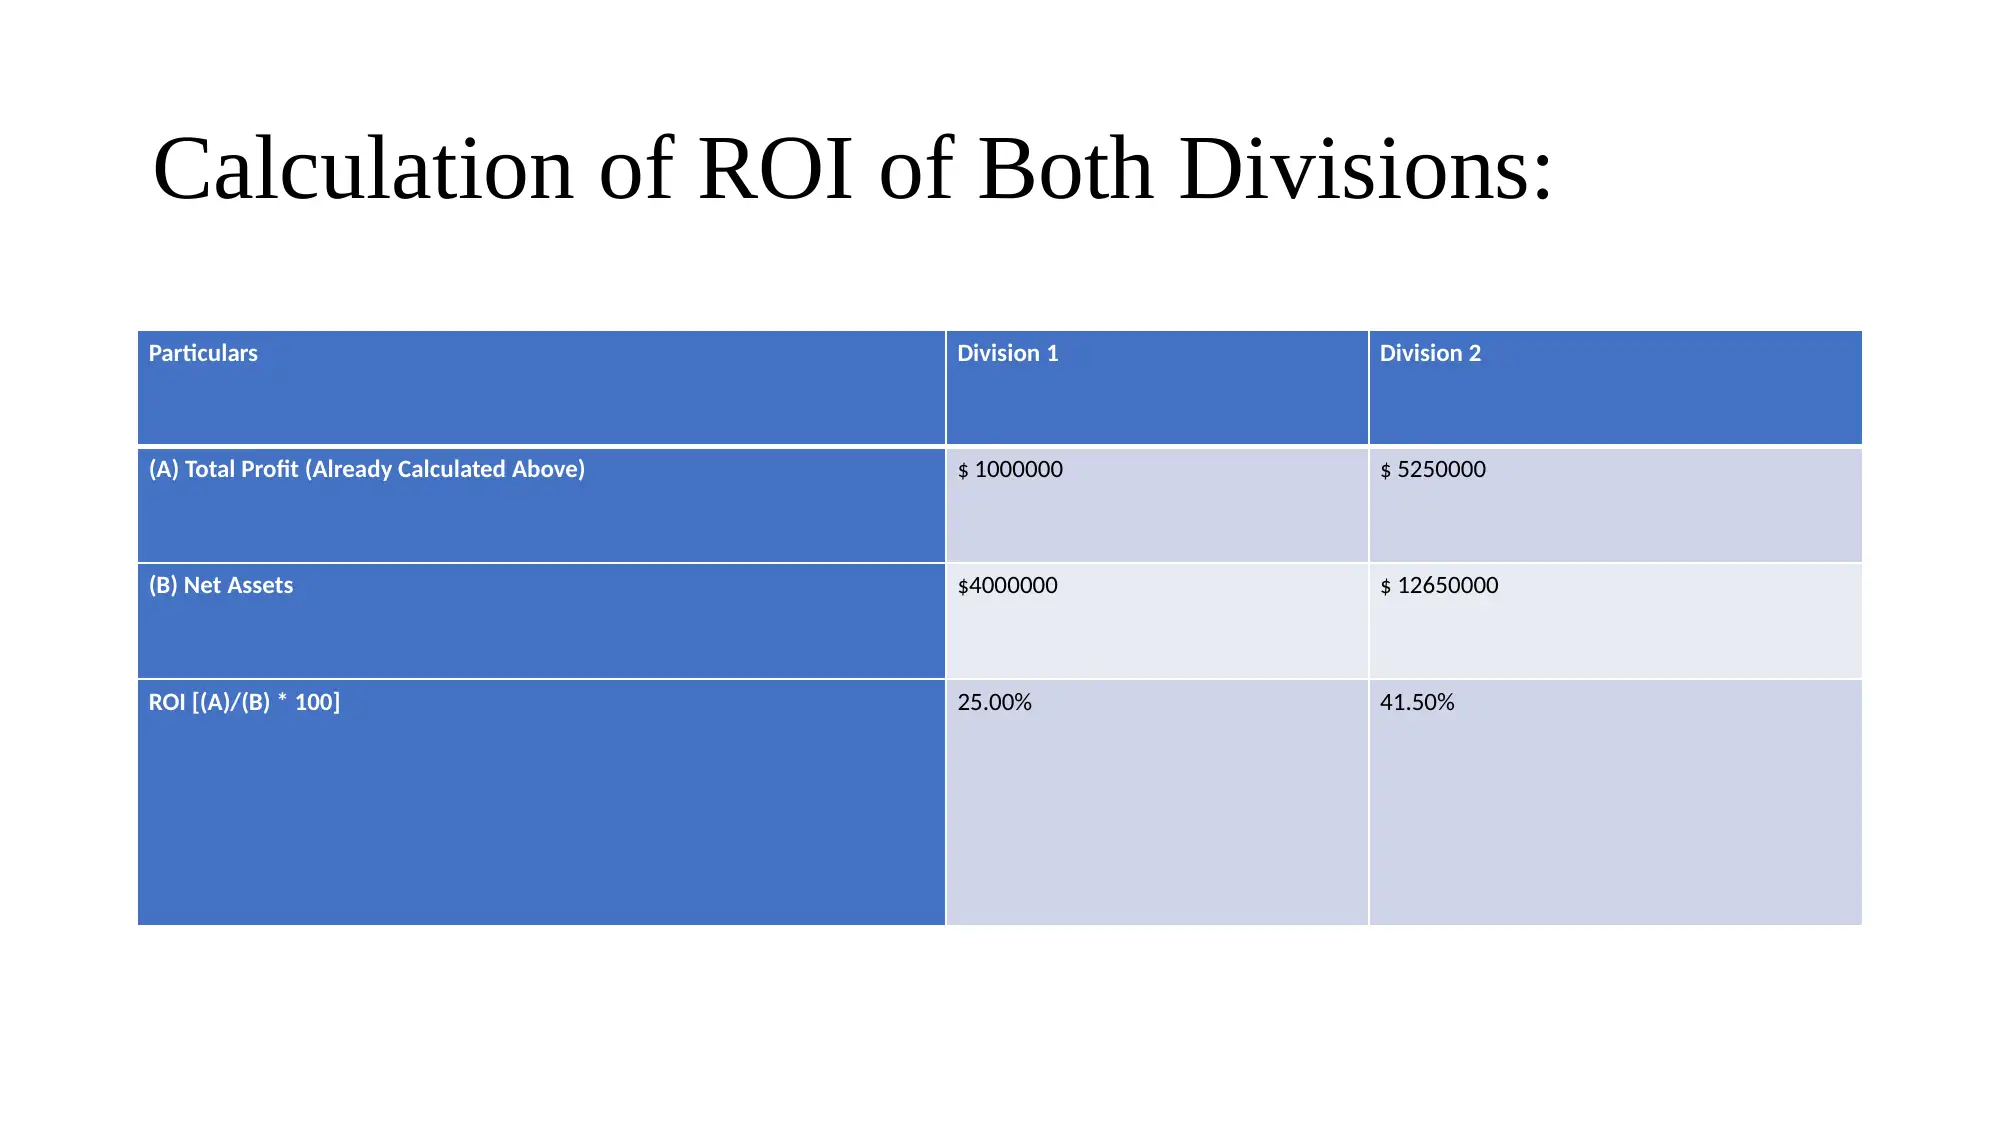
This report presents a detailed analysis of the profit statements for Divisions D1 and D2, focusing on their profitability and Return on Investment (ROI). The analysis includes calculations of contribution per unit, total contribution, and net profit for each division. It also examines the impact of transfer pricing on divisional performance, highlighting the potential conflicts that can arise when transfer prices are set below market value. The report provides a working note detailing the total variable costs, fixed costs, and profit calculations. Furthermore, it assesses the ROI of both divisions, comparing them against a market ROI benchmark. The commentary emphasizes the importance of considering capacity constraints, fairness in transfer pricing, and the potential for capacity expansion in the more profitable division. This analysis is based on the provided budget information, including selling prices, variable costs, fixed costs, and net assets for both divisions, and aims to offer insights for strategic decision-making. The document is a solution to an accounting and finance assignment, offering a comprehensive overview of the financial performance of the two divisions and is available on Desklib for students to use for study purposes.
Document Page
Accounting and Finance
tabler-icon-diamond-filled.svg

Secure Best Marks with AI Grader

Need help grading? Try our AI Grader for instant feedback on your assignments.
Document Page
Profit Statement
Particulars Division 1 Division 2
Sale to Outside Transfer to Division 2
Selling price per unit $ 0.13 $ 0.5
Transfer Price $ 0.12
Variable cost per unit $ 0.04 $ 0.04 $ 0.15
Contribution Per unit $ 0.09 $ 0.08 $ 0.35
Total Units 20000000 20000000 20000000
Total Contribution $ 1800000 $ 1600000 $ 7000000
Gross Contribution of Division 1 $ 3400000
Fixed Costs $ 2400000 $ 1750000
Net Profit $ 1000000 $ 5250000
Document Page
Working Note:
Total Variable Costs 40000000* $ 0.04 $ 1600000
Total Fixed Costs $ 2400000
Total Costs $ 4000000
Profit @ 20% $ 800000
Total $ 4800000
Total Number of Units $ 40000000
Transfer Price $ 0.12
Note: As capacity is restricted to 40000000 units in Division 1
Document Page
Calculation of ROI of Both Divisions:
Particulars Division 1 Division 2
(A) Total Profit (Already Calculated Above) $ 1000000 $ 5250000
(B) Net Assets $4000000 $ 12650000
ROI [(A)/(B) * 100] 25.00% 41.50%
tabler-icon-diamond-filled.svg

Secure Best Marks with AI Grader

Need help grading? Try our AI Grader for instant feedback on your assignments.
Document Page
Brief commentary
As stated in task in Division 1, overall capacity of production is acting as limiting or restricting factor. Based
on corporation's policies, Division 1 expected to be fulfilled demand of Division 2 prior to selling its
products. Transfer pricing among both divisions is 0.12 that is lower than actual price within market. It led to
decline in profit margin for division 1 and decreased costs of Division 2. As overall divisional performances
are derived based on ROI as well as division’s residual income, this will lead to benefits for managing
officials of Division 2 and deficit for managing officials of Division 1. This situation may lead to conflicts
among both divisions. Therefore, corporation has to allocate entire transfer price to Division 1 with line to
external sales price to preserve fairness among departments.
Here given that ROI of Market is 7 percent. Comparatively, both these corporations are profitable as per
computation of ROI of both divisions above. Notable aspect here is that Division 2 offers around double ROI
percent as compare to Division 1. Thus, corporation should emphasise on making expansion of capacity of
Division 2 in attempt to enhance profitability, but post considering overall market demand of concerned
products.
chevron_up_icon
1 out of 5
circle_padding
hide_on_mobile
zoom_out_icon
[object Object]