Comprehensive Accounting and Finance Report for Business Analysis
VerifiedAdded on 2023/01/19
|16
|3423
|46
Report
AI Summary
This report provides a comprehensive overview of accounting and finance principles, with a focus on practical application through the analysis of financial statements and investment decisions. The report begins with an introduction to accounting and finance, emphasizing their roles in managing business finances and making informed predictions. Part A presents an income statement and balance sheet for Terry Joe Plc, demonstrating the calculation of profit and financial position. Part B delves into cost analysis, including contribution, break-even points, and the impact of changes in sales price, along with assumptions of the break-even model. Part C explores investment appraisal techniques such as payback period, accounting rate of return (ARR), and net present value (NPV), discussing their applications and benefits in strategic planning. The report concludes with a summary of key findings and references to support the analysis. Overall, the report provides a practical understanding of accounting and finance concepts and their application in real-world business scenarios, using various financial tools and cost statements to make informed investment decisions and assess business performance.
Introduction to Accounting
and Finance
and Finance
Paraphrase This Document
Need a fresh take? Get an instant paraphrase of this document with our AI Paraphraser
Table of Contents
INTRODUCTION...........................................................................................................................1
PART A...........................................................................................................................................1
Statement of Income...............................................................................................................1
PART B............................................................................................................................................4
a) Contribution........................................................................................................................4
b) Break even point and margin of safety..............................................................................4
c) Calculate profit...................................................................................................................5
d) New sales price..................................................................................................................5
e) Assumption of break event model......................................................................................6
PART C ...........................................................................................................................................7
a) Pay back period, ARR and NPV........................................................................................7
b) Investment appraisal technique........................................................................................10
c) Benefits and limitations using budget as strategic planning............................................12
CONCLUSION..............................................................................................................................13
REFRENCES.................................................................................................................................14
INTRODUCTION
Accounting and finance deals with managing money for each each business organisation
both the terms are used for different purposes. As accounting deals more with what is performed
in past on the other hand finance is about making good predictions for future transactions
(Aggarwal and Goodell, 2014). Each business organisation needs to manage its accounting and
finances to calculate how well business is performing and earning through its operations.
Through accounting business financial statements are prepared that helps in assessing true and
fair financial position of business. When businesses uses all the accounting standards and
guidelines defined in the law it helps in estimating financial requirements of a business that
needs to be managed through effective financial planning. Business organisation to make
financial decisions needs to know regarding how well business is performing and accounting
provides with the required information. In this project with using accounting and financing
concept profitability statements and balance sheet of a business organisation will be prepared.
Together with this financial tools, cost statements and investment decision will be made using
different concepts of accounting and financing.
PART A
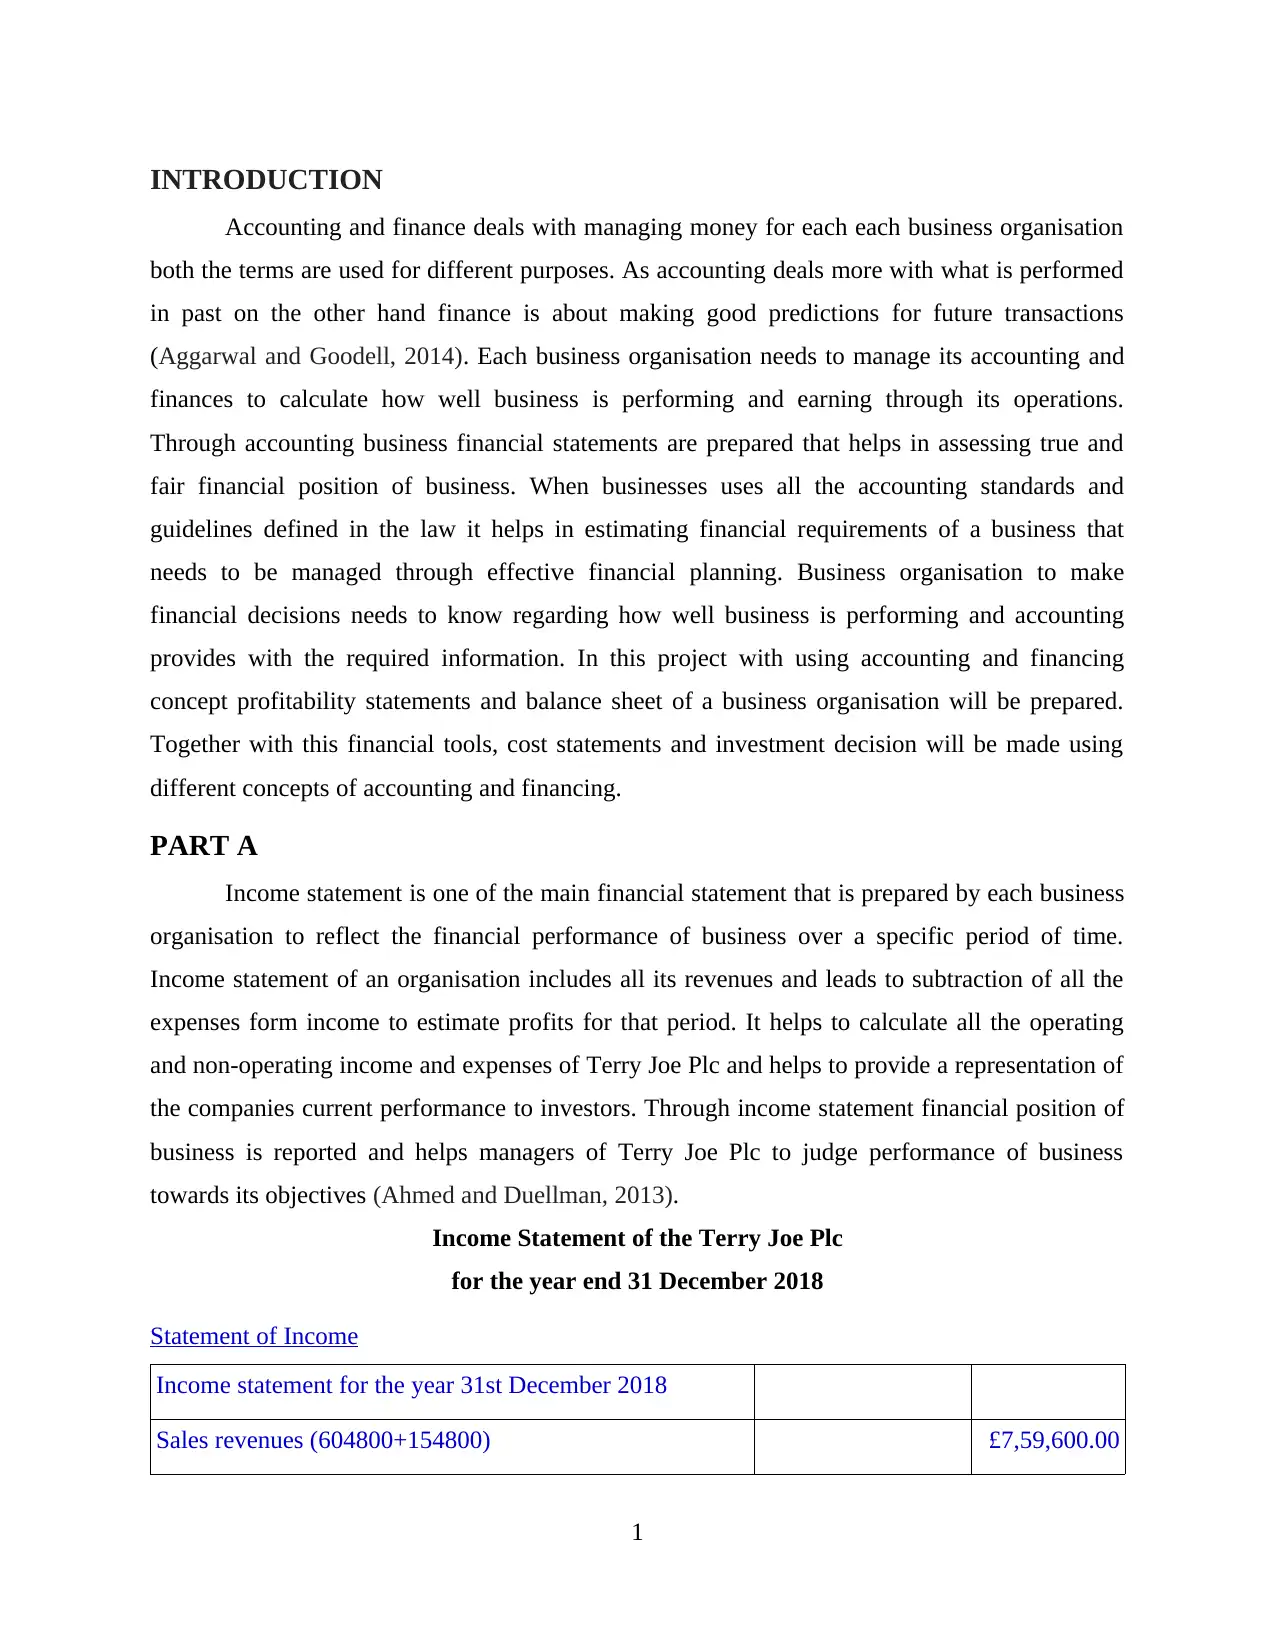
Income statement is one of the main financial statement that is prepared by each business
organisation to reflect the financial performance of business over a specific period of time.
Income statement of an organisation includes all its revenues and leads to subtraction of all the
expenses form income to estimate profits for that period. It helps to calculate all the operating
and non-operating income and expenses of Terry Joe Plc and helps to provide a representation of
the companies current performance to investors. Through income statement financial position of
business is reported and helps managers of Terry Joe Plc to judge performance of business
towards its objectives (Ahmed and Duellman, 2013).
Income Statement of the Terry Joe Plc
for the year end 31 December 2018
Statement of Income
Income statement for the year 31st December 2018
Sales revenues (604800+154800) £7,59,600.00
1
Accounting and finance deals with managing money for each each business organisation
both the terms are used for different purposes. As accounting deals more with what is performed
in past on the other hand finance is about making good predictions for future transactions
(Aggarwal and Goodell, 2014). Each business organisation needs to manage its accounting and
finances to calculate how well business is performing and earning through its operations.
Through accounting business financial statements are prepared that helps in assessing true and
fair financial position of business. When businesses uses all the accounting standards and
guidelines defined in the law it helps in estimating financial requirements of a business that
needs to be managed through effective financial planning. Business organisation to make
financial decisions needs to know regarding how well business is performing and accounting
provides with the required information. In this project with using accounting and financing
concept profitability statements and balance sheet of a business organisation will be prepared.
Together with this financial tools, cost statements and investment decision will be made using
different concepts of accounting and financing.
PART A
Income statement is one of the main financial statement that is prepared by each business
organisation to reflect the financial performance of business over a specific period of time.
Income statement of an organisation includes all its revenues and leads to subtraction of all the
expenses form income to estimate profits for that period. It helps to calculate all the operating
and non-operating income and expenses of Terry Joe Plc and helps to provide a representation of
the companies current performance to investors. Through income statement financial position of
business is reported and helps managers of Terry Joe Plc to judge performance of business
towards its objectives (Ahmed and Duellman, 2013).
Income Statement of the Terry Joe Plc
for the year end 31 December 2018
Statement of Income
Income statement for the year 31st December 2018
Sales revenues (604800+154800) £7,59,600.00
1
⊘ This is a preview!⊘
Do you want full access?
Subscribe today to unlock all pages.
Trusted by 1+ million students worldwide
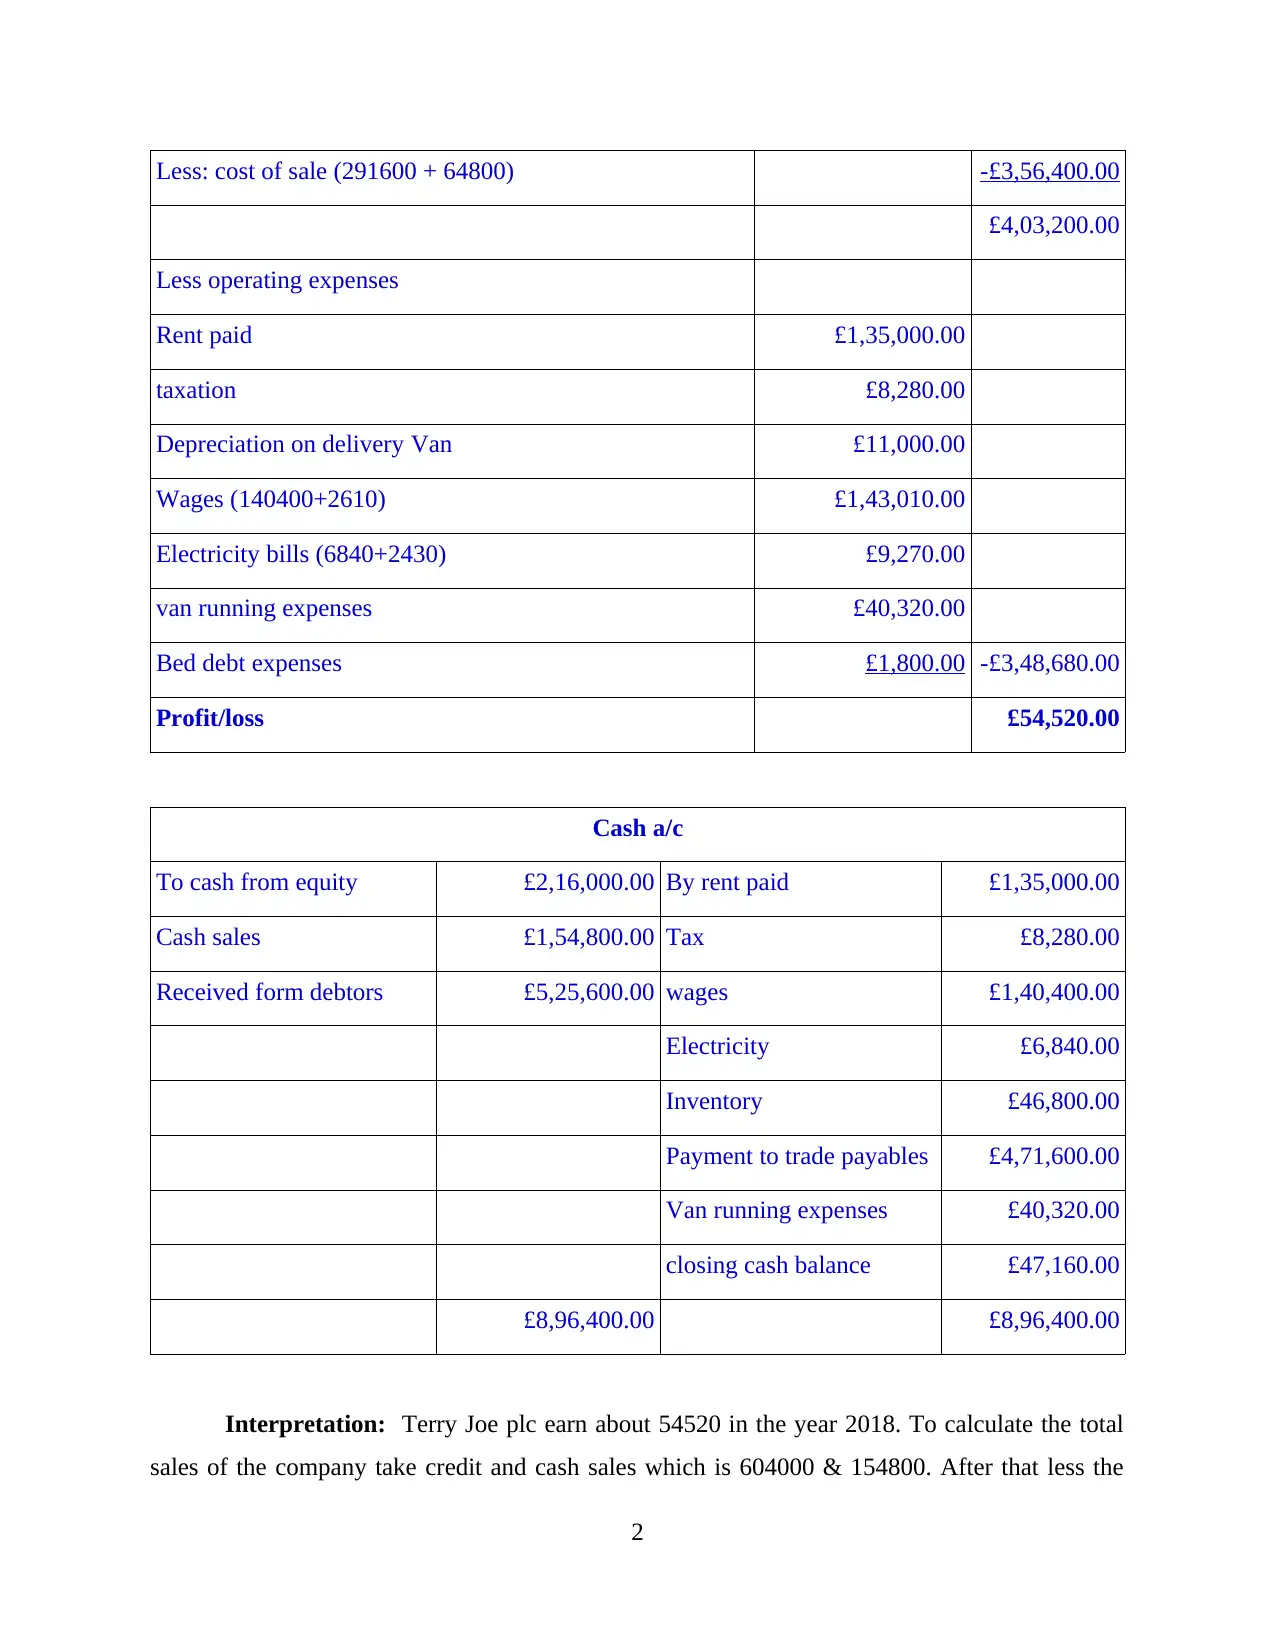
Less: cost of sale (291600 + 64800) -£3,56,400.00
£4,03,200.00
Less operating expenses
Rent paid £1,35,000.00
taxation £8,280.00
Depreciation on delivery Van £11,000.00
Wages (140400+2610) £1,43,010.00
Electricity bills (6840+2430) £9,270.00
van running expenses £40,320.00
Bed debt expenses £1,800.00 -£3,48,680.00
Profit/loss £54,520.00
Cash a/c
To cash from equity £2,16,000.00 By rent paid £1,35,000.00
Cash sales £1,54,800.00 Tax £8,280.00
Received form debtors £5,25,600.00 wages £1,40,400.00
Electricity £6,840.00
Inventory £46,800.00
Payment to trade payables £4,71,600.00
Van running expenses £40,320.00
closing cash balance £47,160.00
£8,96,400.00 £8,96,400.00
Interpretation: Terry Joe plc earn about 54520 in the year 2018. To calculate the total
sales of the company take credit and cash sales which is 604000 & 154800. After that less the
2
Paraphrase This Document
Need a fresh take? Get an instant paraphrase of this document with our AI Paraphraser
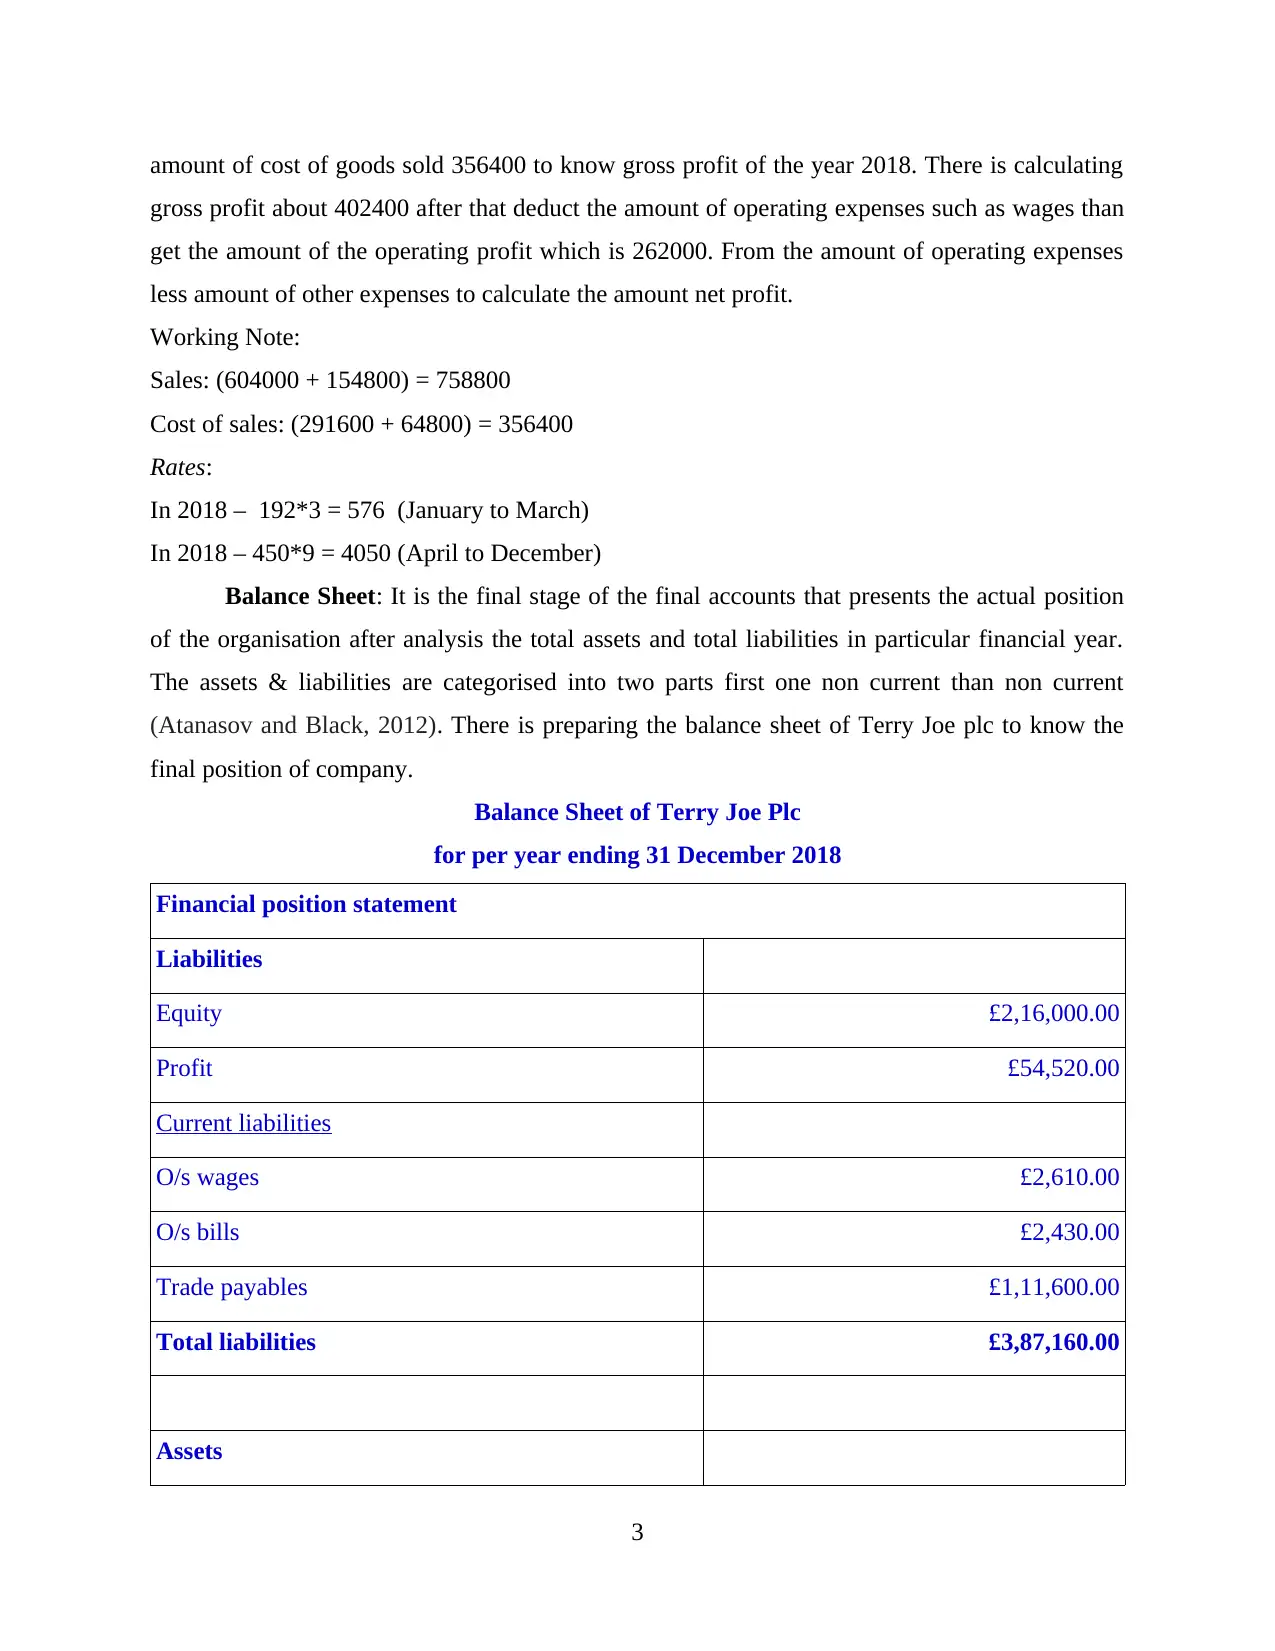
amount of cost of goods sold 356400 to know gross profit of the year 2018. There is calculating
gross profit about 402400 after that deduct the amount of operating expenses such as wages than
get the amount of the operating profit which is 262000. From the amount of operating expenses
less amount of other expenses to calculate the amount net profit.
Working Note:
Sales: (604000 + 154800) = 758800
Cost of sales: (291600 + 64800) = 356400
Rates:
In 2018 – 192*3 = 576 (January to March)
In 2018 – 450*9 = 4050 (April to December)
Balance Sheet: It is the final stage of the final accounts that presents the actual position
of the organisation after analysis the total assets and total liabilities in particular financial year.
The assets & liabilities are categorised into two parts first one non current than non current
(Atanasov and Black, 2012). There is preparing the balance sheet of Terry Joe plc to know the
final position of company.
Balance Sheet of Terry Joe Plc
for per year ending 31 December 2018
Financial position statement
Liabilities
Equity £2,16,000.00
Profit £54,520.00
Current liabilities
O/s wages £2,610.00
O/s bills £2,430.00
Trade payables £1,11,600.00
Total liabilities £3,87,160.00
Assets
3
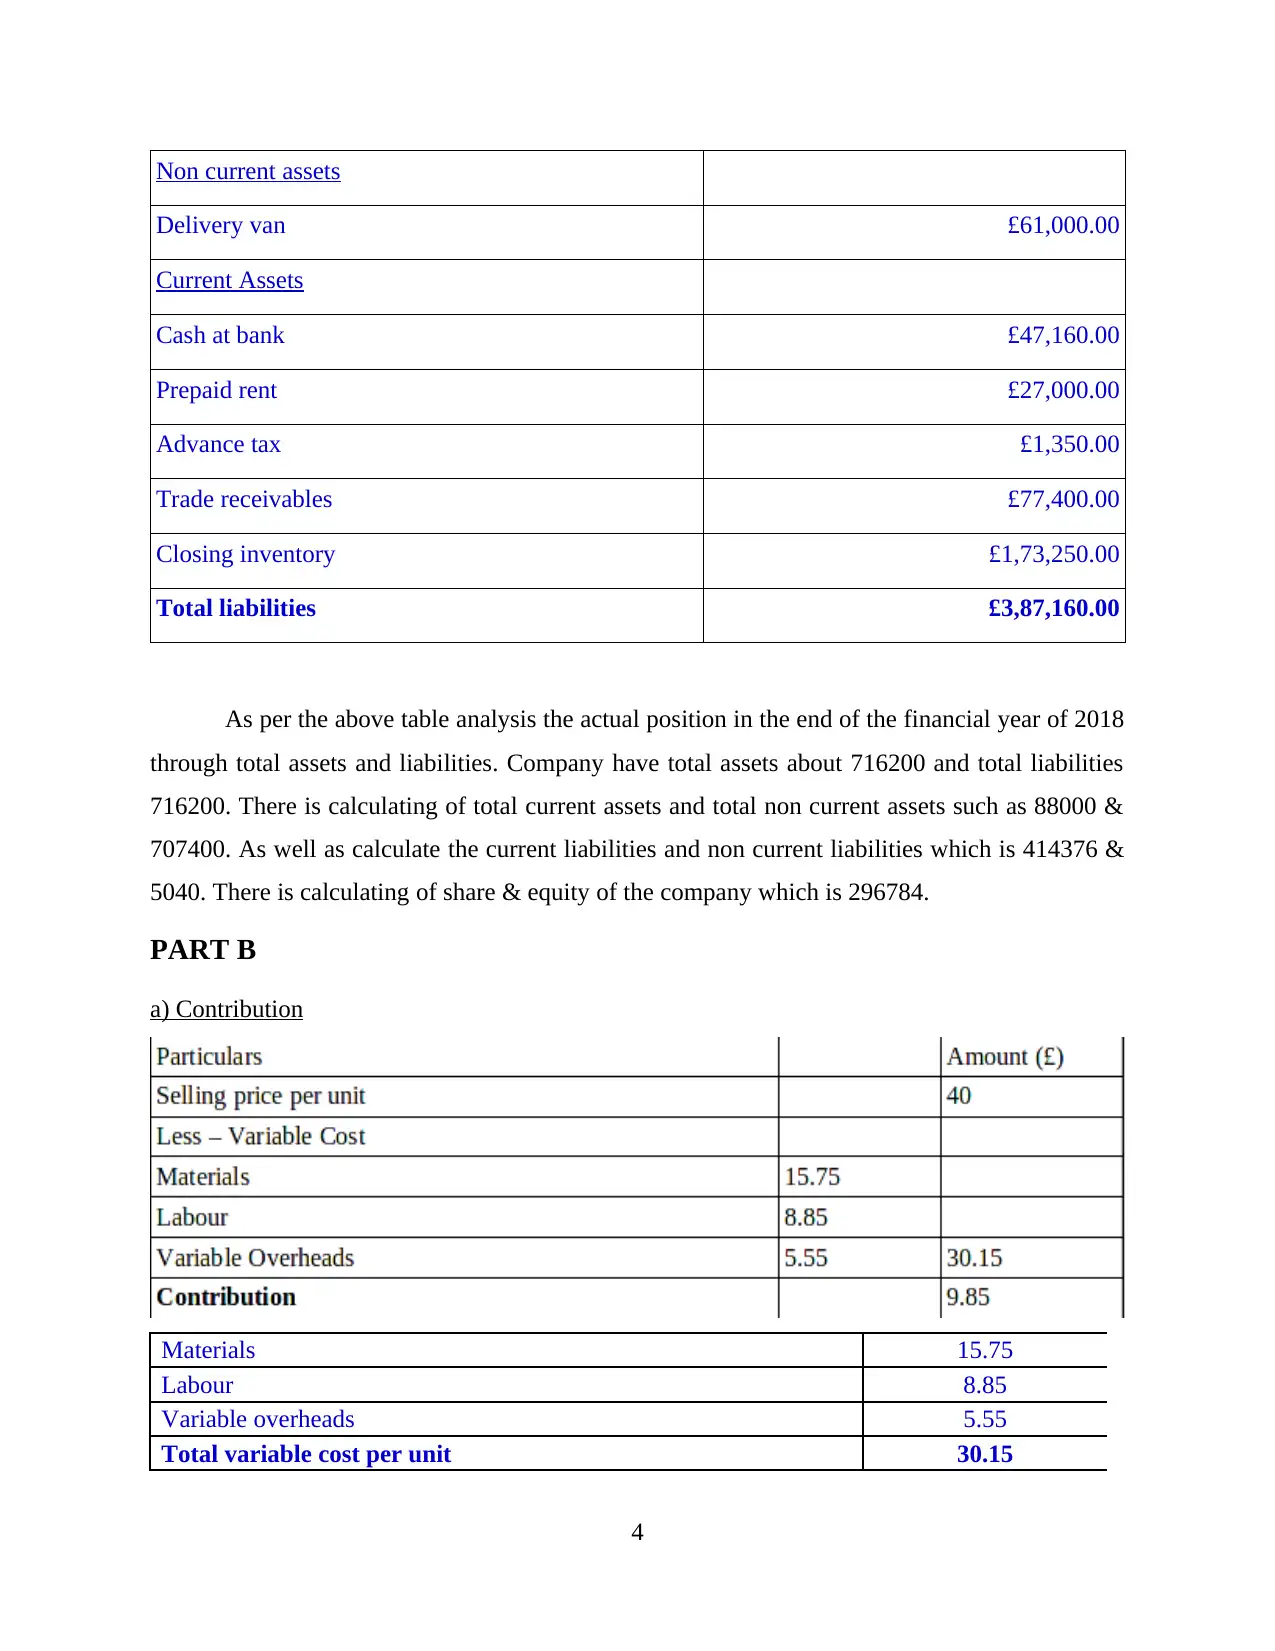
Non current assets
Delivery van £61,000.00
Current Assets
Cash at bank £47,160.00
Prepaid rent £27,000.00
Advance tax £1,350.00
Trade receivables £77,400.00
Closing inventory £1,73,250.00
Total liabilities £3,87,160.00
As per the above table analysis the actual position in the end of the financial year of 2018
through total assets and liabilities. Company have total assets about 716200 and total liabilities
716200. There is calculating of total current assets and total non current assets such as 88000 &
707400. As well as calculate the current liabilities and non current liabilities which is 414376 &
5040. There is calculating of share & equity of the company which is 296784.
PART B
a) Contribution
Materials 15.75
Labour 8.85
Variable overheads 5.55
Total variable cost per unit 30.15
4
⊘ This is a preview!⊘
Do you want full access?
Subscribe today to unlock all pages.
Trusted by 1+ million students worldwide
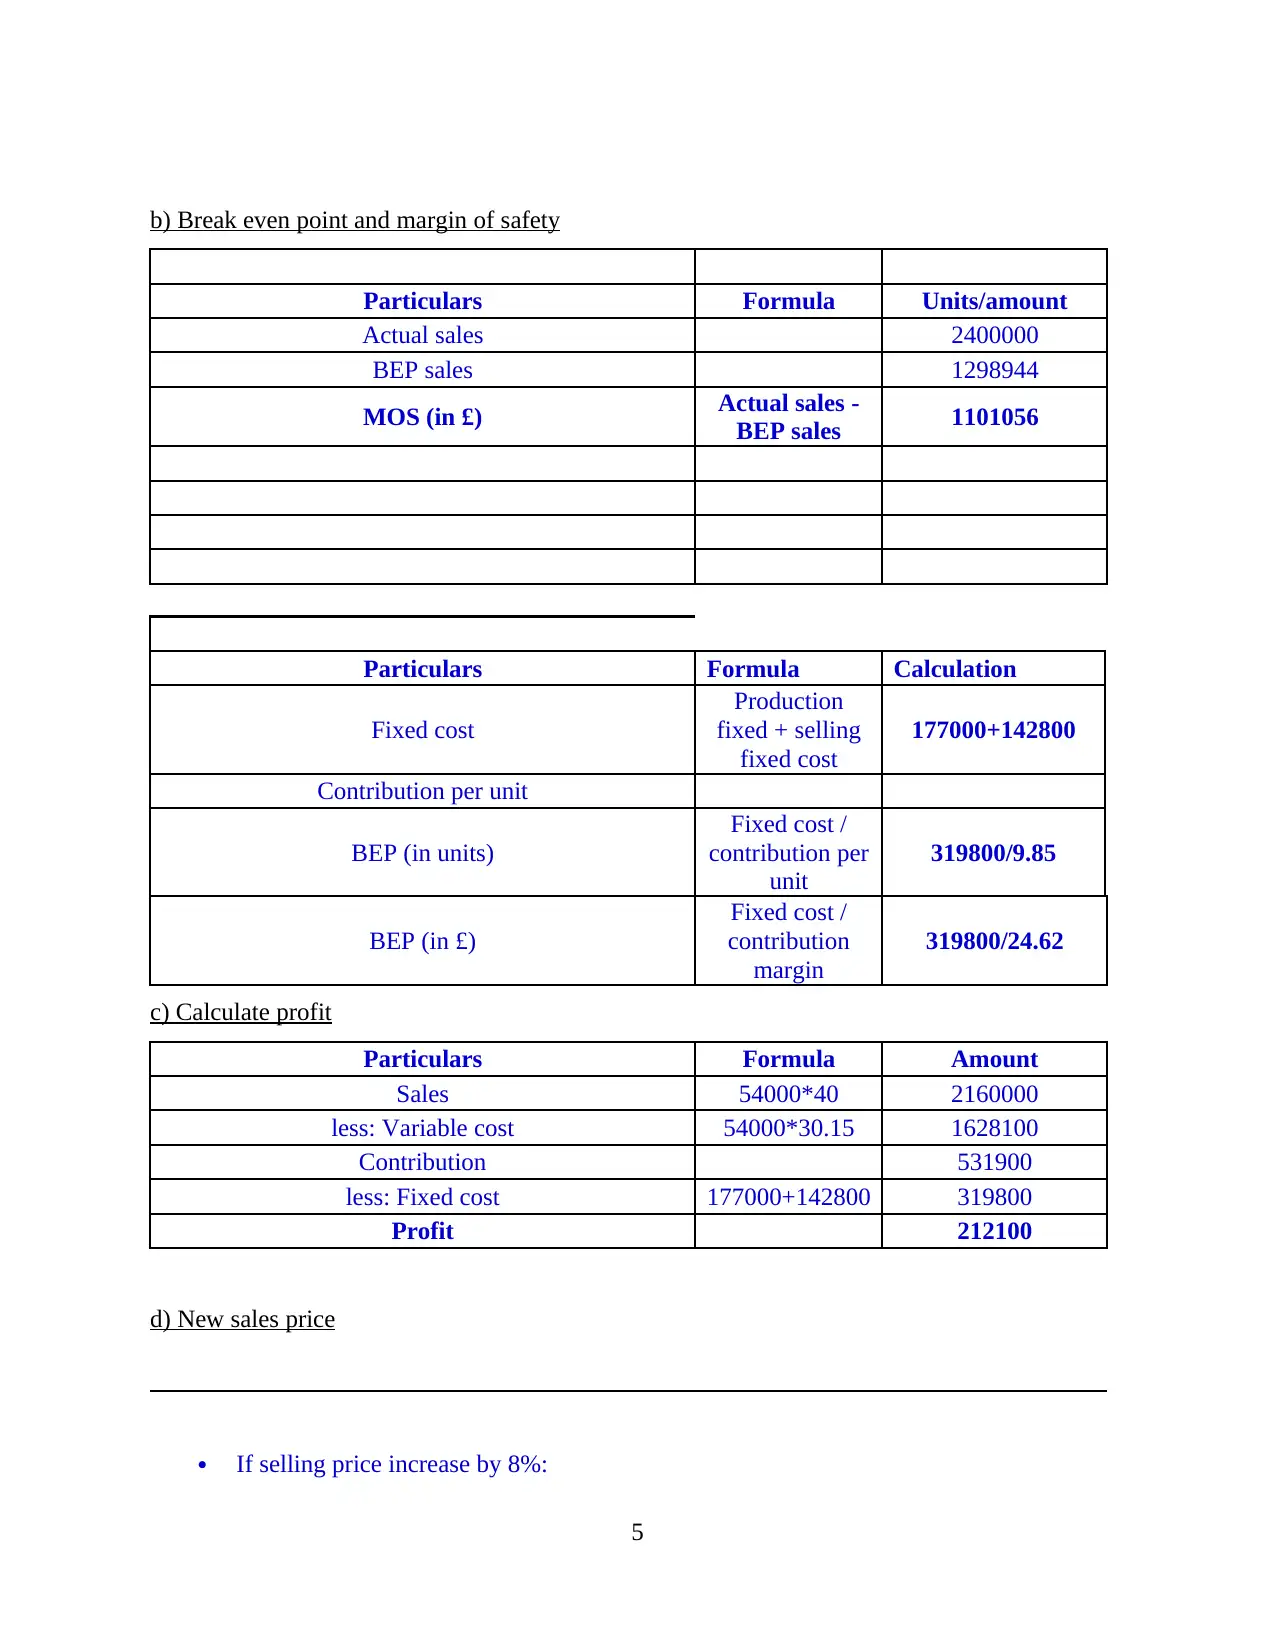
b) Break even point and margin of safety
Particulars Formula Units/amount
Actual sales 2400000
BEP sales 1298944
MOS (in £) Actual sales -
BEP sales 1101056
Particulars Formula Calculation
Fixed cost
Production
fixed + selling
fixed cost
177000+142800
Contribution per unit
BEP (in units)
Fixed cost /
contribution per
unit
319800/9.85
BEP (in £)
Fixed cost /
contribution
margin
319800/24.62
c) Calculate profit
Particulars Formula Amount
Sales 54000*40 2160000
less: Variable cost 54000*30.15 1628100
Contribution 531900
less: Fixed cost 177000+142800 319800
Profit 212100
d) New sales price
If selling price increase by 8%:
5
Paraphrase This Document
Need a fresh take? Get an instant paraphrase of this document with our AI Paraphraser
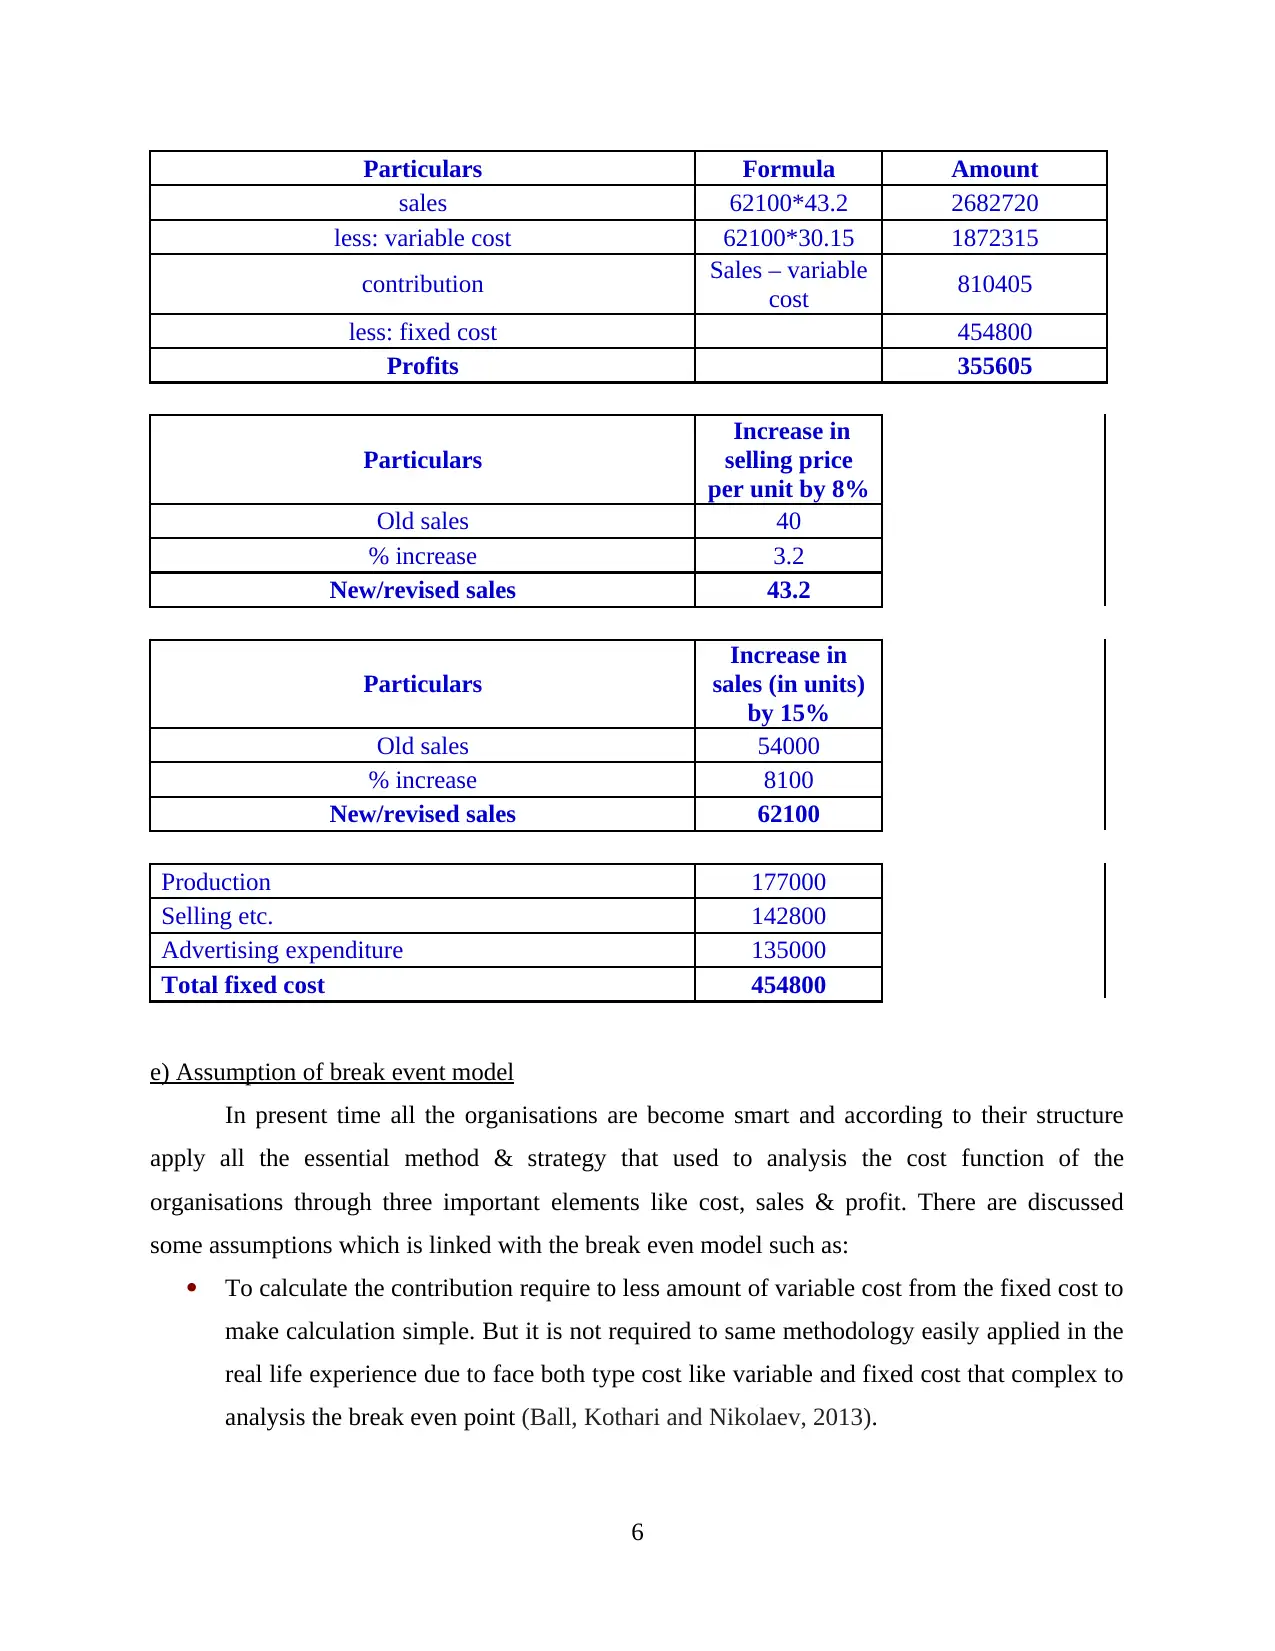
Particulars Formula Amount
sales 62100*43.2 2682720
less: variable cost 62100*30.15 1872315
contribution Sales – variable
cost 810405
less: fixed cost 454800
Profits 355605
Particulars
Increase in
selling price
per unit by 8%
Old sales 40
% increase 3.2
New/revised sales 43.2
Particulars
Increase in
sales (in units)
by 15%
Old sales 54000
% increase 8100
New/revised sales 62100
Production 177000
Selling etc. 142800
Advertising expenditure 135000
Total fixed cost 454800
e) Assumption of break event model
In present time all the organisations are become smart and according to their structure
apply all the essential method & strategy that used to analysis the cost function of the
organisations through three important elements like cost, sales & profit. There are discussed
some assumptions which is linked with the break even model such as:
To calculate the contribution require to less amount of variable cost from the fixed cost to
make calculation simple. But it is not required to same methodology easily applied in the
real life experience due to face both type cost like variable and fixed cost that complex to
analysis the break even point (Ball, Kothari and Nikolaev, 2013).
6
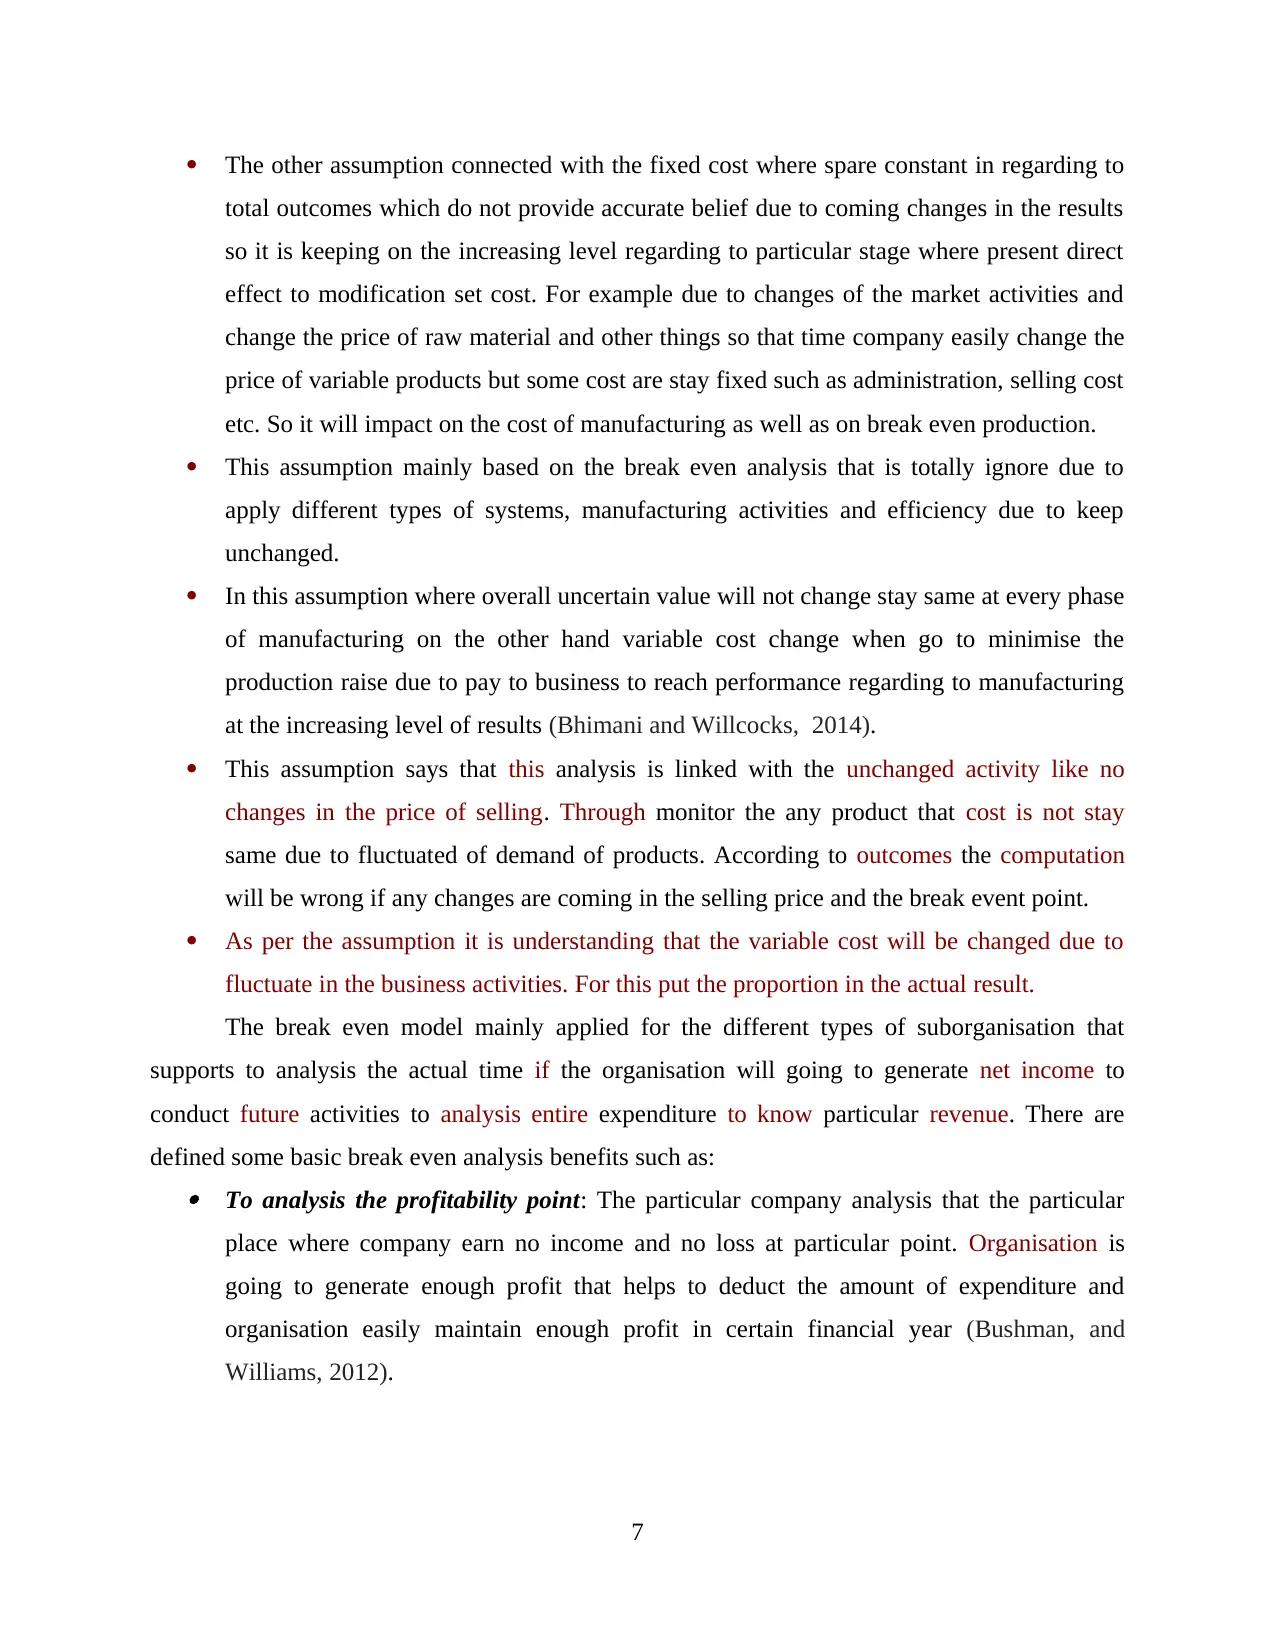
The other assumption connected with the fixed cost where spare constant in regarding to
total outcomes which do not provide accurate belief due to coming changes in the results
so it is keeping on the increasing level regarding to particular stage where present direct
effect to modification set cost. For example due to changes of the market activities and
change the price of raw material and other things so that time company easily change the
price of variable products but some cost are stay fixed such as administration, selling cost
etc. So it will impact on the cost of manufacturing as well as on break even production.
This assumption mainly based on the break even analysis that is totally ignore due to
apply different types of systems, manufacturing activities and efficiency due to keep
unchanged.
In this assumption where overall uncertain value will not change stay same at every phase
of manufacturing on the other hand variable cost change when go to minimise the
production raise due to pay to business to reach performance regarding to manufacturing
at the increasing level of results (Bhimani and Willcocks, 2014).
This assumption says that this analysis is linked with the unchanged activity like no
changes in the price of selling. Through monitor the any product that cost is not stay
same due to fluctuated of demand of products. According to outcomes the computation
will be wrong if any changes are coming in the selling price and the break event point.
As per the assumption it is understanding that the variable cost will be changed due to
fluctuate in the business activities. For this put the proportion in the actual result.
The break even model mainly applied for the different types of suborganisation that
supports to analysis the actual time if the organisation will going to generate net income to
conduct future activities to analysis entire expenditure to know particular revenue. There are
defined some basic break even analysis benefits such as: To analysis the profitability point: The particular company analysis that the particular
place where company earn no income and no loss at particular point. Organisation is
going to generate enough profit that helps to deduct the amount of expenditure and
organisation easily maintain enough profit in certain financial year (Bushman, and
Williams, 2012).
7
⊘ This is a preview!⊘
Do you want full access?
Subscribe today to unlock all pages.
Trusted by 1+ million students worldwide
To set effective price of product & services: It is providing help to organisations to set
the accurate price in order to generate enough profit to overcome from the over all
expenses.
PART C
a) Pay back period, ARR and NPV
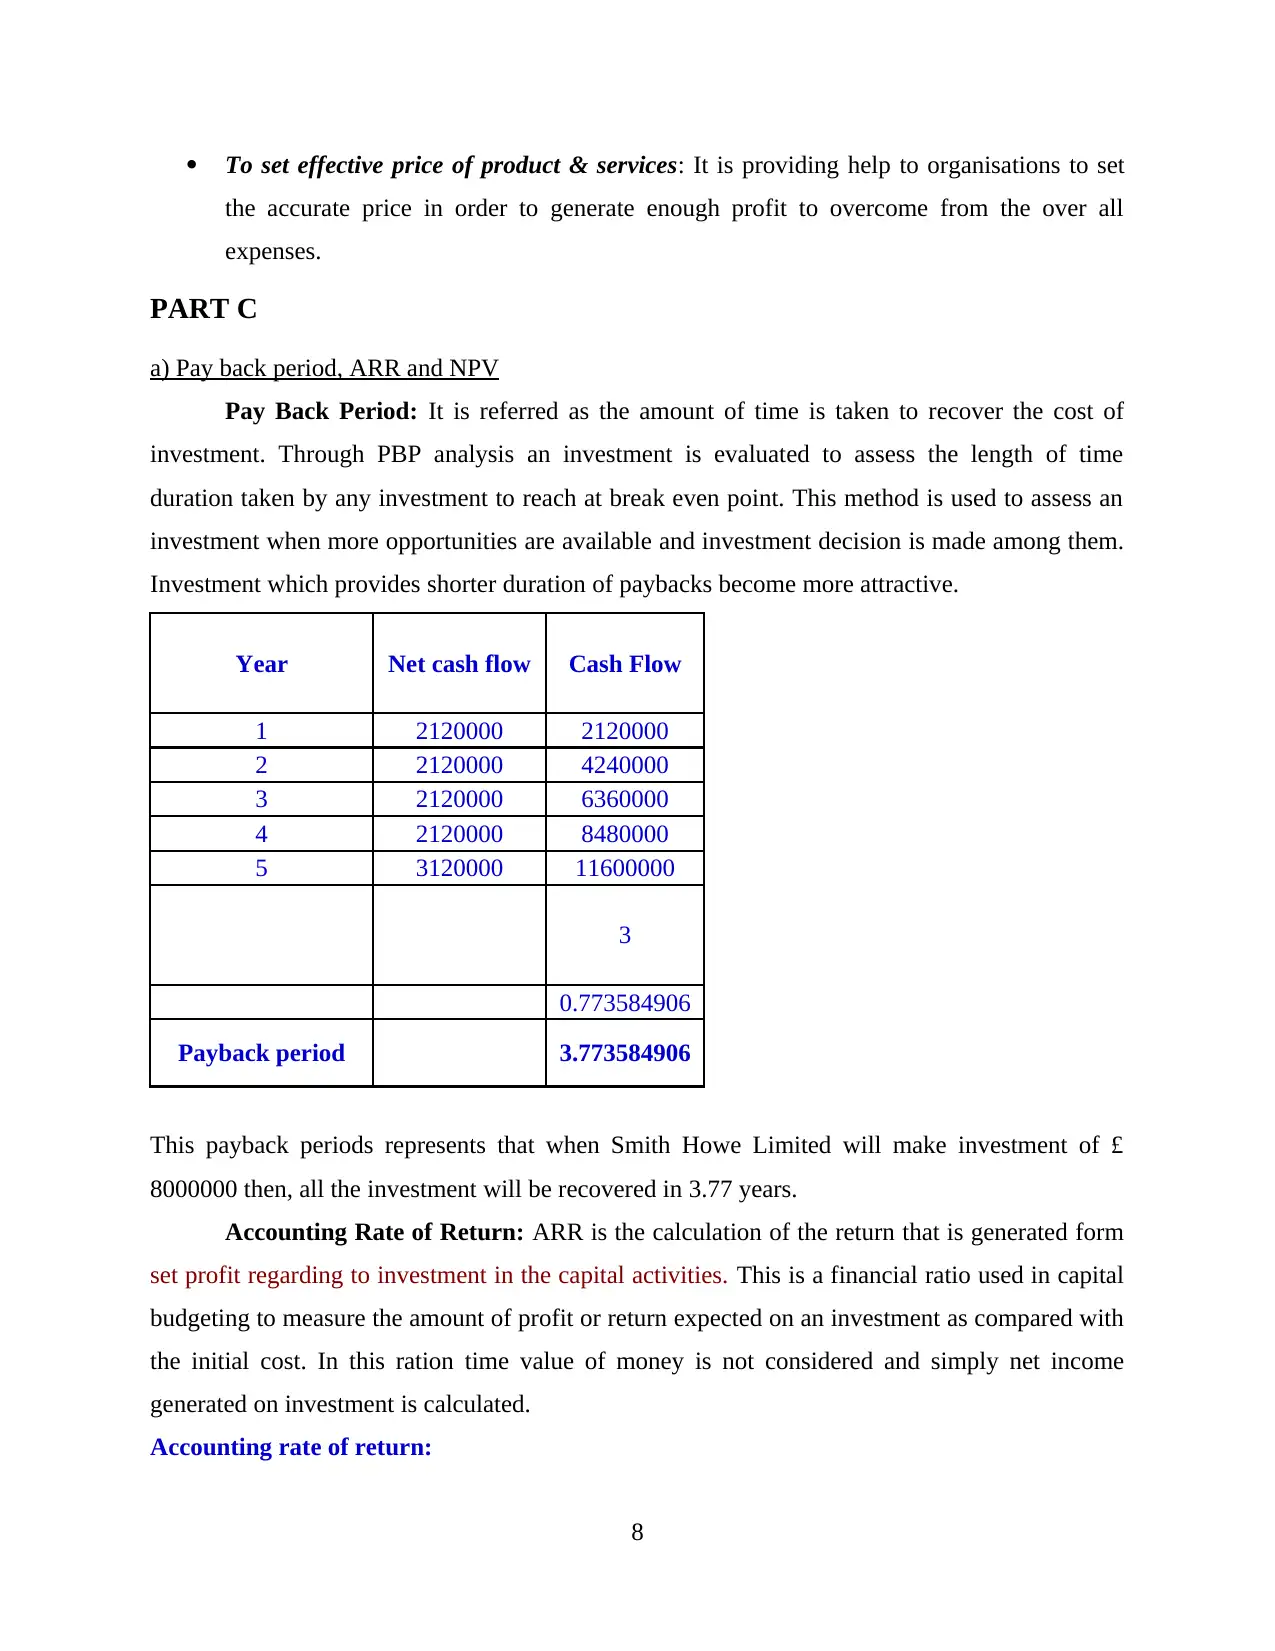
Pay Back Period: It is referred as the amount of time is taken to recover the cost of
investment. Through PBP analysis an investment is evaluated to assess the length of time
duration taken by any investment to reach at break even point. This method is used to assess an
investment when more opportunities are available and investment decision is made among them.
Investment which provides shorter duration of paybacks become more attractive.
Year Net cash flow Cash Flow
1 2120000 2120000
2 2120000 4240000
3 2120000 6360000
4 2120000 8480000
5 3120000 11600000
3
0.773584906
Payback period 3.773584906
This payback periods represents that when Smith Howe Limited will make investment of £
8000000 then, all the investment will be recovered in 3.77 years.
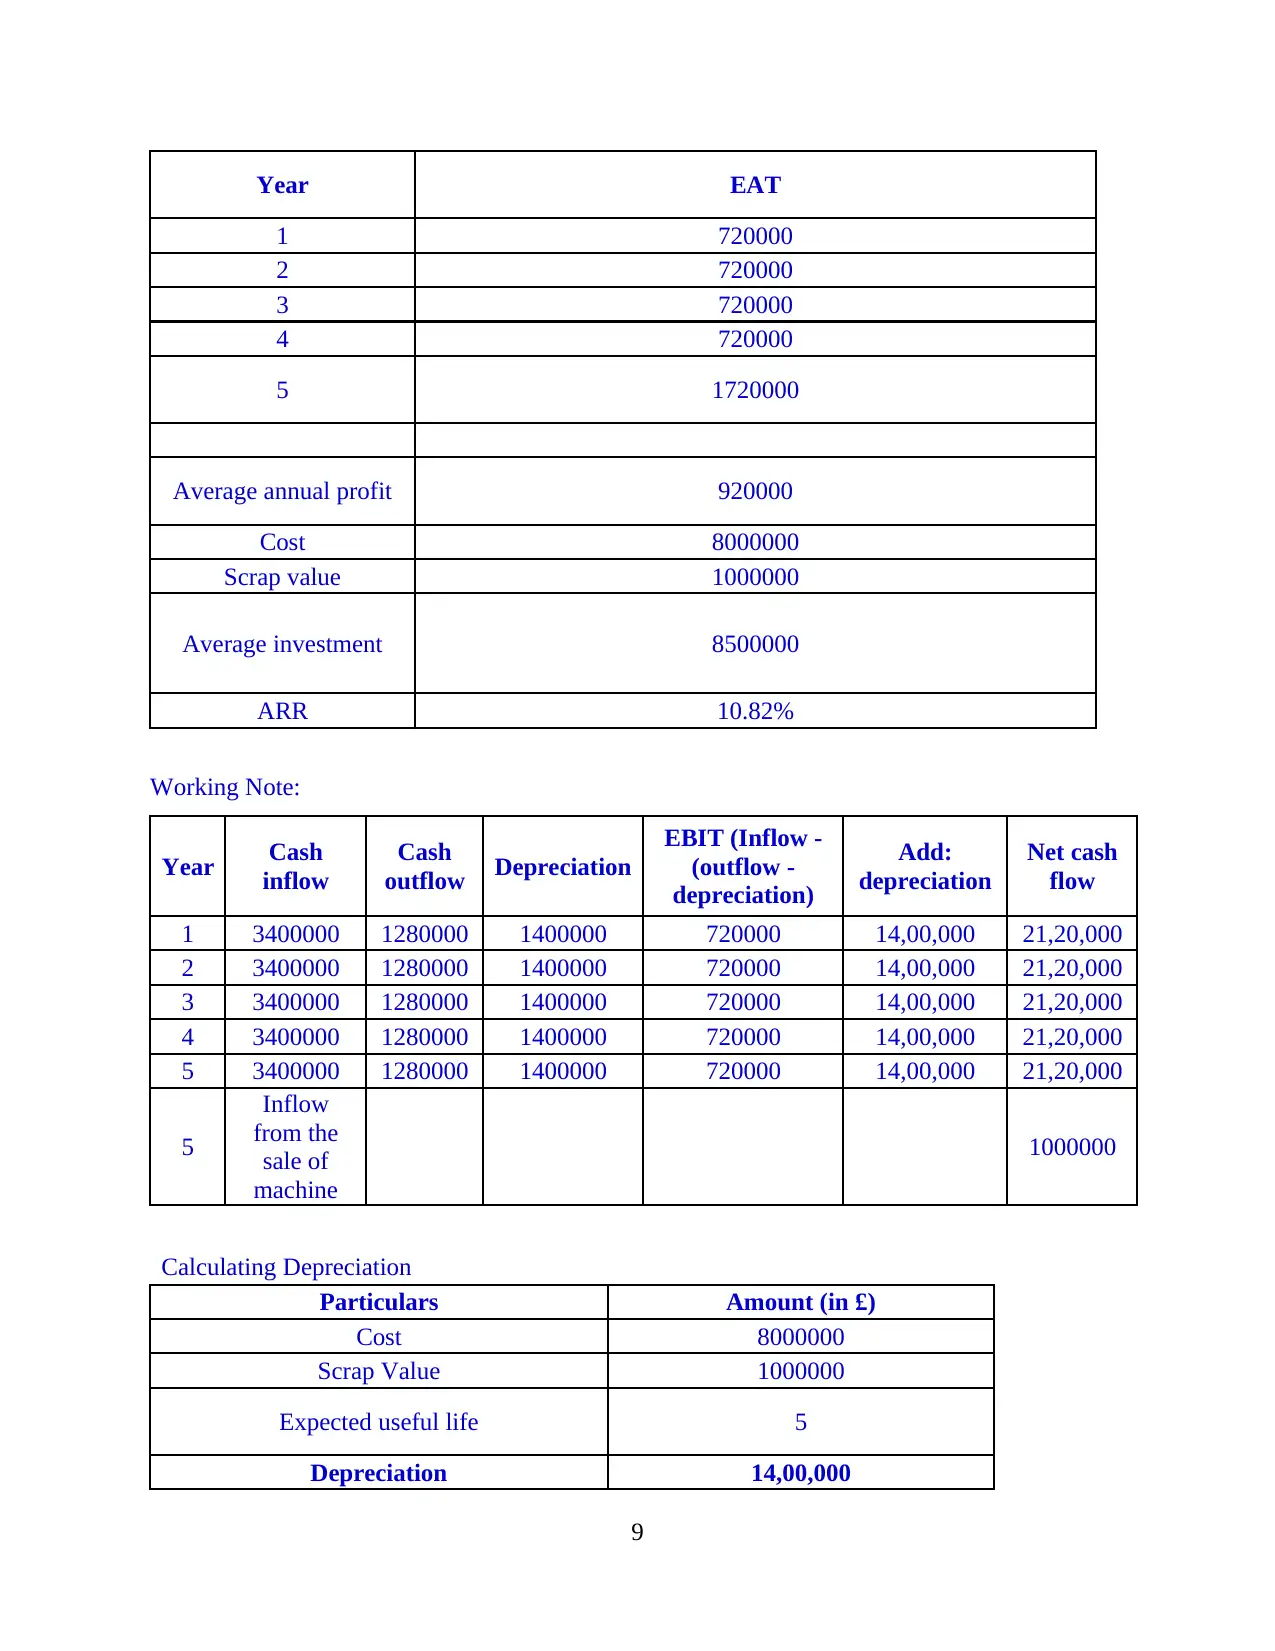
Accounting Rate of Return: ARR is the calculation of the return that is generated form
set profit regarding to investment in the capital activities. This is a financial ratio used in capital
budgeting to measure the amount of profit or return expected on an investment as compared with
the initial cost. In this ration time value of money is not considered and simply net income
generated on investment is calculated.
Accounting rate of return:
8
the accurate price in order to generate enough profit to overcome from the over all
expenses.
PART C
a) Pay back period, ARR and NPV
Pay Back Period: It is referred as the amount of time is taken to recover the cost of
investment. Through PBP analysis an investment is evaluated to assess the length of time
duration taken by any investment to reach at break even point. This method is used to assess an
investment when more opportunities are available and investment decision is made among them.
Investment which provides shorter duration of paybacks become more attractive.
Year Net cash flow Cash Flow
1 2120000 2120000
2 2120000 4240000
3 2120000 6360000
4 2120000 8480000
5 3120000 11600000
3
0.773584906
Payback period 3.773584906
This payback periods represents that when Smith Howe Limited will make investment of £
8000000 then, all the investment will be recovered in 3.77 years.
Accounting Rate of Return: ARR is the calculation of the return that is generated form
set profit regarding to investment in the capital activities. This is a financial ratio used in capital
budgeting to measure the amount of profit or return expected on an investment as compared with
the initial cost. In this ration time value of money is not considered and simply net income
generated on investment is calculated.
Accounting rate of return:
8
Paraphrase This Document
Need a fresh take? Get an instant paraphrase of this document with our AI Paraphraser
Year EAT
1 720000
2 720000
3 720000
4 720000
5 1720000
Average annual profit 920000
Cost 8000000
Scrap value 1000000
Average investment 8500000
ARR 10.82%
Working Note:
Year Cash
inflow
Cash
outflow Depreciation
EBIT (Inflow -
(outflow -
depreciation)
Add:
depreciation
Net cash
flow
1 3400000 1280000 1400000 720000 14,00,000 21,20,000
2 3400000 1280000 1400000 720000 14,00,000 21,20,000
3 3400000 1280000 1400000 720000 14,00,000 21,20,000
4 3400000 1280000 1400000 720000 14,00,000 21,20,000
5 3400000 1280000 1400000 720000 14,00,000 21,20,000
5
Inflow
from the
sale of
machine
1000000
Calculating Depreciation
Particulars Amount (in £)
Cost 8000000
Scrap Value 1000000
Expected useful life 5
Depreciation 14,00,000
9
Smith Howe Limited through ARR determines that by investing in new machinery
business will be able to generate new income of 26.5 % on an average over the life of
investment.
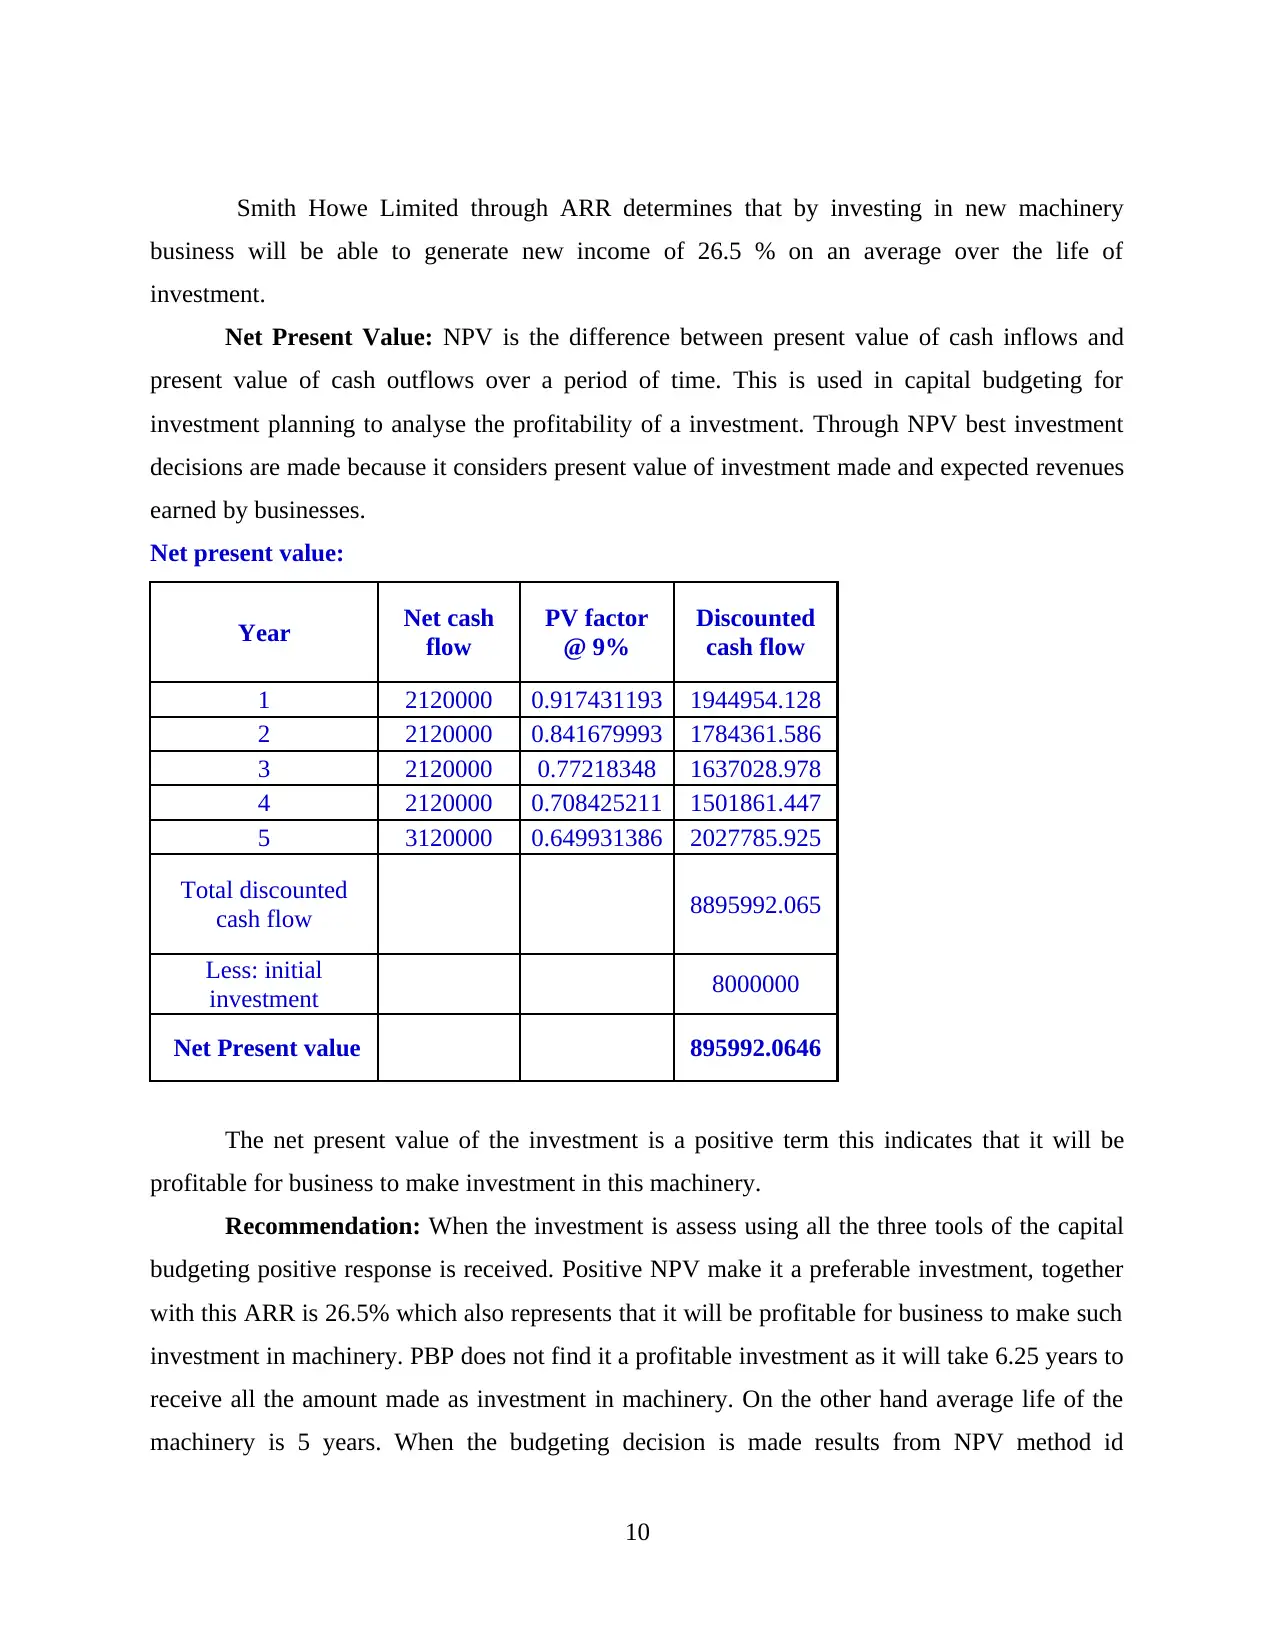
Net Present Value: NPV is the difference between present value of cash inflows and
present value of cash outflows over a period of time. This is used in capital budgeting for
investment planning to analyse the profitability of a investment. Through NPV best investment
decisions are made because it considers present value of investment made and expected revenues
earned by businesses.
Net present value:
Year Net cash
flow
PV factor
@ 9%
Discounted
cash flow
1 2120000 0.917431193 1944954.128
2 2120000 0.841679993 1784361.586
3 2120000 0.77218348 1637028.978
4 2120000 0.708425211 1501861.447
5 3120000 0.649931386 2027785.925
Total discounted
cash flow 8895992.065
Less: initial
investment 8000000
Net Present value 895992.0646
The net present value of the investment is a positive term this indicates that it will be
profitable for business to make investment in this machinery.
Recommendation: When the investment is assess using all the three tools of the capital
budgeting positive response is received. Positive NPV make it a preferable investment, together
with this ARR is 26.5% which also represents that it will be profitable for business to make such
investment in machinery. PBP does not find it a profitable investment as it will take 6.25 years to
receive all the amount made as investment in machinery. On the other hand average life of the
machinery is 5 years. When the budgeting decision is made results from NPV method id
10
business will be able to generate new income of 26.5 % on an average over the life of
investment.
Net Present Value: NPV is the difference between present value of cash inflows and
present value of cash outflows over a period of time. This is used in capital budgeting for
investment planning to analyse the profitability of a investment. Through NPV best investment
decisions are made because it considers present value of investment made and expected revenues
earned by businesses.
Net present value:
Year Net cash
flow
PV factor
@ 9%
Discounted
cash flow
1 2120000 0.917431193 1944954.128
2 2120000 0.841679993 1784361.586
3 2120000 0.77218348 1637028.978
4 2120000 0.708425211 1501861.447
5 3120000 0.649931386 2027785.925
Total discounted
cash flow 8895992.065
Less: initial
investment 8000000
Net Present value 895992.0646
The net present value of the investment is a positive term this indicates that it will be
profitable for business to make investment in this machinery.
Recommendation: When the investment is assess using all the three tools of the capital
budgeting positive response is received. Positive NPV make it a preferable investment, together
with this ARR is 26.5% which also represents that it will be profitable for business to make such
investment in machinery. PBP does not find it a profitable investment as it will take 6.25 years to
receive all the amount made as investment in machinery. On the other hand average life of the
machinery is 5 years. When the budgeting decision is made results from NPV method id
10
⊘ This is a preview!⊘
Do you want full access?
Subscribe today to unlock all pages.
Trusted by 1+ million students worldwide
1 out of 16
Related Documents


Your All-in-One AI-Powered Toolkit for Academic Success.
+13062052269
info@desklib.com
Available 24*7 on WhatsApp / Email
![[object Object]](/_next/static/media/star-bottom.7253800d.svg)
Unlock your academic potential
Copyright © 2020–2026 A2Z Services. All Rights Reserved. Developed and managed by ZUCOL.