Accounting and Finance for Managers: Performance and Investment Report
VerifiedAdded on 2019/12/04
|20
|4429
|130
Report
AI Summary
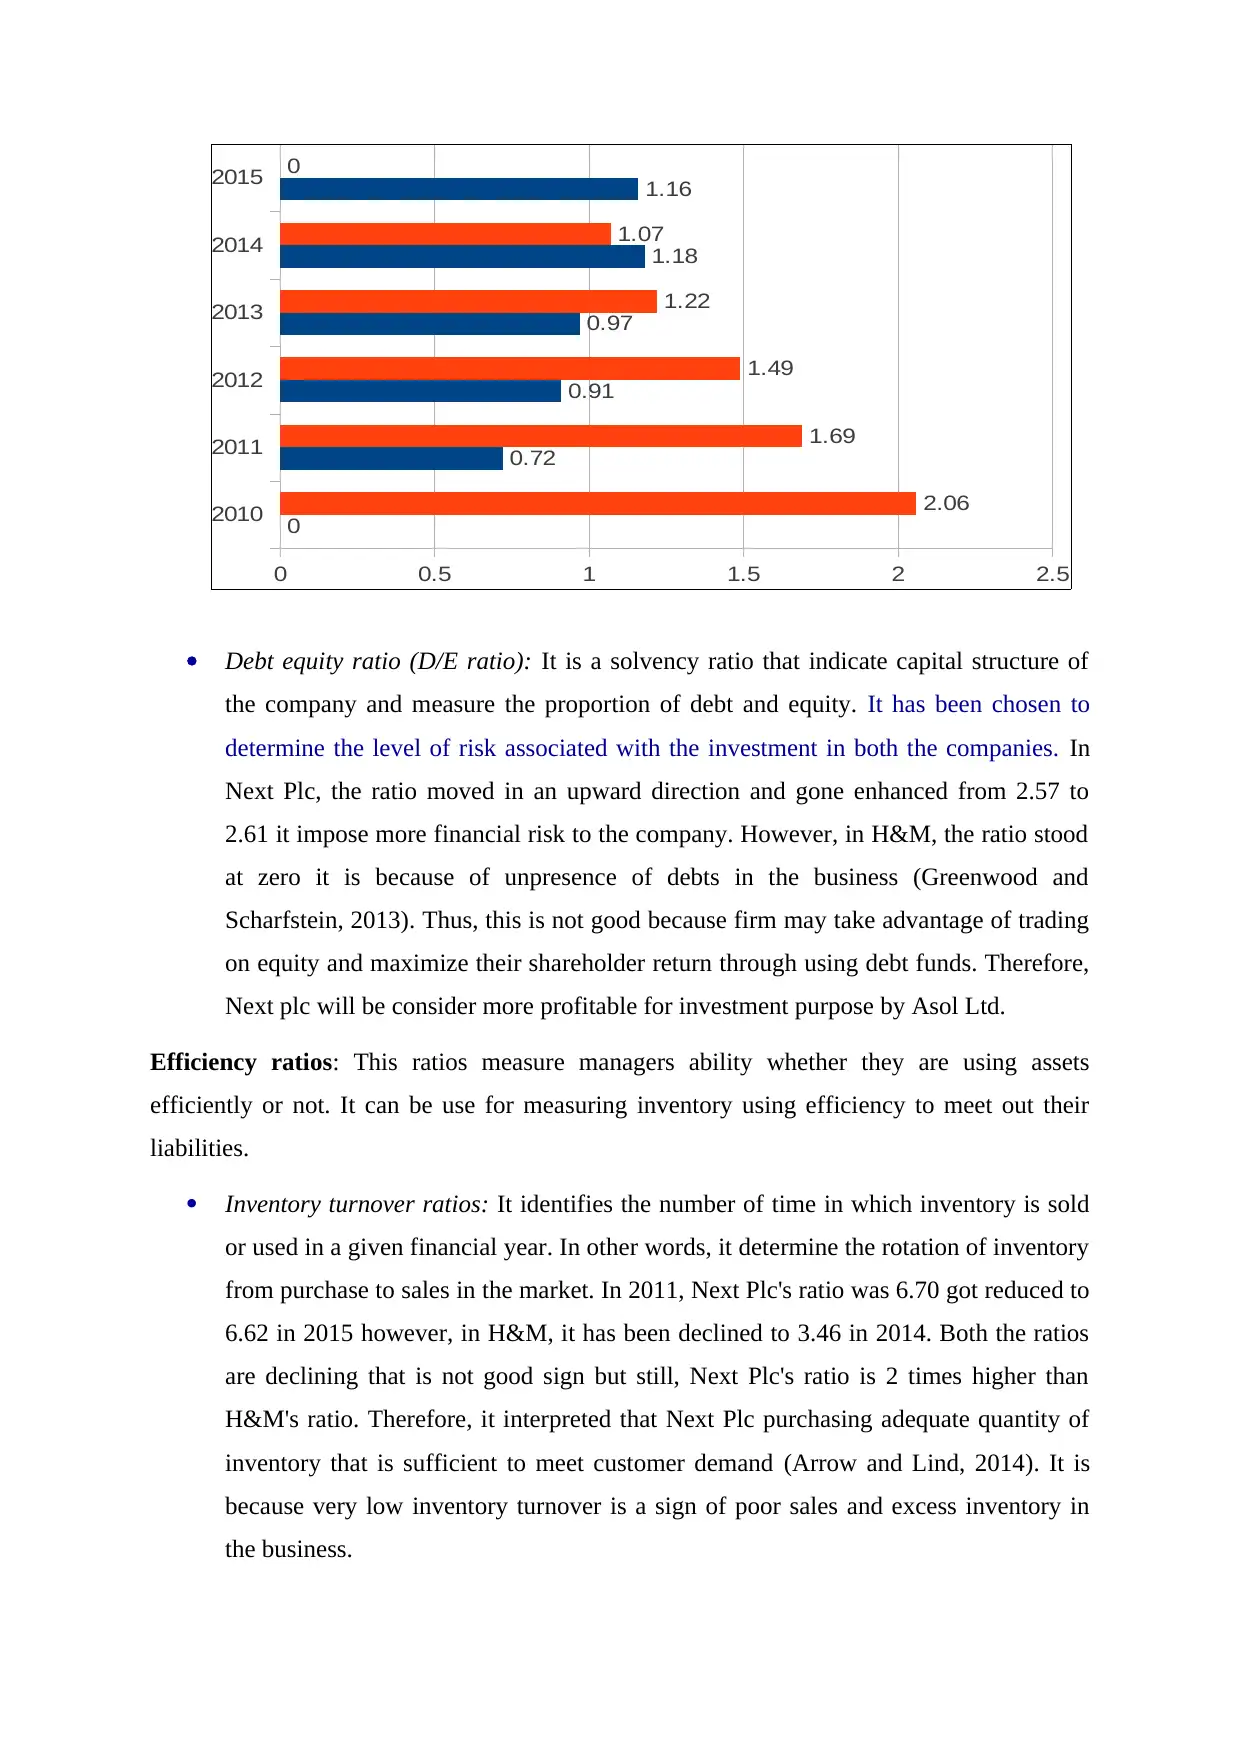
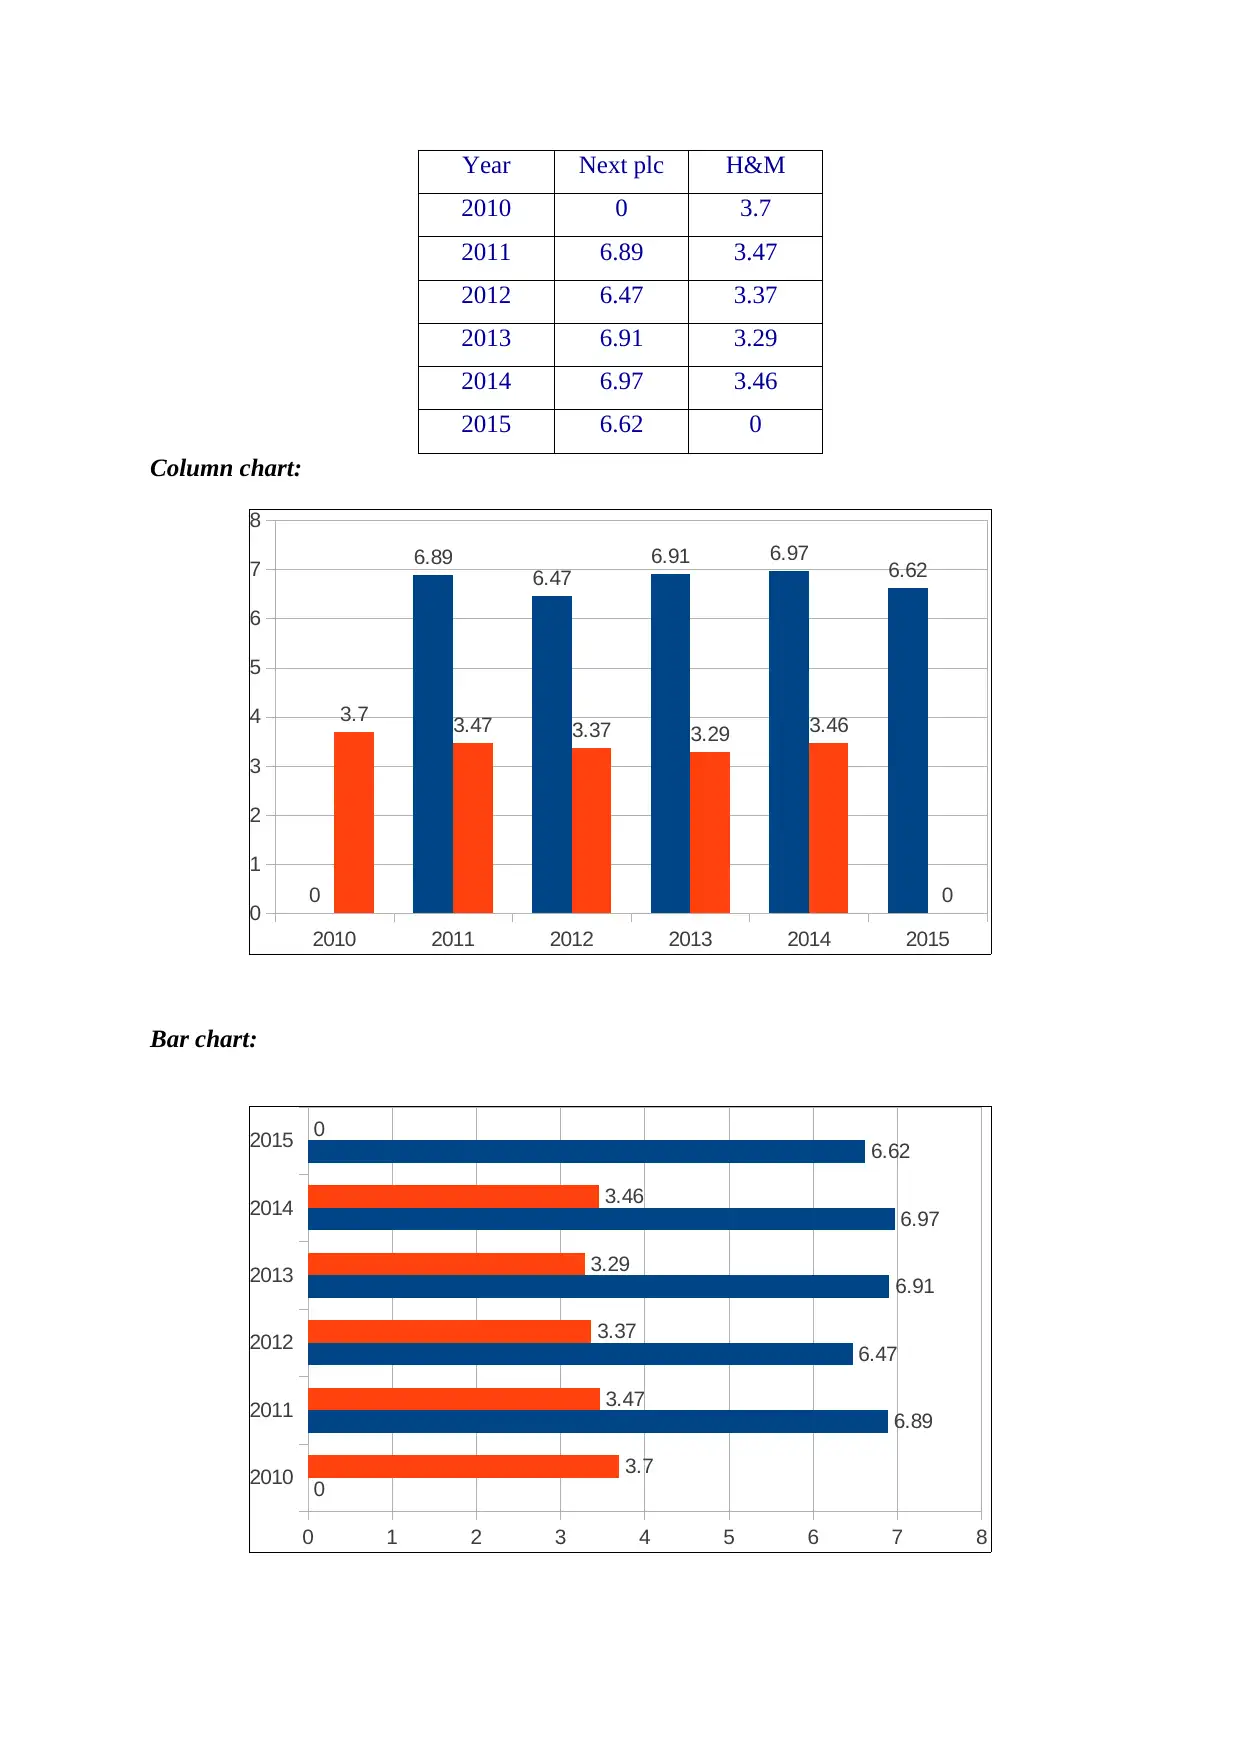
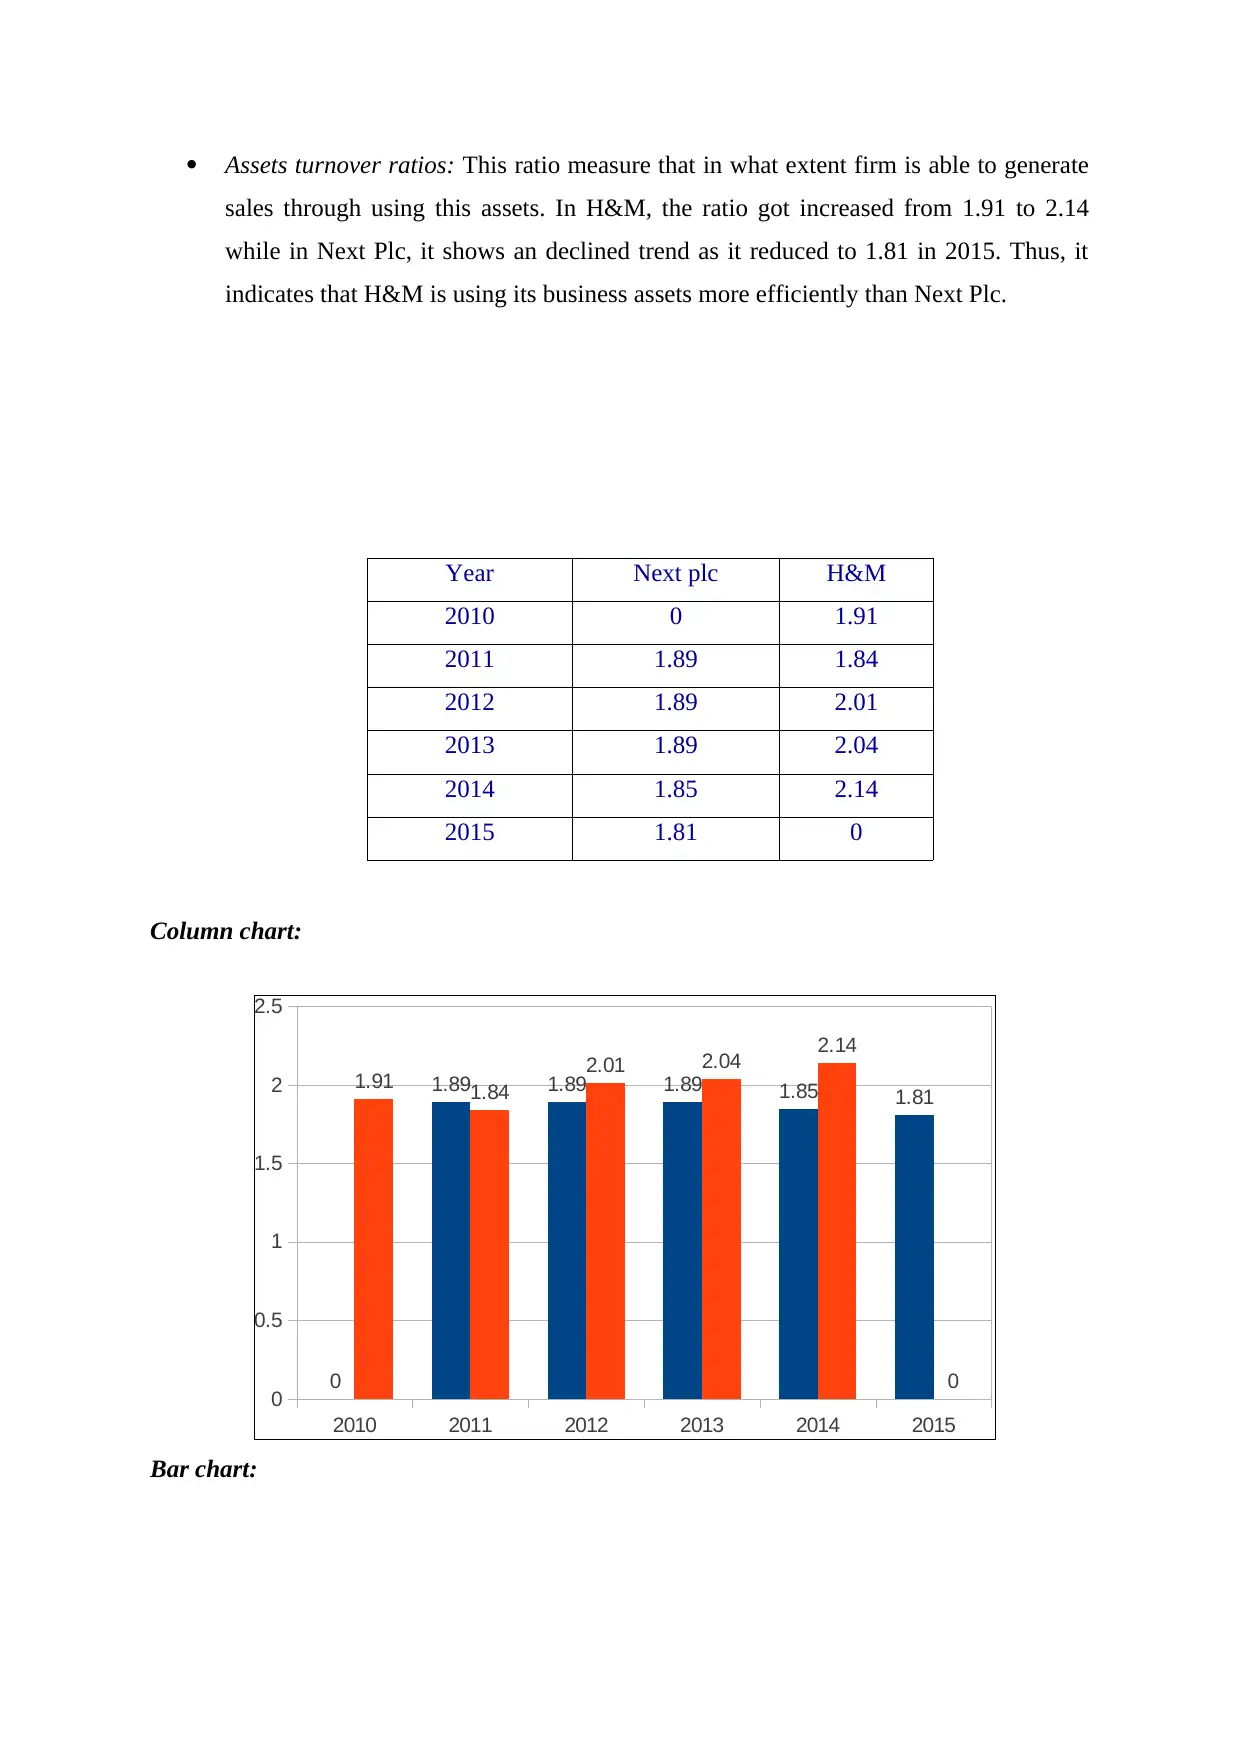
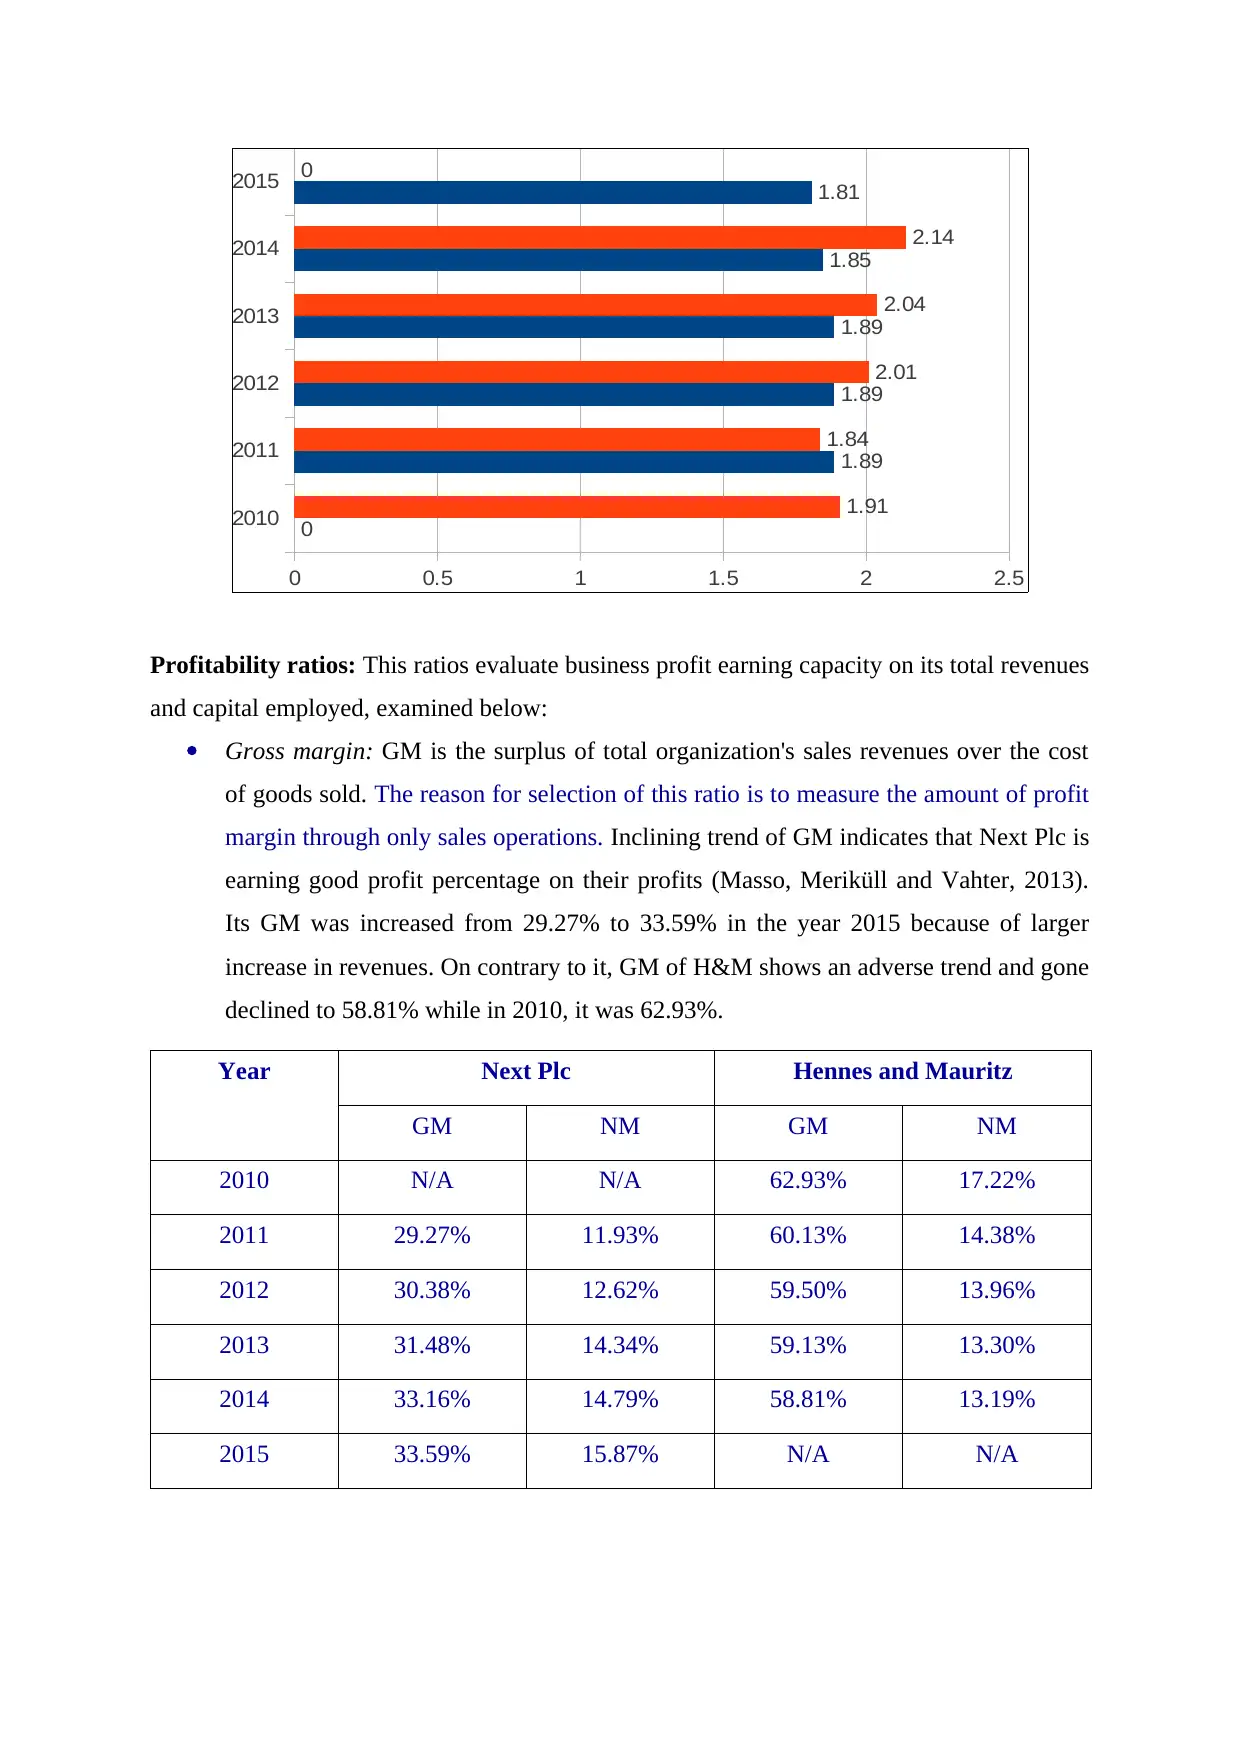
This report undertakes a comprehensive analysis of accounting and finance principles, focusing on comparative performance analysis and investment appraisal techniques. The first section delves into the financial performance of Next Plc and Hennes & Mauritz (H&M), utilizing various financial ratios such as current ratio, quick ratio, debt-equity ratio, inventory turnover, asset turnover, gross margin, net margin, return on equity, and operating cash flow per share to evaluate their financial health and efficiency. Non-financial aspects, including EBITDA per employee, revenue per employee, staff turnover, and absenteeism, are also examined to provide a holistic view. The second part of the report focuses on investment appraisal, specifically for Hilltop Ltd, employing techniques like net cash flow, payback period, net present value (NPV), and accounting rate of return (ARR) to assess the viability of potential projects. The report concludes with recommendations for both companies, addressing areas for improvement, and acknowledges the limitations of the methods employed.

1 out of 20
Related Documents


Your All-in-One AI-Powered Toolkit for Academic Success.
+13062052269
info@desklib.com
Available 24*7 on WhatsApp / Email
![[object Object]](/_next/static/media/star-bottom.7253800d.svg)
Copyright © 2020–2026 A2Z Services. All Rights Reserved. Developed and managed by ZUCOL.