Accounting and Finance Report: Cornpeace Ltd and Dane Jones Ltd
VerifiedAdded on 2020/10/05
|15
|4109
|202
Report
AI Summary
This report provides a comprehensive analysis of accounting and finance principles through the examination of three case studies: Gravepals Plc, Cornpeace Ltd, and Dane Jones Ltd. The analysis begins with the preparation of financial statements, including the income statement and balance sheet for Gravepals Plc. It then proceeds to calculate key metrics for Cornpeace Ltd, such as contribution per unit, break-even point, and profit, along with an analysis of strategic decisions. The report also discusses the assumptions of the break-even model and its applicability across different businesses. Finally, for Dane Jones Ltd, the report calculates the payback period, accounting rate of return, and net present value, alongside a discussion of the merits and limitations of various investment appraisal techniques and the advantages and disadvantages of using budgets as a tool for strategic planning. The report concludes with a summary of the key findings and insights gained from the analysis of each case study, providing a well-rounded understanding of financial analysis and management.

ACCOUNTING AND
FINANCE
FINANCE
Paraphrase This Document
Need a fresh take? Get an instant paraphrase of this document with our AI Paraphraser
Table of Contents
INTRODUCTION...........................................................................................................................1
PART A – Gravepals Plc.................................................................................................................1
PART B – Cornpeace Ltd................................................................................................................2
a. Calculation of contribution per unit........................................................................................2
b. Calculation of break-even point and margin of safety ...........................................................3
c. Calculation of profit at 48000 tables at £13 per shelf.............................................................4
d. Analysis of strategy.................................................................................................................4
e. Assumptions of Break-even model and its utilization by different businesses.......................5
PART C – Dane Jones Ltd ..............................................................................................................6
a. Calculation of Payback period, accounting rate of return and net present value....................6
b. Merits and limitations of various investment appraisal techniques........................................8
c. Advantages and disadvantages of using budgets as tool for strategic planning....................10
CONCLUSION .............................................................................................................................11
REFERENCES .............................................................................................................................11
INTRODUCTION
Accounting refers to method of recording financial transactions associated with an
organization. Process of accounting involves steps of recording, classifying, summarizing and
interpreting financial data for communicating to interested users. Finance is defined as field or
area dealing with matters related to money management, allocation of assets as well as liabilities,
investments (Anandarajan, Anandarajan, and Srinivasan, 2012). In this report, income statement
and statement of financial position are prepared for Gravepals Plc. Then, break-even point,
profit, contribution are calculated for Cornpeace Ltd, also assumptions related to break-even
analysis are also discussed. Later, for Dane Jones Ltd, payback period, accounting rate of return
and net present value have been ascertained. Lastly, advantages as well as disadvantages of
various investment appraisal techniques and of budgets are given.
PART A – Gravepals Plc
Financial statements of Gravepals Plc are given below:
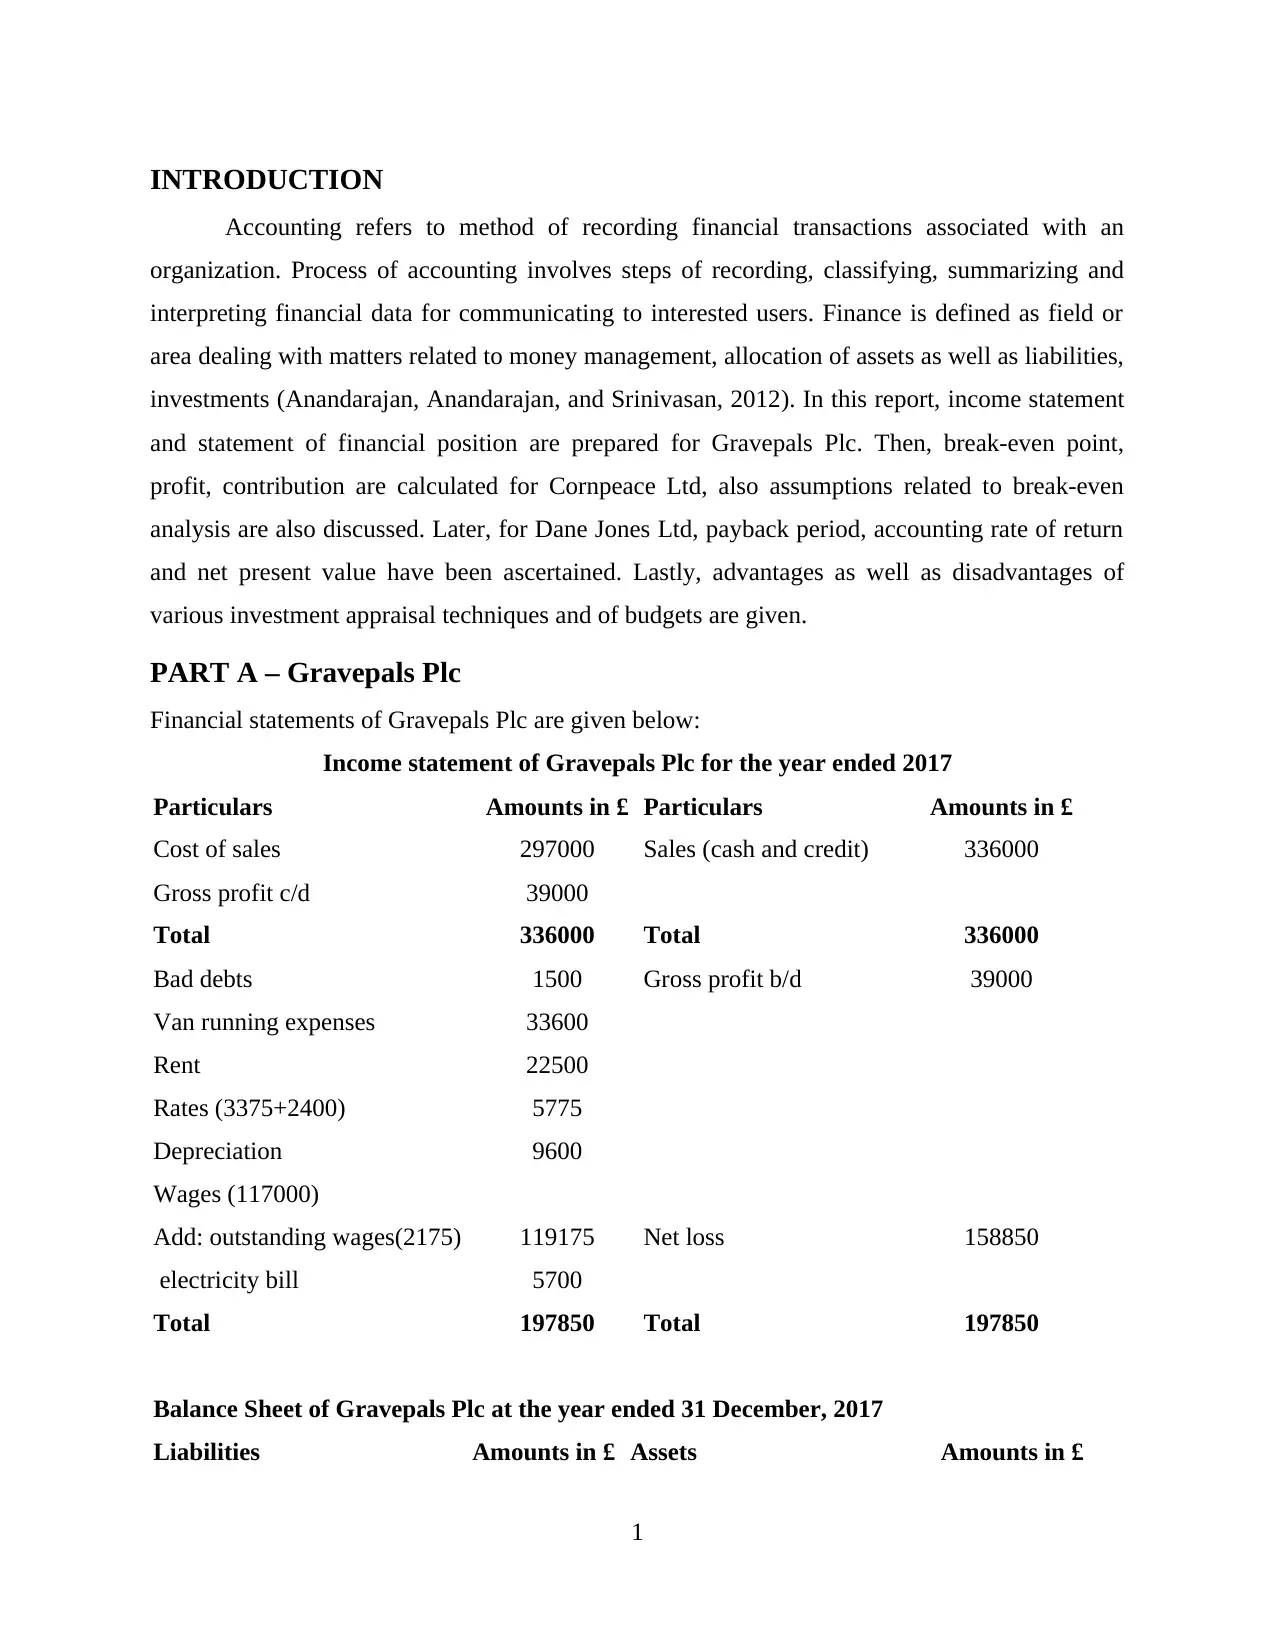
Income statement of Gravepals Plc for the year ended 2017
Particulars Amounts in £ Particulars Amounts in £
Cost of sales 297000 Sales (cash and credit) 336000
Gross profit c/d 39000
Total 336000 Total 336000
Bad debts 1500 Gross profit b/d 39000
Van running expenses 33600
Rent 22500
Rates (3375+2400) 5775
Depreciation 9600
Wages (117000)
Add: outstanding wages(2175) 119175 Net loss 158850
electricity bill 5700
Total 197850 Total 197850
Balance Sheet of Gravepals Plc at the year ended 31 December, 2017
Liabilities Amounts in £ Assets Amounts in £
1
Accounting refers to method of recording financial transactions associated with an
organization. Process of accounting involves steps of recording, classifying, summarizing and
interpreting financial data for communicating to interested users. Finance is defined as field or
area dealing with matters related to money management, allocation of assets as well as liabilities,
investments (Anandarajan, Anandarajan, and Srinivasan, 2012). In this report, income statement
and statement of financial position are prepared for Gravepals Plc. Then, break-even point,
profit, contribution are calculated for Cornpeace Ltd, also assumptions related to break-even
analysis are also discussed. Later, for Dane Jones Ltd, payback period, accounting rate of return
and net present value have been ascertained. Lastly, advantages as well as disadvantages of
various investment appraisal techniques and of budgets are given.
PART A – Gravepals Plc
Financial statements of Gravepals Plc are given below:
Income statement of Gravepals Plc for the year ended 2017
Particulars Amounts in £ Particulars Amounts in £
Cost of sales 297000 Sales (cash and credit) 336000
Gross profit c/d 39000
Total 336000 Total 336000
Bad debts 1500 Gross profit b/d 39000
Van running expenses 33600
Rent 22500
Rates (3375+2400) 5775
Depreciation 9600
Wages (117000)
Add: outstanding wages(2175) 119175 Net loss 158850
electricity bill 5700
Total 197850 Total 197850
Balance Sheet of Gravepals Plc at the year ended 31 December, 2017
Liabilities Amounts in £ Assets Amounts in £
1
⊘ This is a preview!⊘
Do you want full access?
Subscribe today to unlock all pages.
Trusted by 1+ million students worldwide
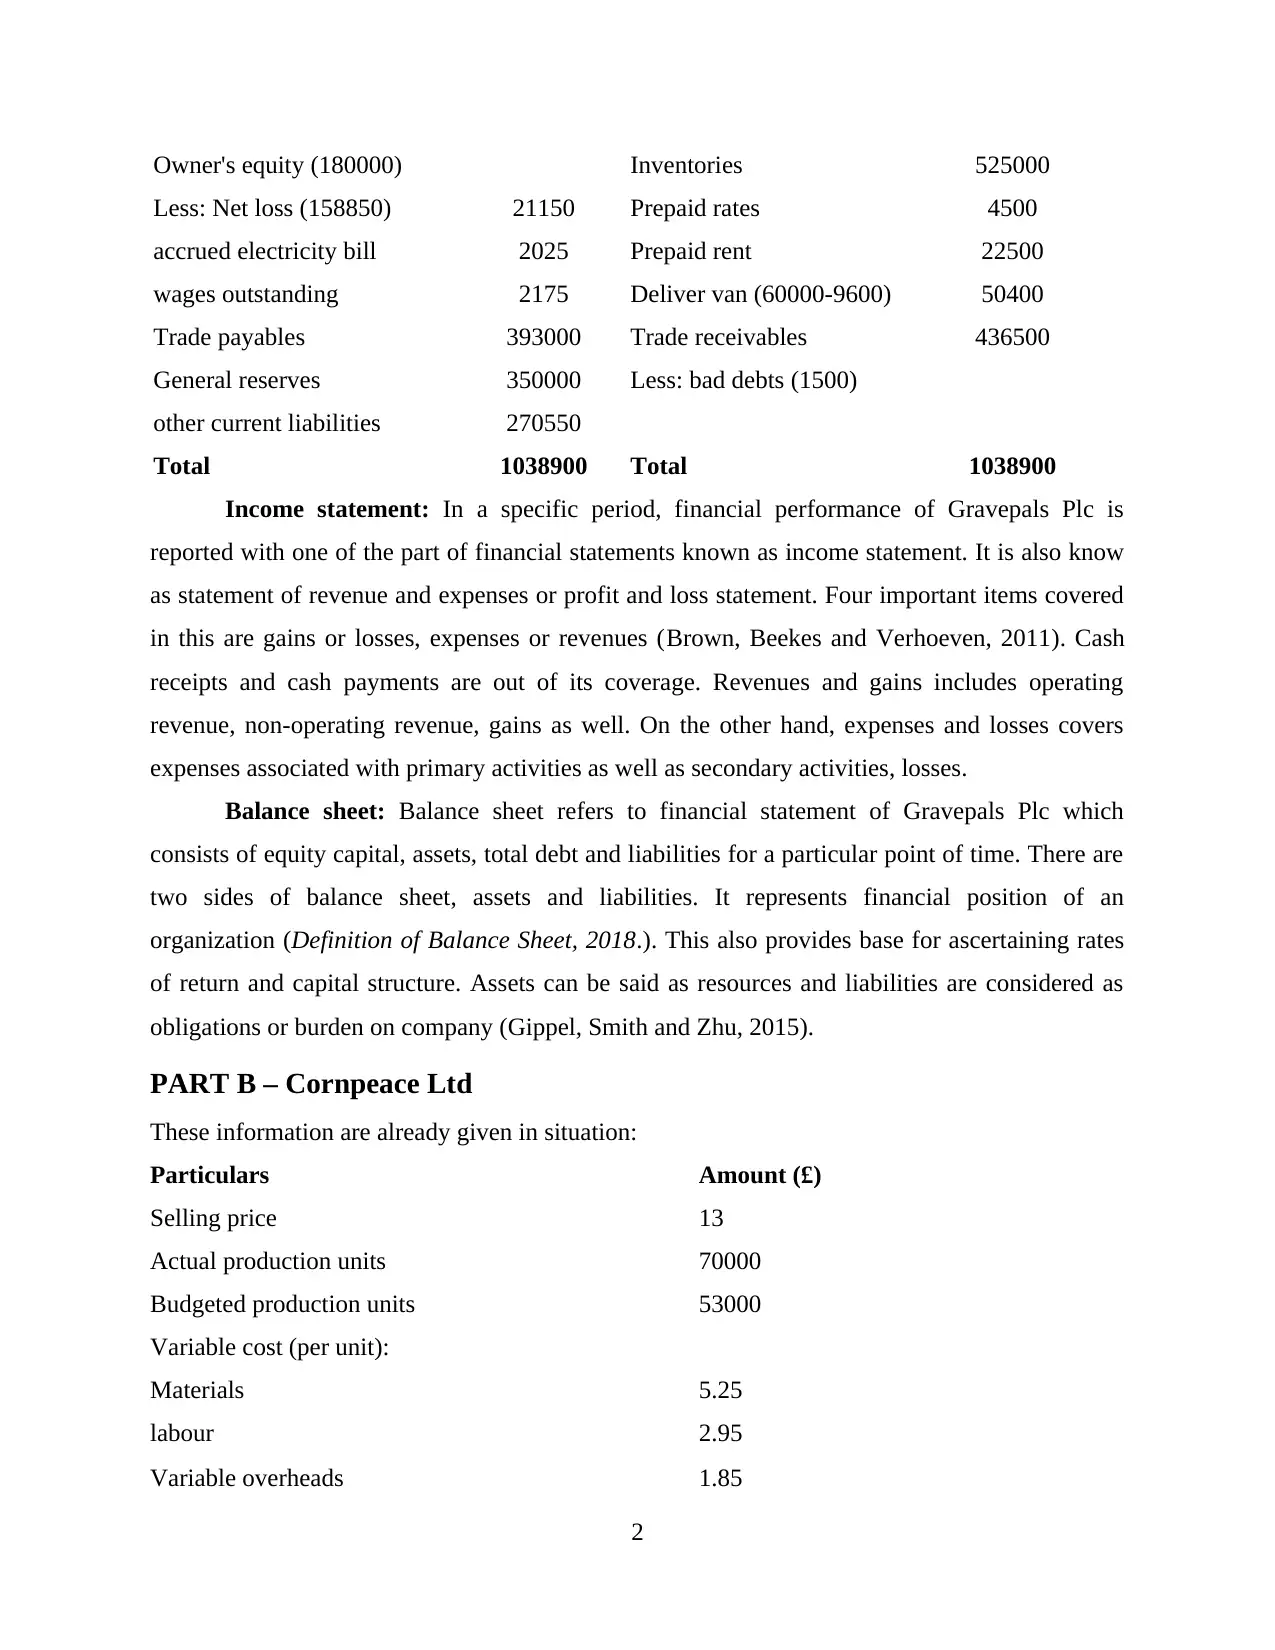
Owner's equity (180000) Inventories 525000
Less: Net loss (158850) 21150 Prepaid rates 4500
accrued electricity bill 2025 Prepaid rent 22500
wages outstanding 2175 Deliver van (60000-9600) 50400
Trade payables 393000 Trade receivables 436500
General reserves 350000 Less: bad debts (1500)
other current liabilities 270550
Total 1038900 Total 1038900
Income statement: In a specific period, financial performance of Gravepals Plc is
reported with one of the part of financial statements known as income statement. It is also know
as statement of revenue and expenses or profit and loss statement. Four important items covered
in this are gains or losses, expenses or revenues (Brown, Beekes and Verhoeven, 2011). Cash
receipts and cash payments are out of its coverage. Revenues and gains includes operating
revenue, non-operating revenue, gains as well. On the other hand, expenses and losses covers
expenses associated with primary activities as well as secondary activities, losses.
Balance sheet: Balance sheet refers to financial statement of Gravepals Plc which
consists of equity capital, assets, total debt and liabilities for a particular point of time. There are
two sides of balance sheet, assets and liabilities. It represents financial position of an
organization (Definition of Balance Sheet, 2018.). This also provides base for ascertaining rates
of return and capital structure. Assets can be said as resources and liabilities are considered as
obligations or burden on company (Gippel, Smith and Zhu, 2015).
PART B – Cornpeace Ltd
These information are already given in situation:
Particulars Amount (£)
Selling price 13
Actual production units 70000
Budgeted production units 53000
Variable cost (per unit):
Materials 5.25
labour 2.95
Variable overheads 1.85
2
Paraphrase This Document
Need a fresh take? Get an instant paraphrase of this document with our AI Paraphraser
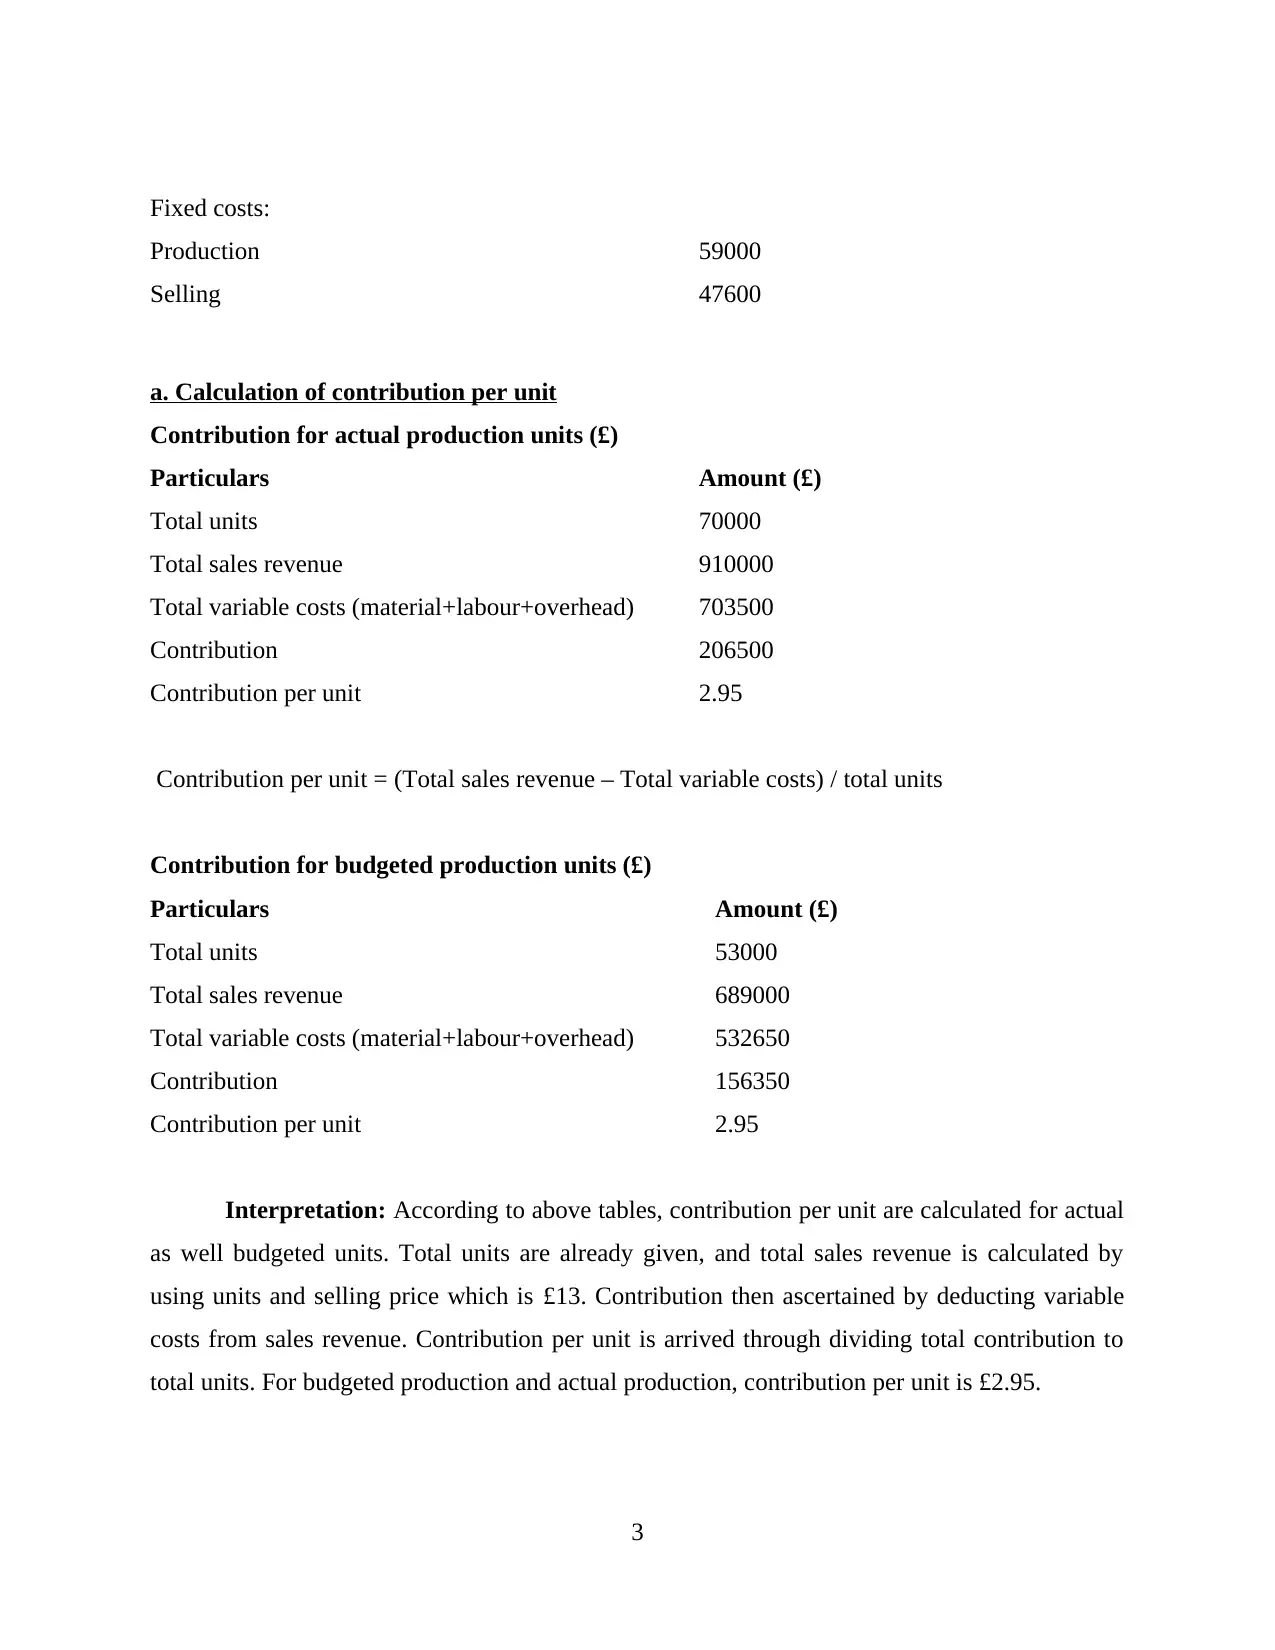
Fixed costs:
Production 59000
Selling 47600
a. Calculation of contribution per unit
Contribution for actual production units (£)
Particulars Amount (£)
Total units 70000
Total sales revenue 910000
Total variable costs (material+labour+overhead) 703500
Contribution 206500
Contribution per unit 2.95
Contribution per unit = (Total sales revenue – Total variable costs) / total units
Contribution for budgeted production units (£)
Particulars Amount (£)
Total units 53000
Total sales revenue 689000
Total variable costs (material+labour+overhead) 532650
Contribution 156350
Contribution per unit 2.95
Interpretation: According to above tables, contribution per unit are calculated for actual
as well budgeted units. Total units are already given, and total sales revenue is calculated by
using units and selling price which is £13. Contribution then ascertained by deducting variable
costs from sales revenue. Contribution per unit is arrived through dividing total contribution to
total units. For budgeted production and actual production, contribution per unit is £2.95.
3
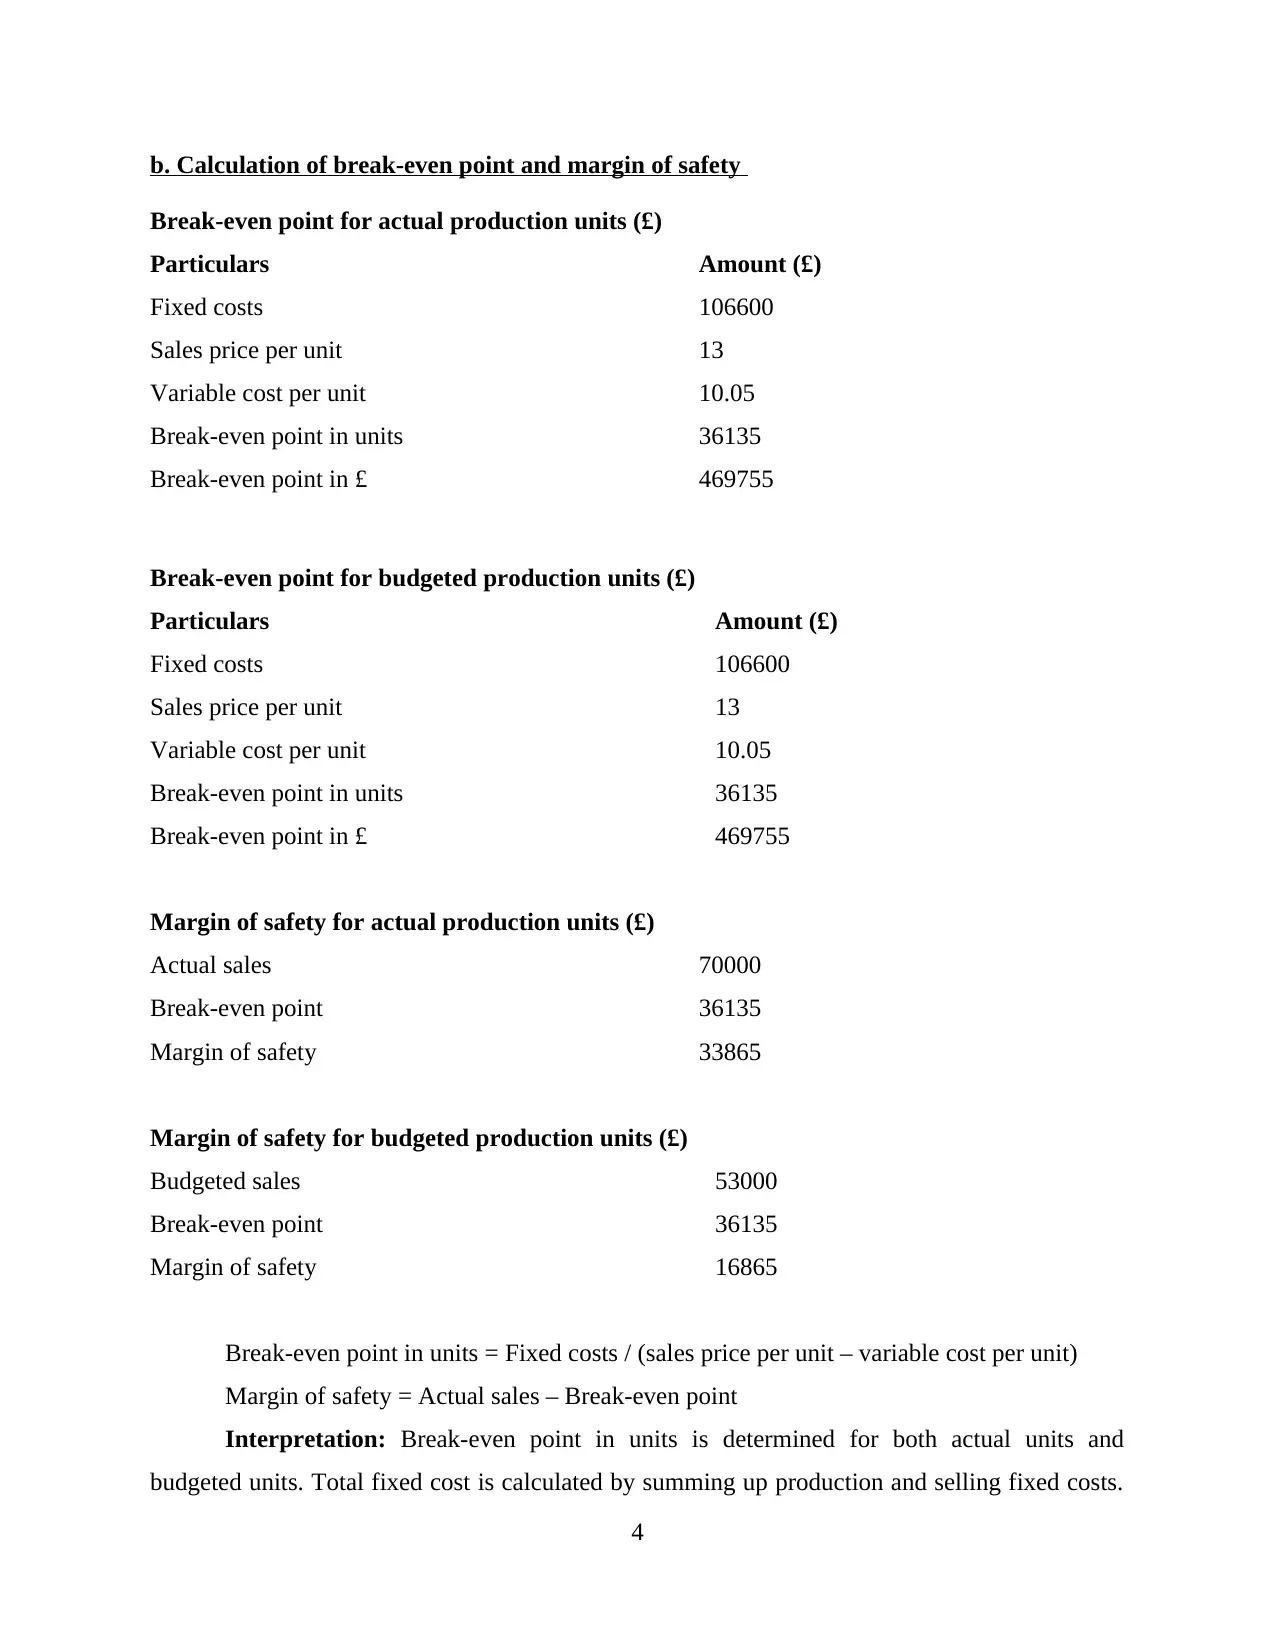
b. Calculation of break-even point and margin of safety
Break-even point for actual production units (£)
Particulars Amount (£)
Fixed costs 106600
Sales price per unit 13
Variable cost per unit 10.05
Break-even point in units 36135
Break-even point in £ 469755
Break-even point for budgeted production units (£)
Particulars Amount (£)
Fixed costs 106600
Sales price per unit 13
Variable cost per unit 10.05
Break-even point in units 36135
Break-even point in £ 469755
Margin of safety for actual production units (£)
Actual sales 70000
Break-even point 36135
Margin of safety 33865
Margin of safety for budgeted production units (£)
Budgeted sales 53000
Break-even point 36135
Margin of safety 16865
Break-even point in units = Fixed costs / (sales price per unit – variable cost per unit)
Margin of safety = Actual sales – Break-even point
Interpretation: Break-even point in units is determined for both actual units and
budgeted units. Total fixed cost is calculated by summing up production and selling fixed costs.
4
⊘ This is a preview!⊘
Do you want full access?
Subscribe today to unlock all pages.
Trusted by 1+ million students worldwide
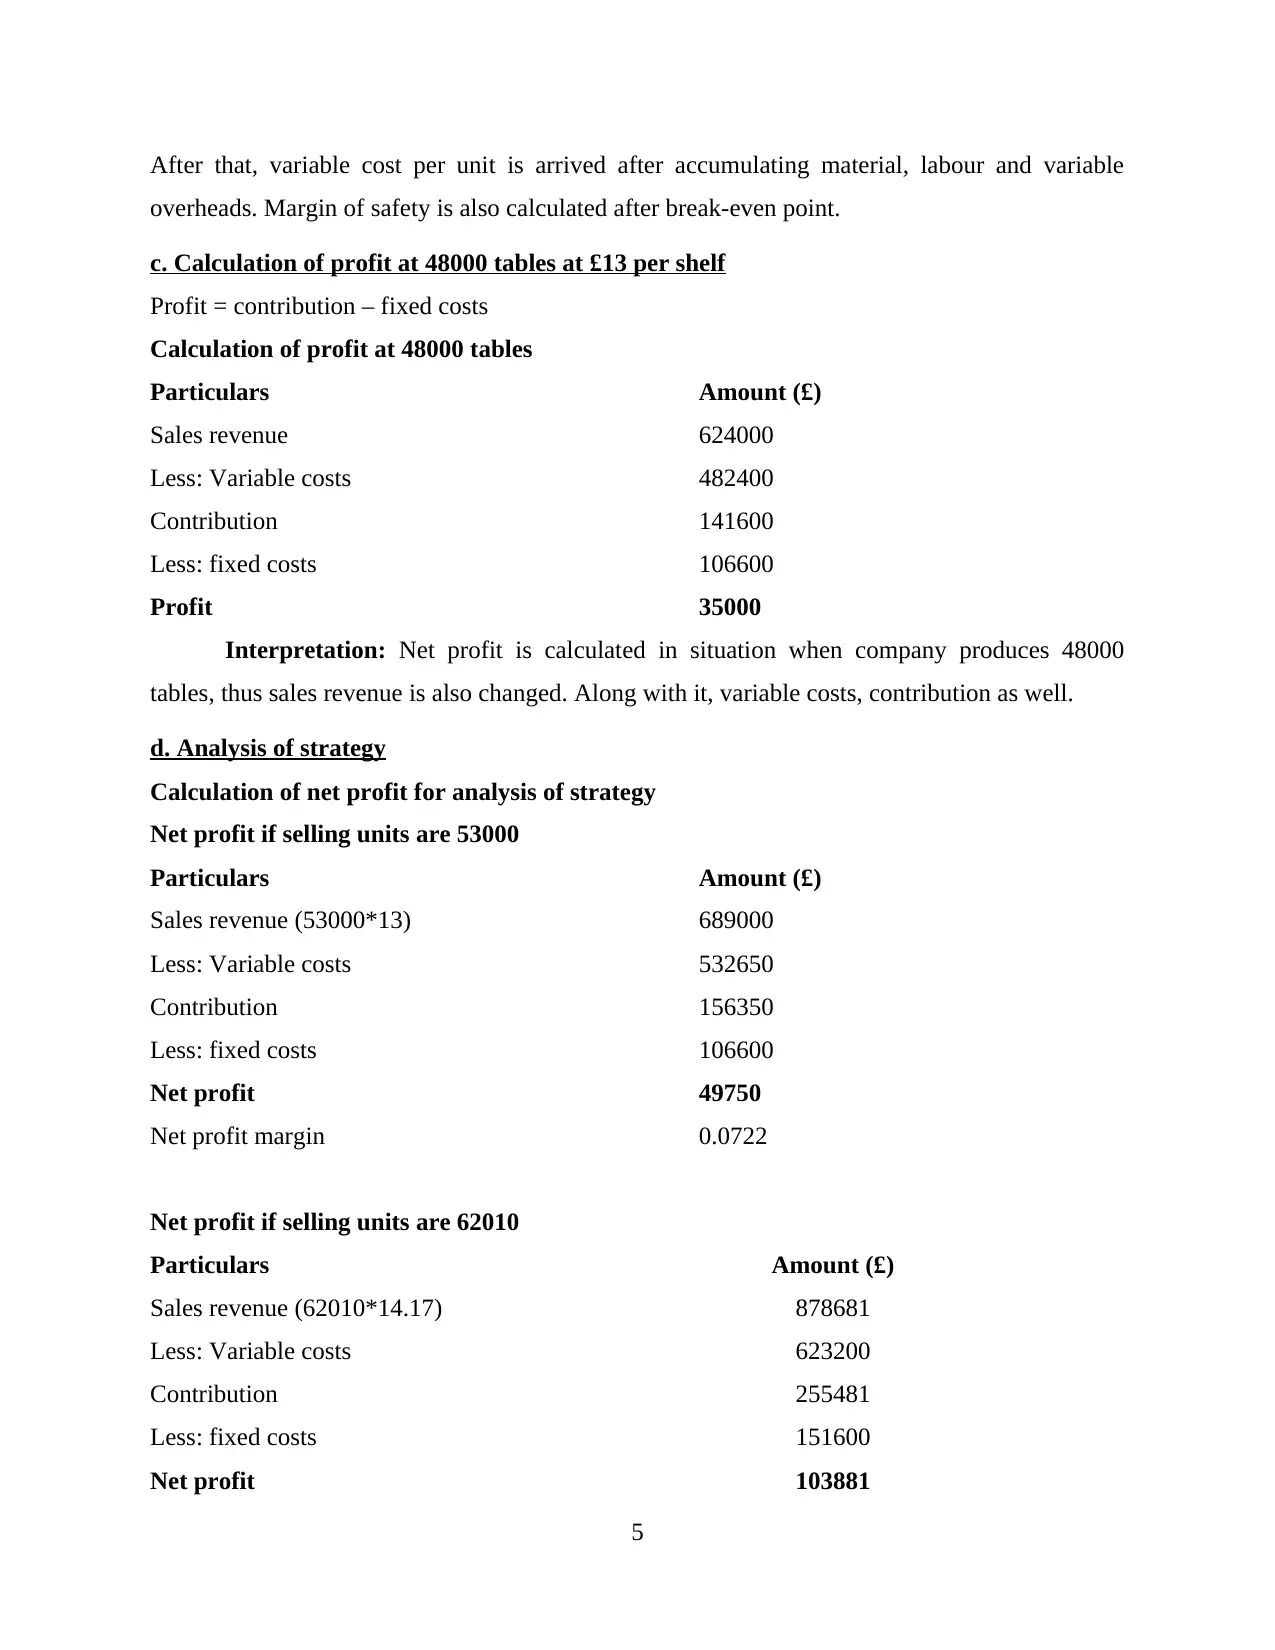
After that, variable cost per unit is arrived after accumulating material, labour and variable
overheads. Margin of safety is also calculated after break-even point.
c. Calculation of profit at 48000 tables at £13 per shelf
Profit = contribution – fixed costs
Calculation of profit at 48000 tables
Particulars Amount (£)
Sales revenue 624000
Less: Variable costs 482400
Contribution 141600
Less: fixed costs 106600
Profit 35000
Interpretation: Net profit is calculated in situation when company produces 48000
tables, thus sales revenue is also changed. Along with it, variable costs, contribution as well.
d. Analysis of strategy
Calculation of net profit for analysis of strategy
Net profit if selling units are 53000
Particulars Amount (£)
Sales revenue (53000*13) 689000
Less: Variable costs 532650
Contribution 156350
Less: fixed costs 106600
Net profit 49750
Net profit margin 0.0722
Net profit if selling units are 62010
Particulars Amount (£)
Sales revenue (62010*14.17) 878681
Less: Variable costs 623200
Contribution 255481
Less: fixed costs 151600
Net profit 103881
5
Paraphrase This Document
Need a fresh take? Get an instant paraphrase of this document with our AI Paraphraser
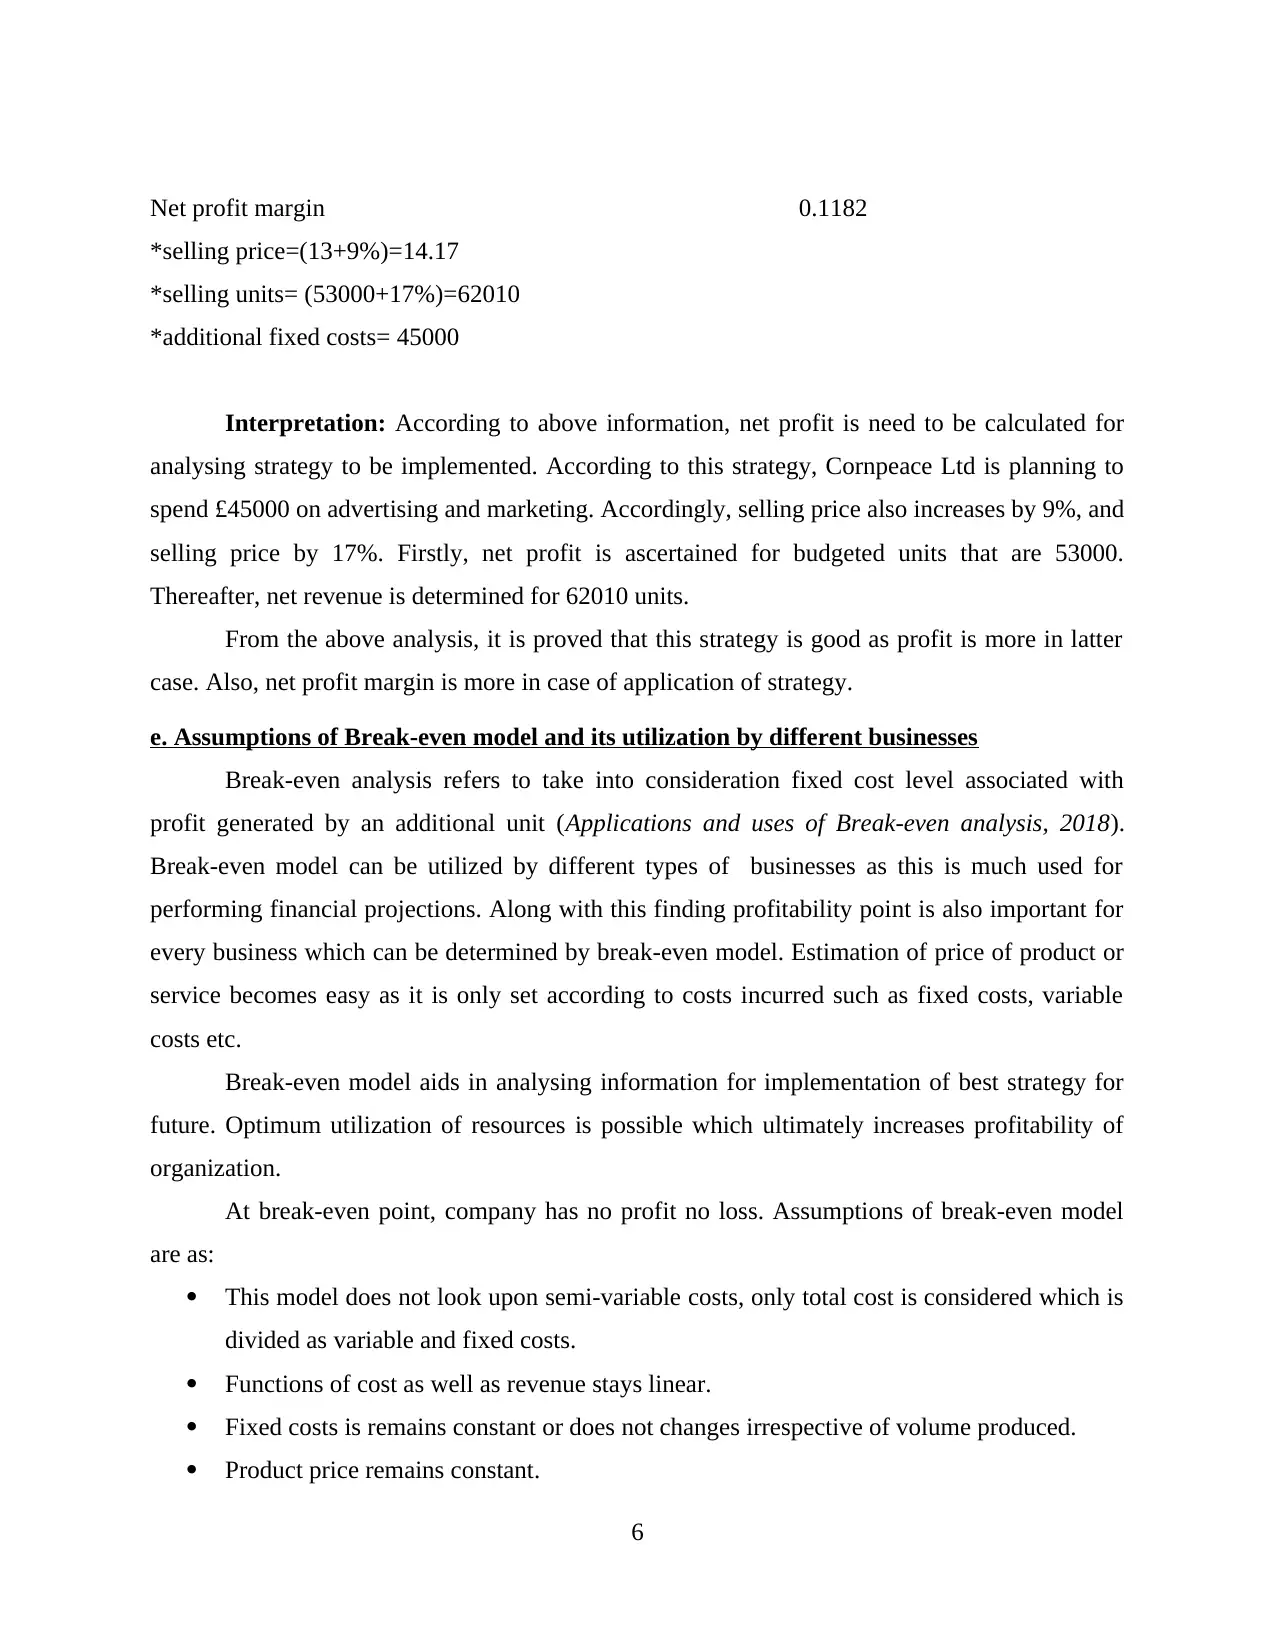
Net profit margin 0.1182
*selling price=(13+9%)=14.17
*selling units= (53000+17%)=62010
*additional fixed costs= 45000
Interpretation: According to above information, net profit is need to be calculated for
analysing strategy to be implemented. According to this strategy, Cornpeace Ltd is planning to
spend £45000 on advertising and marketing. Accordingly, selling price also increases by 9%, and
selling price by 17%. Firstly, net profit is ascertained for budgeted units that are 53000.
Thereafter, net revenue is determined for 62010 units.
From the above analysis, it is proved that this strategy is good as profit is more in latter
case. Also, net profit margin is more in case of application of strategy.
e. Assumptions of Break-even model and its utilization by different businesses
Break-even analysis refers to take into consideration fixed cost level associated with
profit generated by an additional unit (Applications and uses of Break-even analysis, 2018).
Break-even model can be utilized by different types of businesses as this is much used for
performing financial projections. Along with this finding profitability point is also important for
every business which can be determined by break-even model. Estimation of price of product or
service becomes easy as it is only set according to costs incurred such as fixed costs, variable
costs etc.
Break-even model aids in analysing information for implementation of best strategy for
future. Optimum utilization of resources is possible which ultimately increases profitability of
organization.
At break-even point, company has no profit no loss. Assumptions of break-even model
are as:
This model does not look upon semi-variable costs, only total cost is considered which is
divided as variable and fixed costs.
Functions of cost as well as revenue stays linear.
Fixed costs is remains constant or does not changes irrespective of volume produced.
Product price remains constant.
6
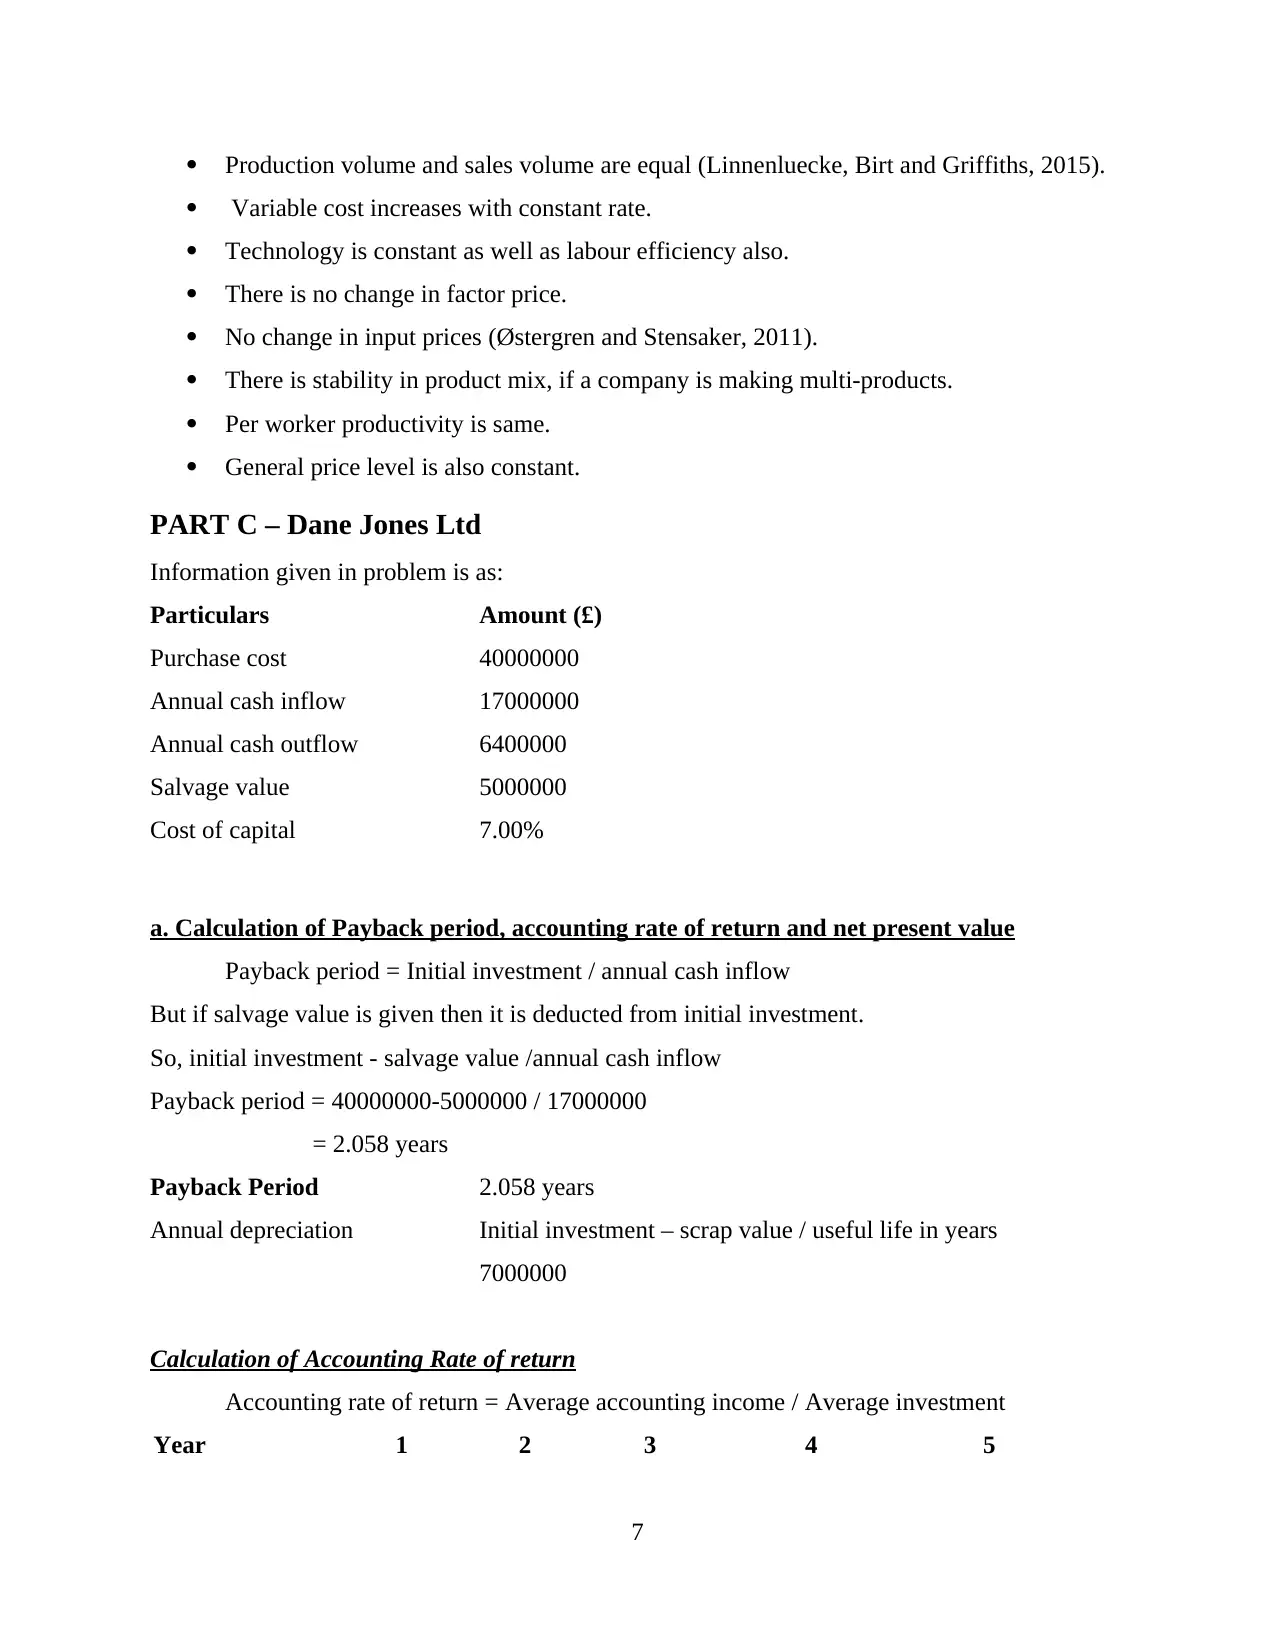
Production volume and sales volume are equal (Linnenluecke, Birt and Griffiths, 2015).
Variable cost increases with constant rate.
Technology is constant as well as labour efficiency also.
There is no change in factor price.
No change in input prices (Østergren and Stensaker, 2011).
There is stability in product mix, if a company is making multi-products.
Per worker productivity is same.
General price level is also constant.
PART C – Dane Jones Ltd
Information given in problem is as:
Particulars Amount (£)
Purchase cost 40000000
Annual cash inflow 17000000
Annual cash outflow 6400000
Salvage value 5000000
Cost of capital 7.00%
a. Calculation of Payback period, accounting rate of return and net present value
Payback period = Initial investment / annual cash inflow
But if salvage value is given then it is deducted from initial investment.
So, initial investment - salvage value /annual cash inflow
Payback period = 40000000-5000000 / 17000000
= 2.058 years
Payback Period 2.058 years
Annual depreciation Initial investment – scrap value / useful life in years
7000000
Calculation of Accounting Rate of return
Accounting rate of return = Average accounting income / Average investment
Year 1 2 3 4 5
7
⊘ This is a preview!⊘
Do you want full access?
Subscribe today to unlock all pages.
Trusted by 1+ million students worldwide
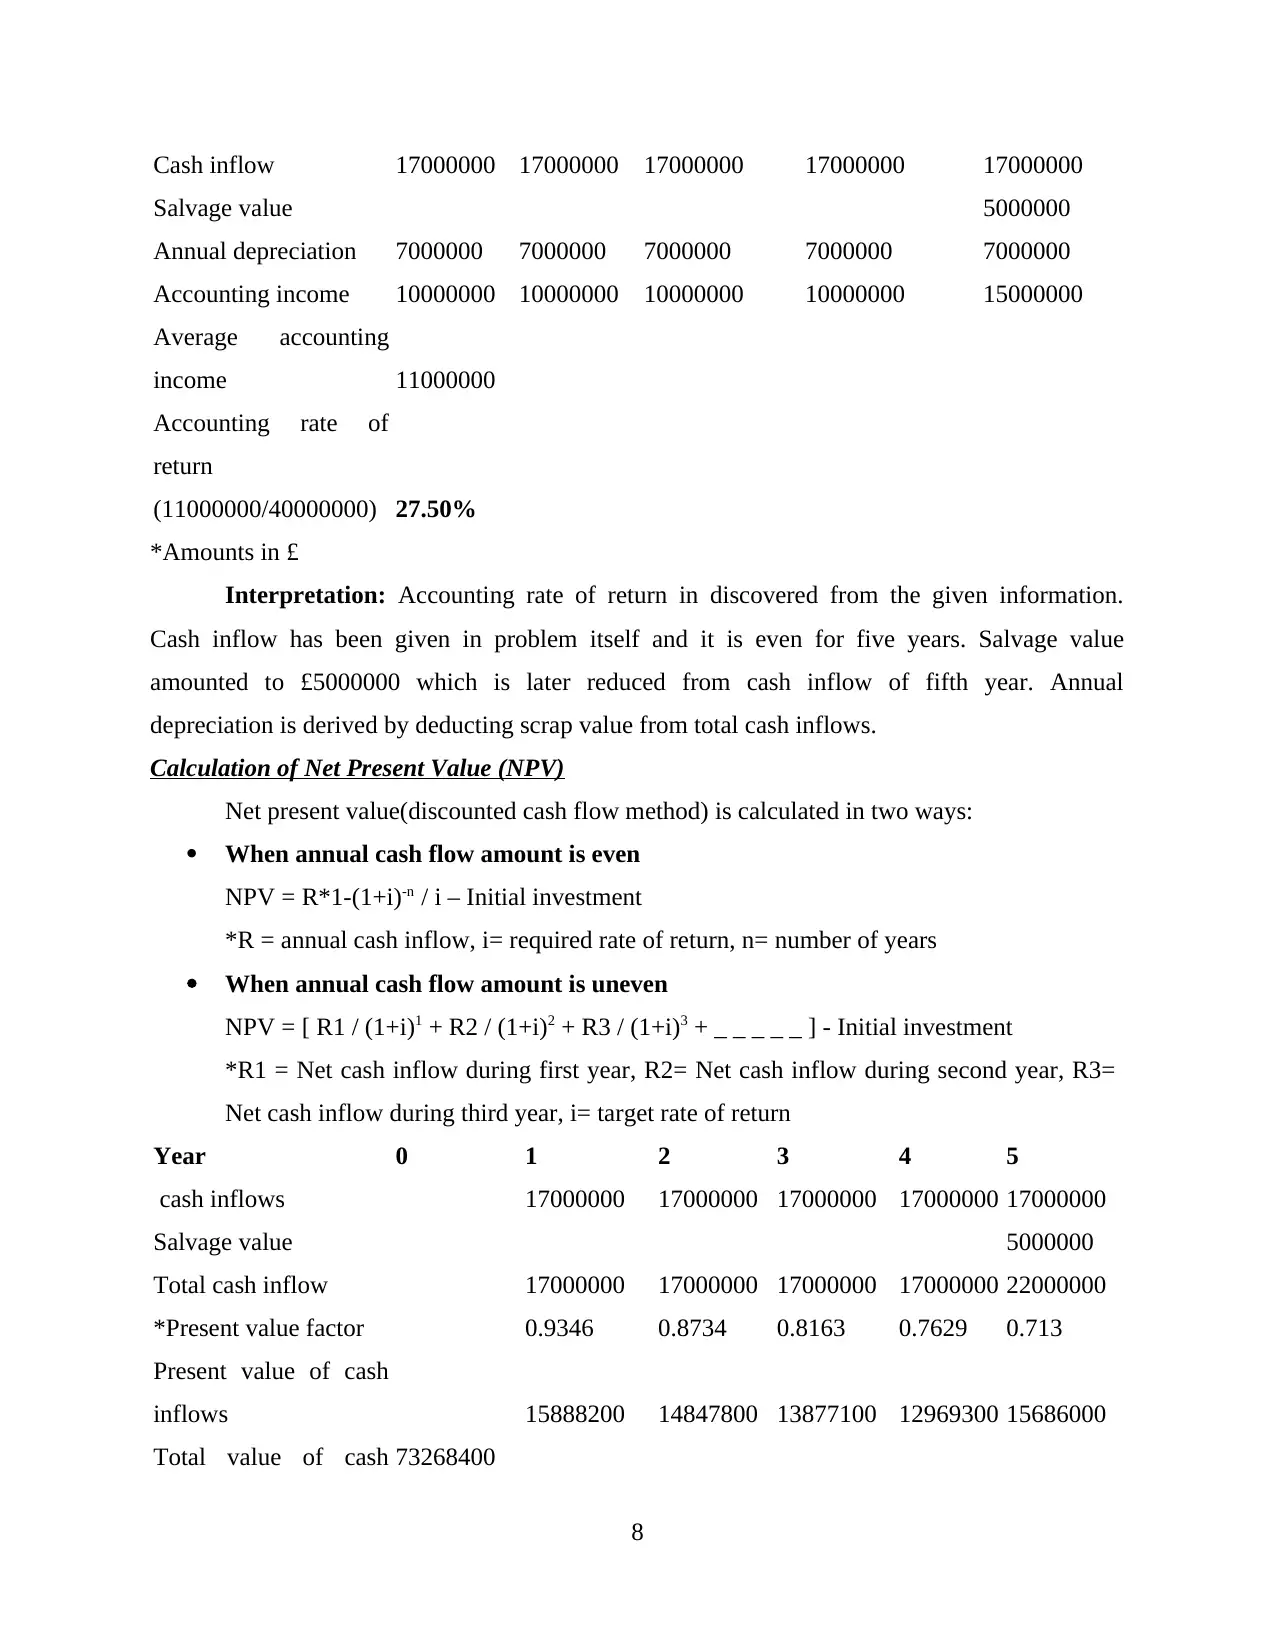
Cash inflow 17000000 17000000 17000000 17000000 17000000
Salvage value 5000000
Annual depreciation 7000000 7000000 7000000 7000000 7000000
Accounting income 10000000 10000000 10000000 10000000 15000000
Average accounting
income 11000000
Accounting rate of
return
(11000000/40000000) 27.50%
*Amounts in £
Interpretation: Accounting rate of return in discovered from the given information.
Cash inflow has been given in problem itself and it is even for five years. Salvage value
amounted to £5000000 which is later reduced from cash inflow of fifth year. Annual
depreciation is derived by deducting scrap value from total cash inflows.
Calculation of Net Present Value (NPV)
Net present value(discounted cash flow method) is calculated in two ways:
When annual cash flow amount is even
NPV = R*1-(1+i)-n / i – Initial investment
*R = annual cash inflow, i= required rate of return, n= number of years
When annual cash flow amount is uneven
NPV = [ R1 / (1+i)1 + R2 / (1+i)2 + R3 / (1+i)3 + _ _ _ _ _ ] - Initial investment
*R1 = Net cash inflow during first year, R2= Net cash inflow during second year, R3=
Net cash inflow during third year, i= target rate of return
Year 0 1 2 3 4 5
cash inflows 17000000 17000000 17000000 17000000 17000000
Salvage value 5000000
Total cash inflow 17000000 17000000 17000000 17000000 22000000
*Present value factor 0.9346 0.8734 0.8163 0.7629 0.713
Present value of cash
inflows 15888200 14847800 13877100 12969300 15686000
Total value of cash 73268400
8
Salvage value 5000000
Annual depreciation 7000000 7000000 7000000 7000000 7000000
Accounting income 10000000 10000000 10000000 10000000 15000000
Average accounting
income 11000000
Accounting rate of
return
(11000000/40000000) 27.50%
*Amounts in £
Interpretation: Accounting rate of return in discovered from the given information.
Cash inflow has been given in problem itself and it is even for five years. Salvage value
amounted to £5000000 which is later reduced from cash inflow of fifth year. Annual
depreciation is derived by deducting scrap value from total cash inflows.
Calculation of Net Present Value (NPV)
Net present value(discounted cash flow method) is calculated in two ways:
When annual cash flow amount is even
NPV = R*1-(1+i)-n / i – Initial investment
*R = annual cash inflow, i= required rate of return, n= number of years
When annual cash flow amount is uneven
NPV = [ R1 / (1+i)1 + R2 / (1+i)2 + R3 / (1+i)3 + _ _ _ _ _ ] - Initial investment
*R1 = Net cash inflow during first year, R2= Net cash inflow during second year, R3=
Net cash inflow during third year, i= target rate of return
Year 0 1 2 3 4 5
cash inflows 17000000 17000000 17000000 17000000 17000000
Salvage value 5000000
Total cash inflow 17000000 17000000 17000000 17000000 22000000
*Present value factor 0.9346 0.8734 0.8163 0.7629 0.713
Present value of cash
inflows 15888200 14847800 13877100 12969300 15686000
Total value of cash 73268400
8
Paraphrase This Document
Need a fresh take? Get an instant paraphrase of this document with our AI Paraphraser
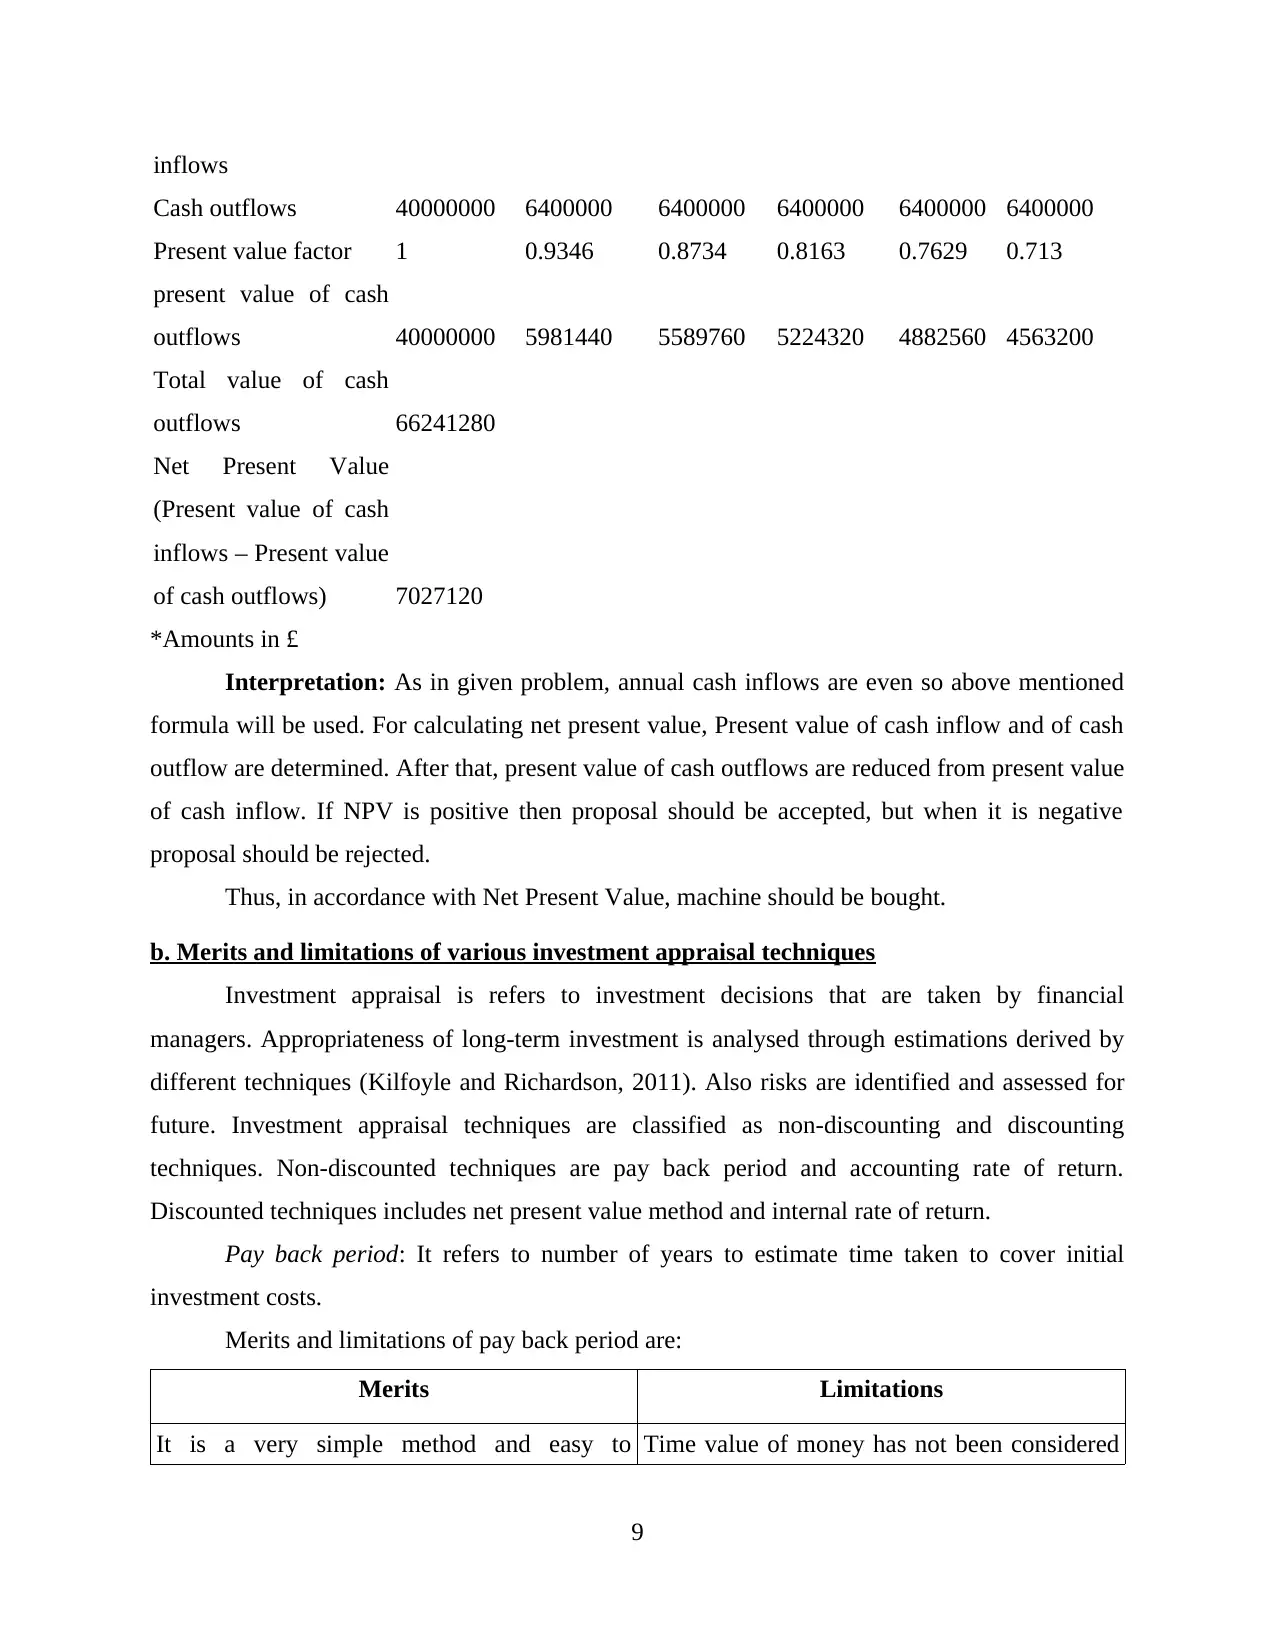
inflows
Cash outflows 40000000 6400000 6400000 6400000 6400000 6400000
Present value factor 1 0.9346 0.8734 0.8163 0.7629 0.713
present value of cash
outflows 40000000 5981440 5589760 5224320 4882560 4563200
Total value of cash
outflows 66241280
Net Present Value
(Present value of cash
inflows – Present value
of cash outflows) 7027120
*Amounts in £
Interpretation: As in given problem, annual cash inflows are even so above mentioned
formula will be used. For calculating net present value, Present value of cash inflow and of cash
outflow are determined. After that, present value of cash outflows are reduced from present value
of cash inflow. If NPV is positive then proposal should be accepted, but when it is negative
proposal should be rejected.
Thus, in accordance with Net Present Value, machine should be bought.
b. Merits and limitations of various investment appraisal techniques
Investment appraisal is refers to investment decisions that are taken by financial
managers. Appropriateness of long-term investment is analysed through estimations derived by
different techniques (Kilfoyle and Richardson, 2011). Also risks are identified and assessed for
future. Investment appraisal techniques are classified as non-discounting and discounting
techniques. Non-discounted techniques are pay back period and accounting rate of return.
Discounted techniques includes net present value method and internal rate of return.
Pay back period: It refers to number of years to estimate time taken to cover initial
investment costs.
Merits and limitations of pay back period are:
Merits Limitations
It is a very simple method and easy to Time value of money has not been considered
9
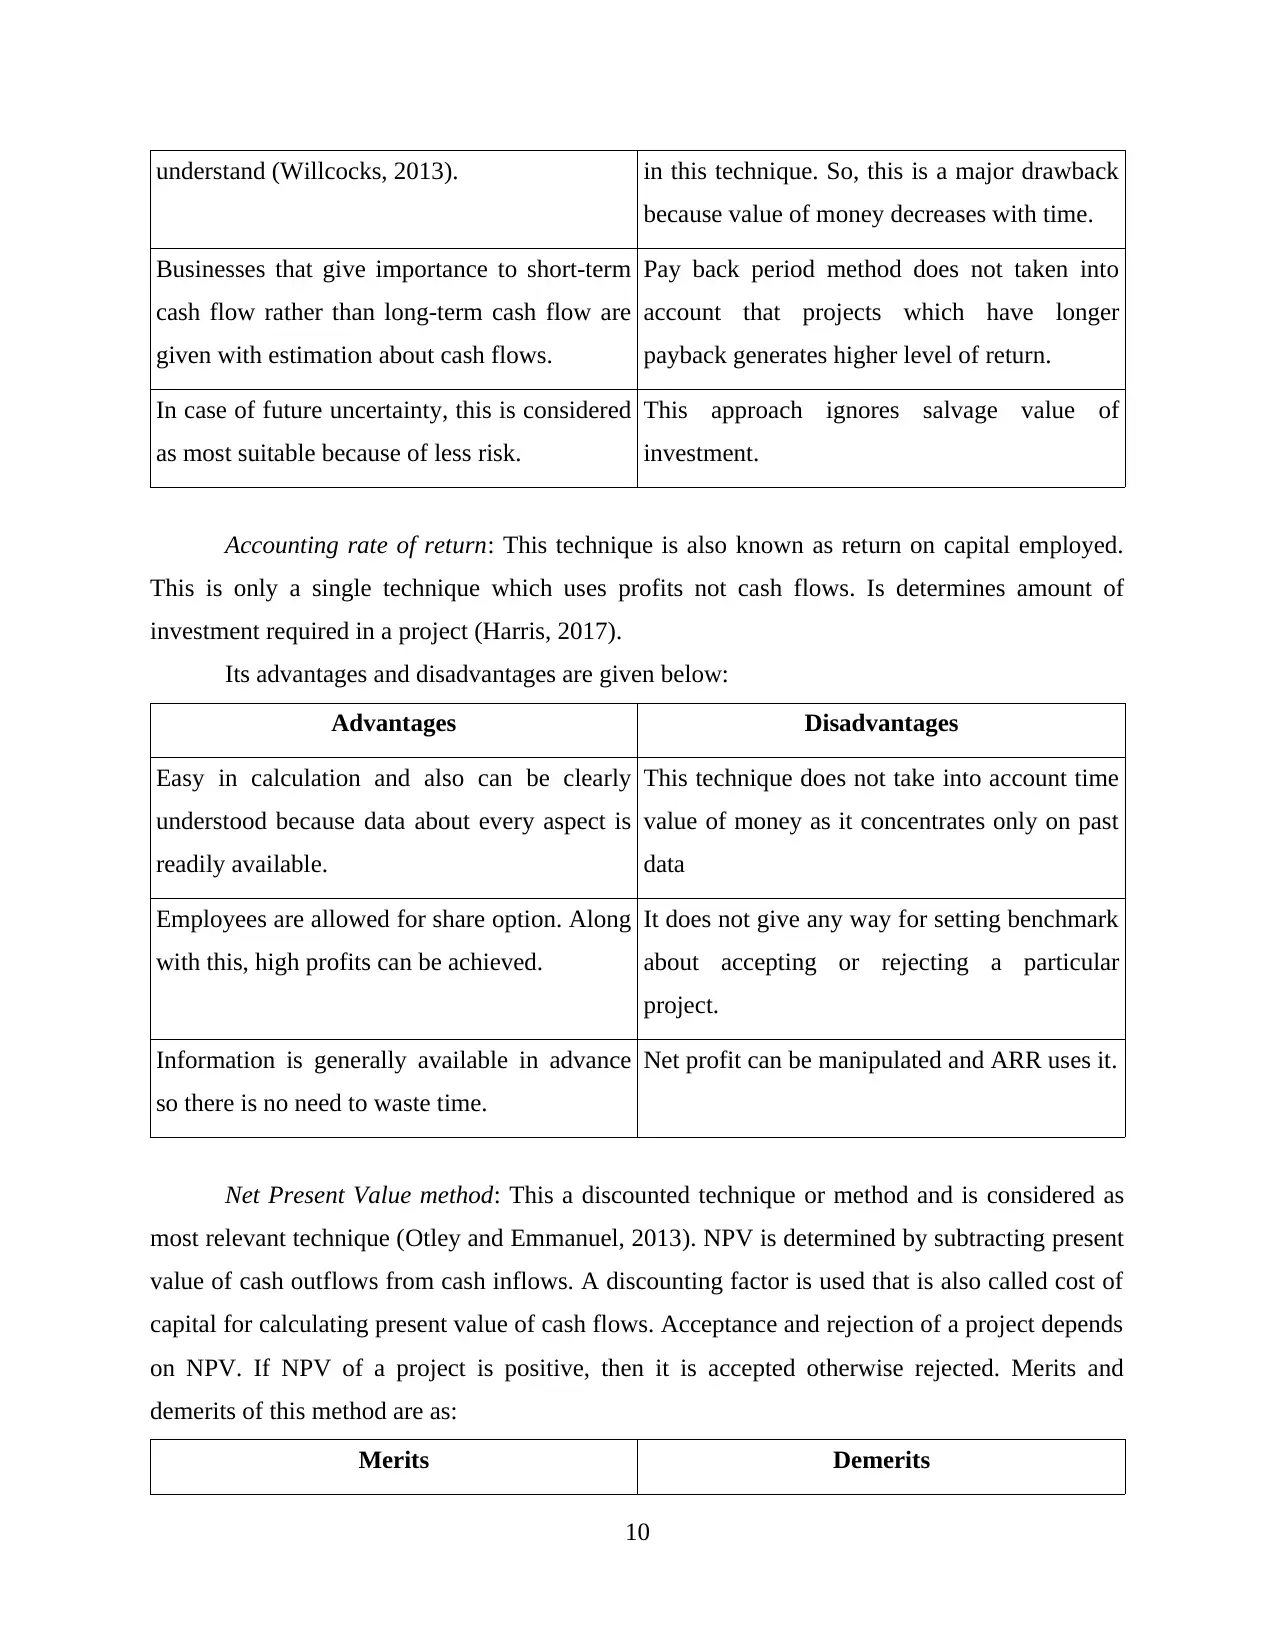
understand (Willcocks, 2013). in this technique. So, this is a major drawback
because value of money decreases with time.
Businesses that give importance to short-term
cash flow rather than long-term cash flow are
given with estimation about cash flows.
Pay back period method does not taken into
account that projects which have longer
payback generates higher level of return.
In case of future uncertainty, this is considered
as most suitable because of less risk.
This approach ignores salvage value of
investment.
Accounting rate of return: This technique is also known as return on capital employed.
This is only a single technique which uses profits not cash flows. Is determines amount of
investment required in a project (Harris, 2017).
Its advantages and disadvantages are given below:
Advantages Disadvantages
Easy in calculation and also can be clearly
understood because data about every aspect is
readily available.
This technique does not take into account time
value of money as it concentrates only on past
data
Employees are allowed for share option. Along
with this, high profits can be achieved.
It does not give any way for setting benchmark
about accepting or rejecting a particular
project.
Information is generally available in advance
so there is no need to waste time.
Net profit can be manipulated and ARR uses it.
Net Present Value method: This a discounted technique or method and is considered as
most relevant technique (Otley and Emmanuel, 2013). NPV is determined by subtracting present
value of cash outflows from cash inflows. A discounting factor is used that is also called cost of
capital for calculating present value of cash flows. Acceptance and rejection of a project depends
on NPV. If NPV of a project is positive, then it is accepted otherwise rejected. Merits and
demerits of this method are as:
Merits Demerits
10
⊘ This is a preview!⊘
Do you want full access?
Subscribe today to unlock all pages.
Trusted by 1+ million students worldwide
1 out of 15
Related Documents


Your All-in-One AI-Powered Toolkit for Academic Success.
+13062052269
info@desklib.com
Available 24*7 on WhatsApp / Email
![[object Object]](/_next/static/media/star-bottom.7253800d.svg)
Unlock your academic potential
Copyright © 2020–2026 A2Z Services. All Rights Reserved. Developed and managed by ZUCOL.