Financial Statement Analysis and Project Evaluation Report
VerifiedAdded on 2023/06/10
|12
|862
|454
Report
AI Summary
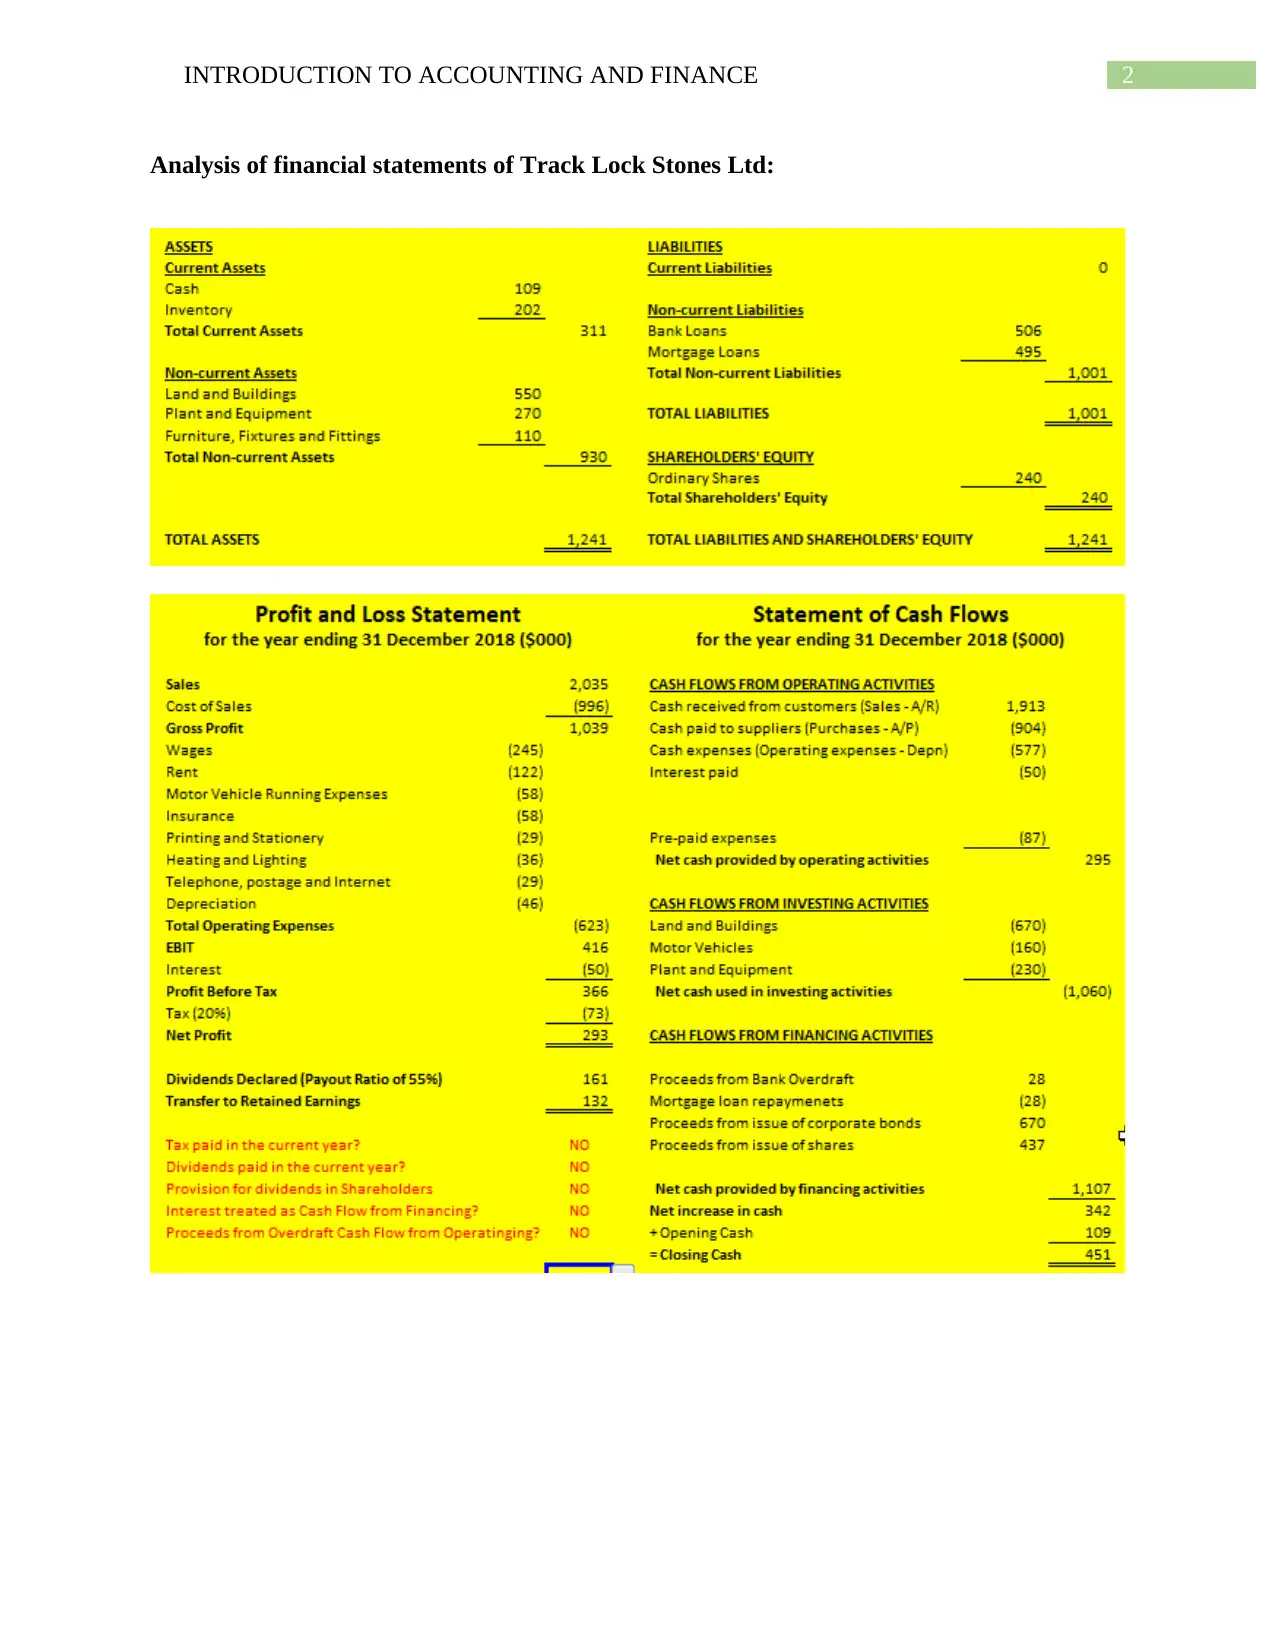
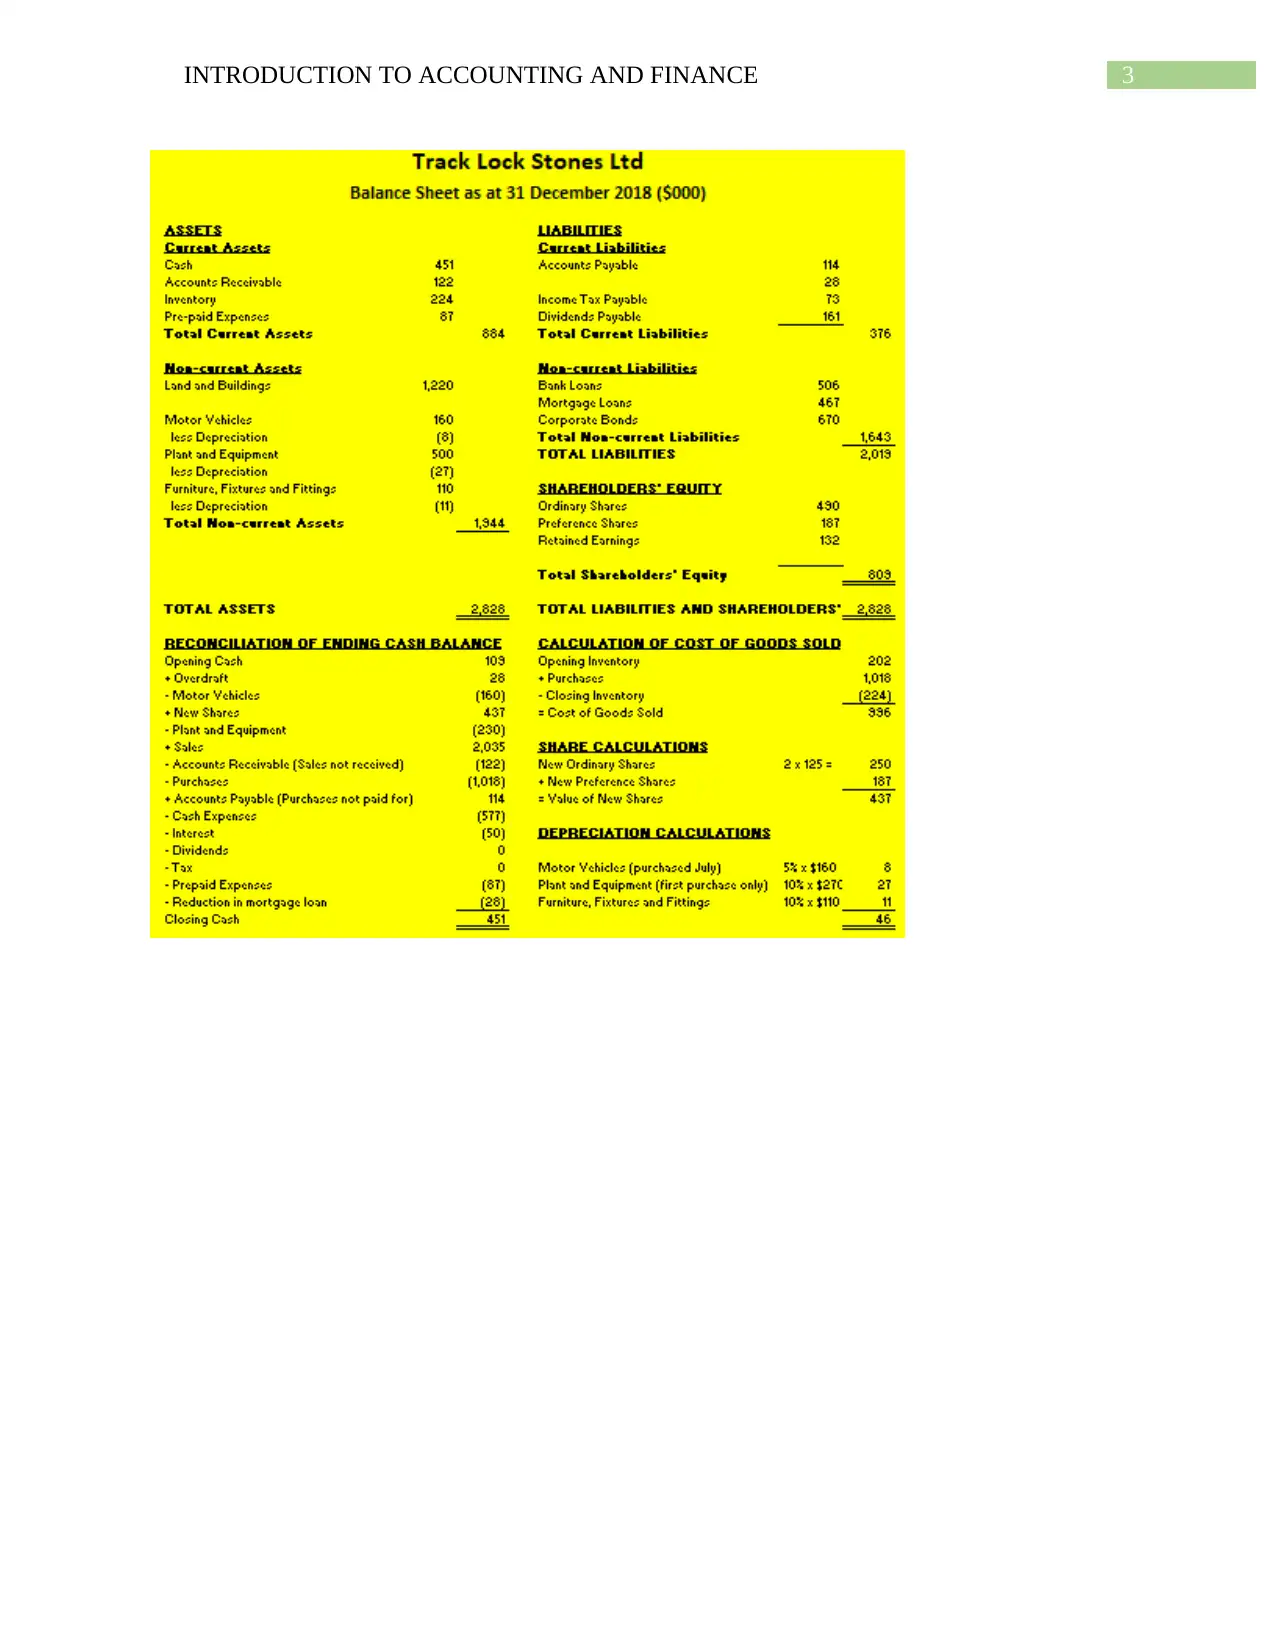
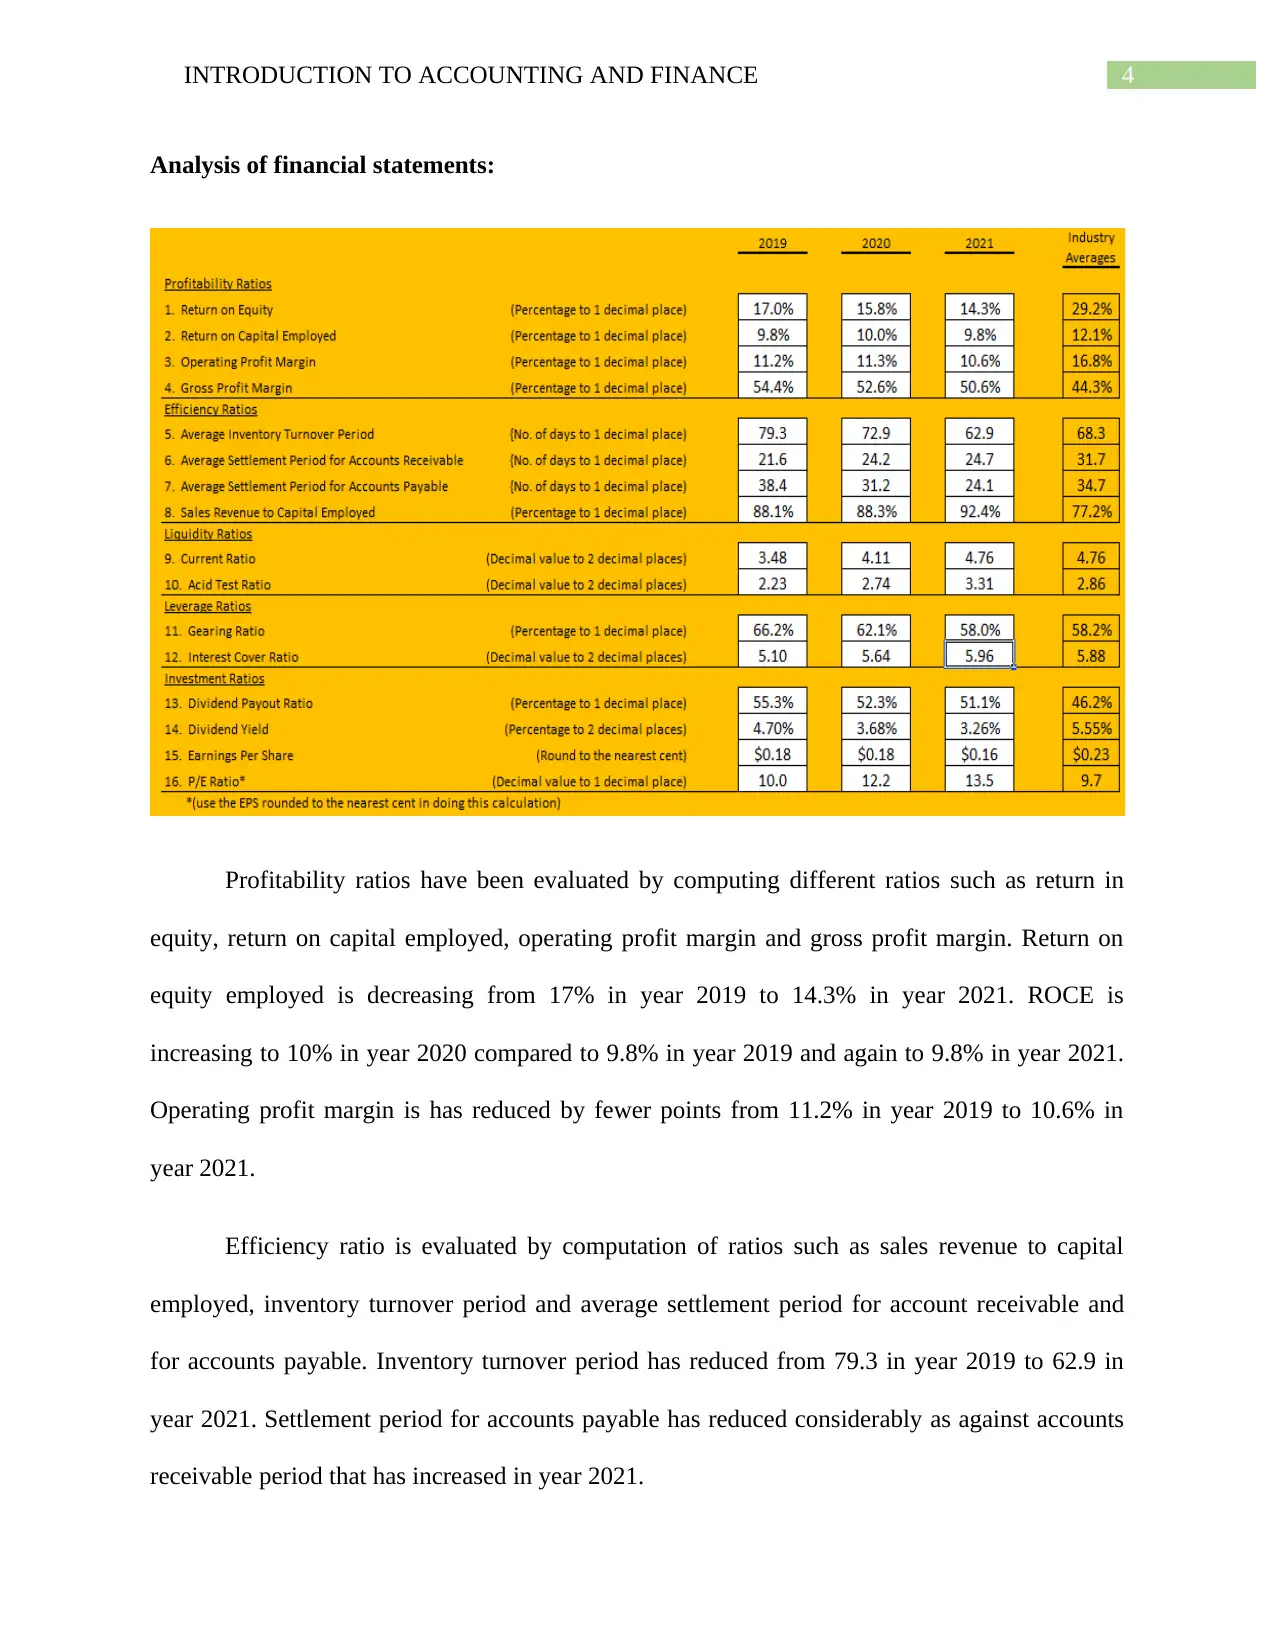
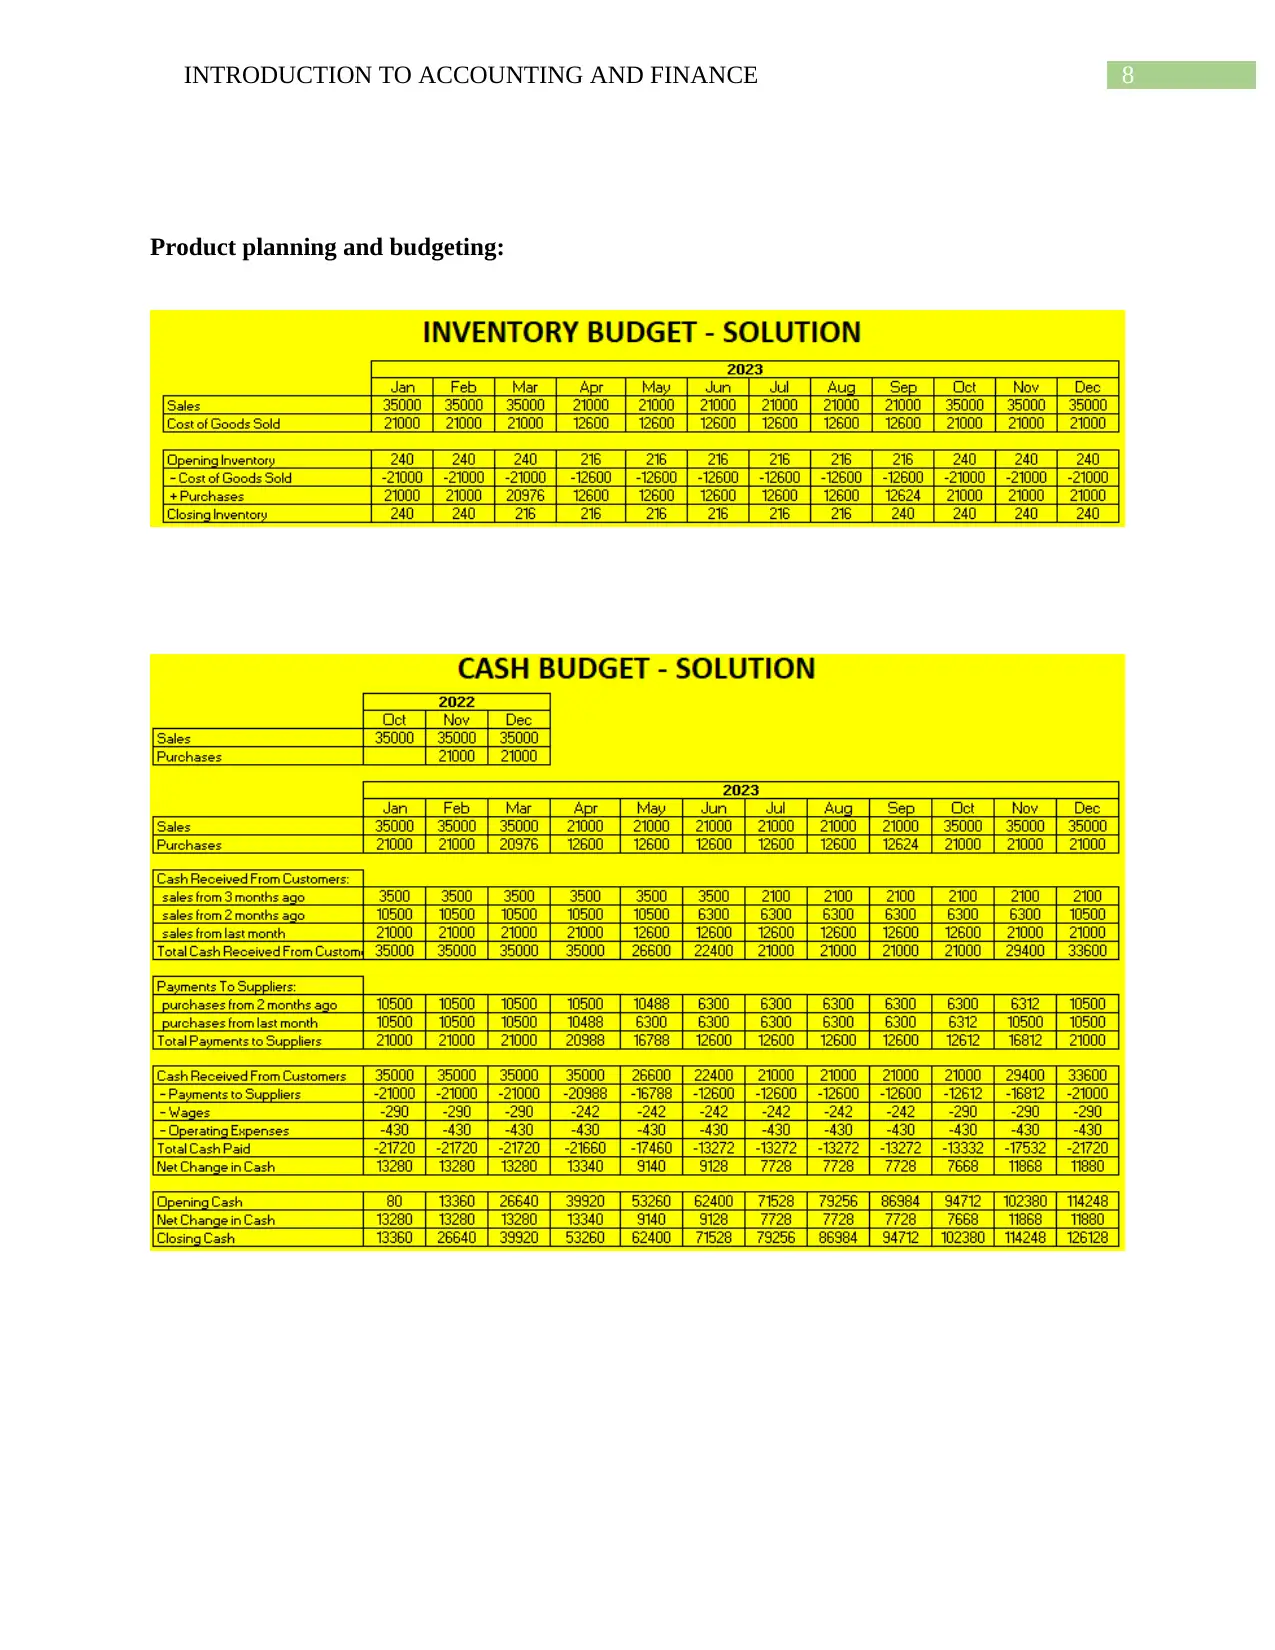
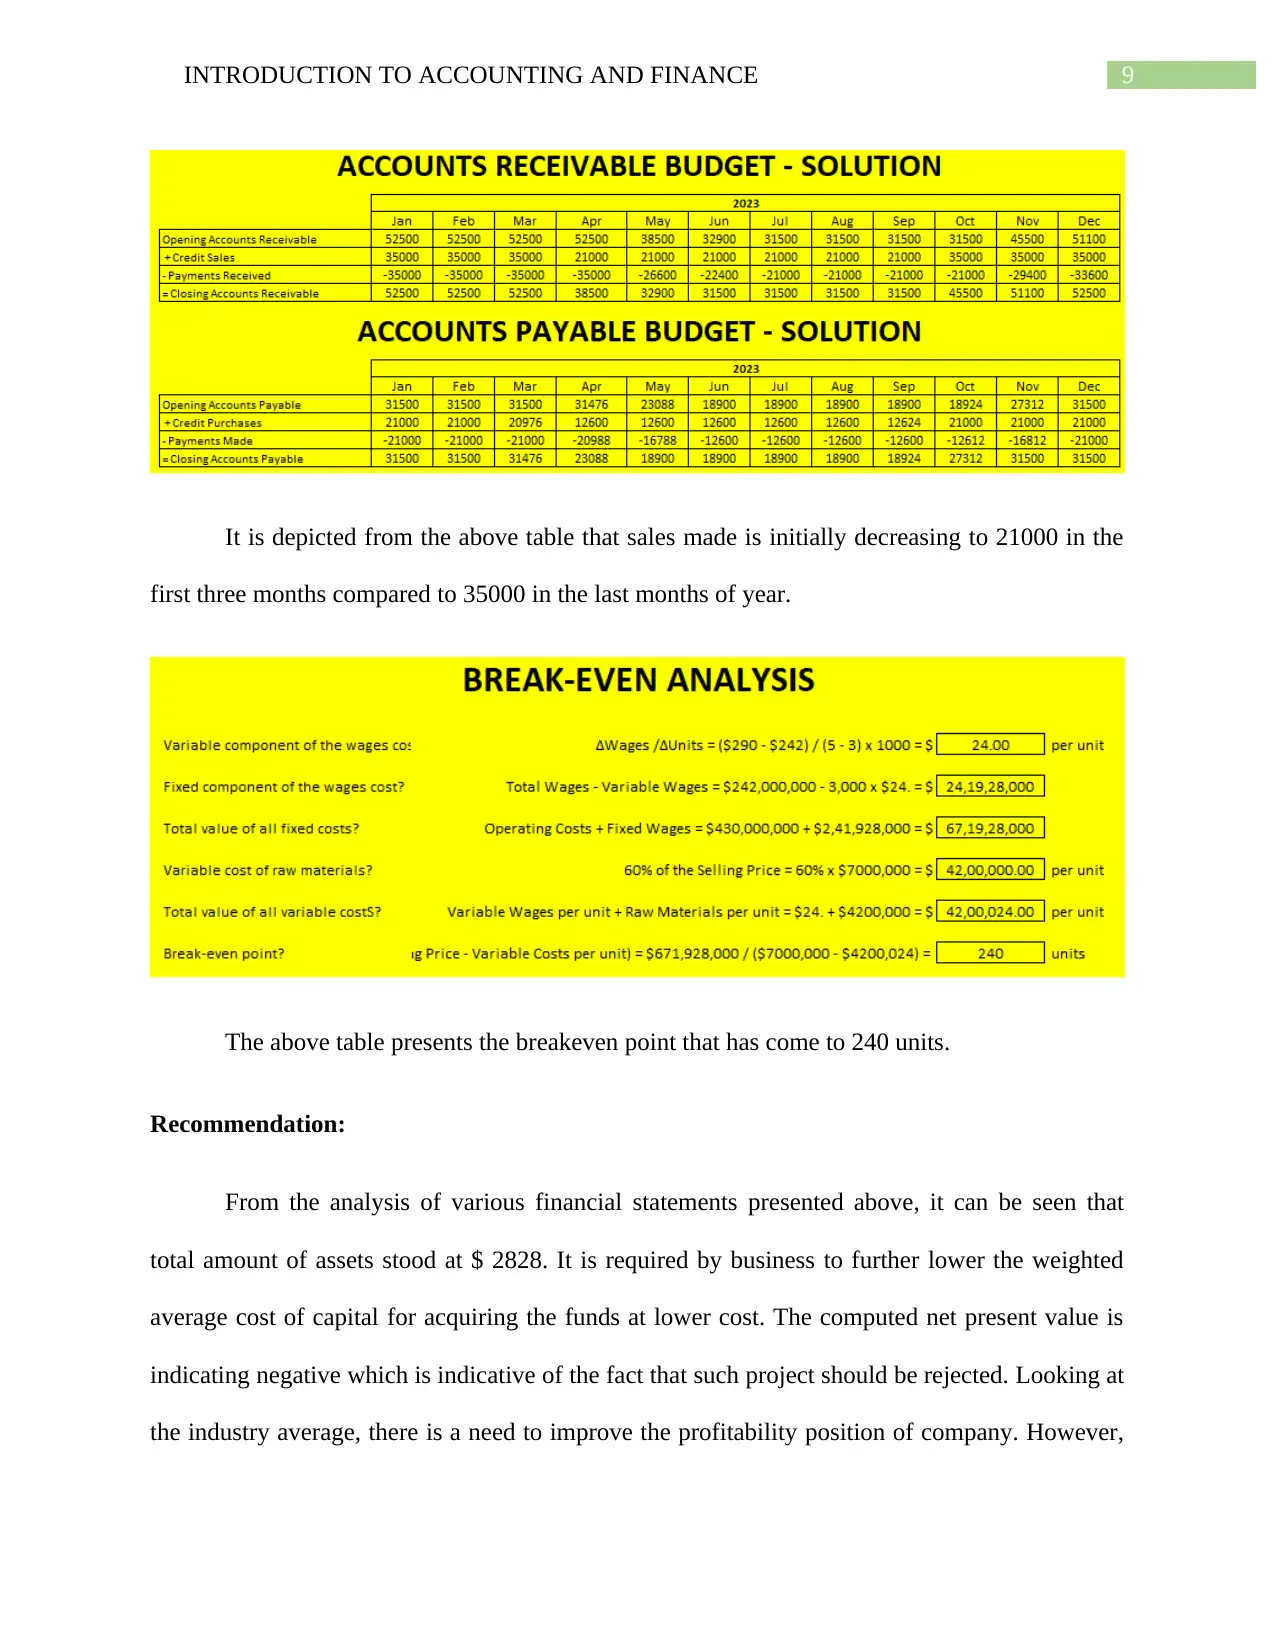
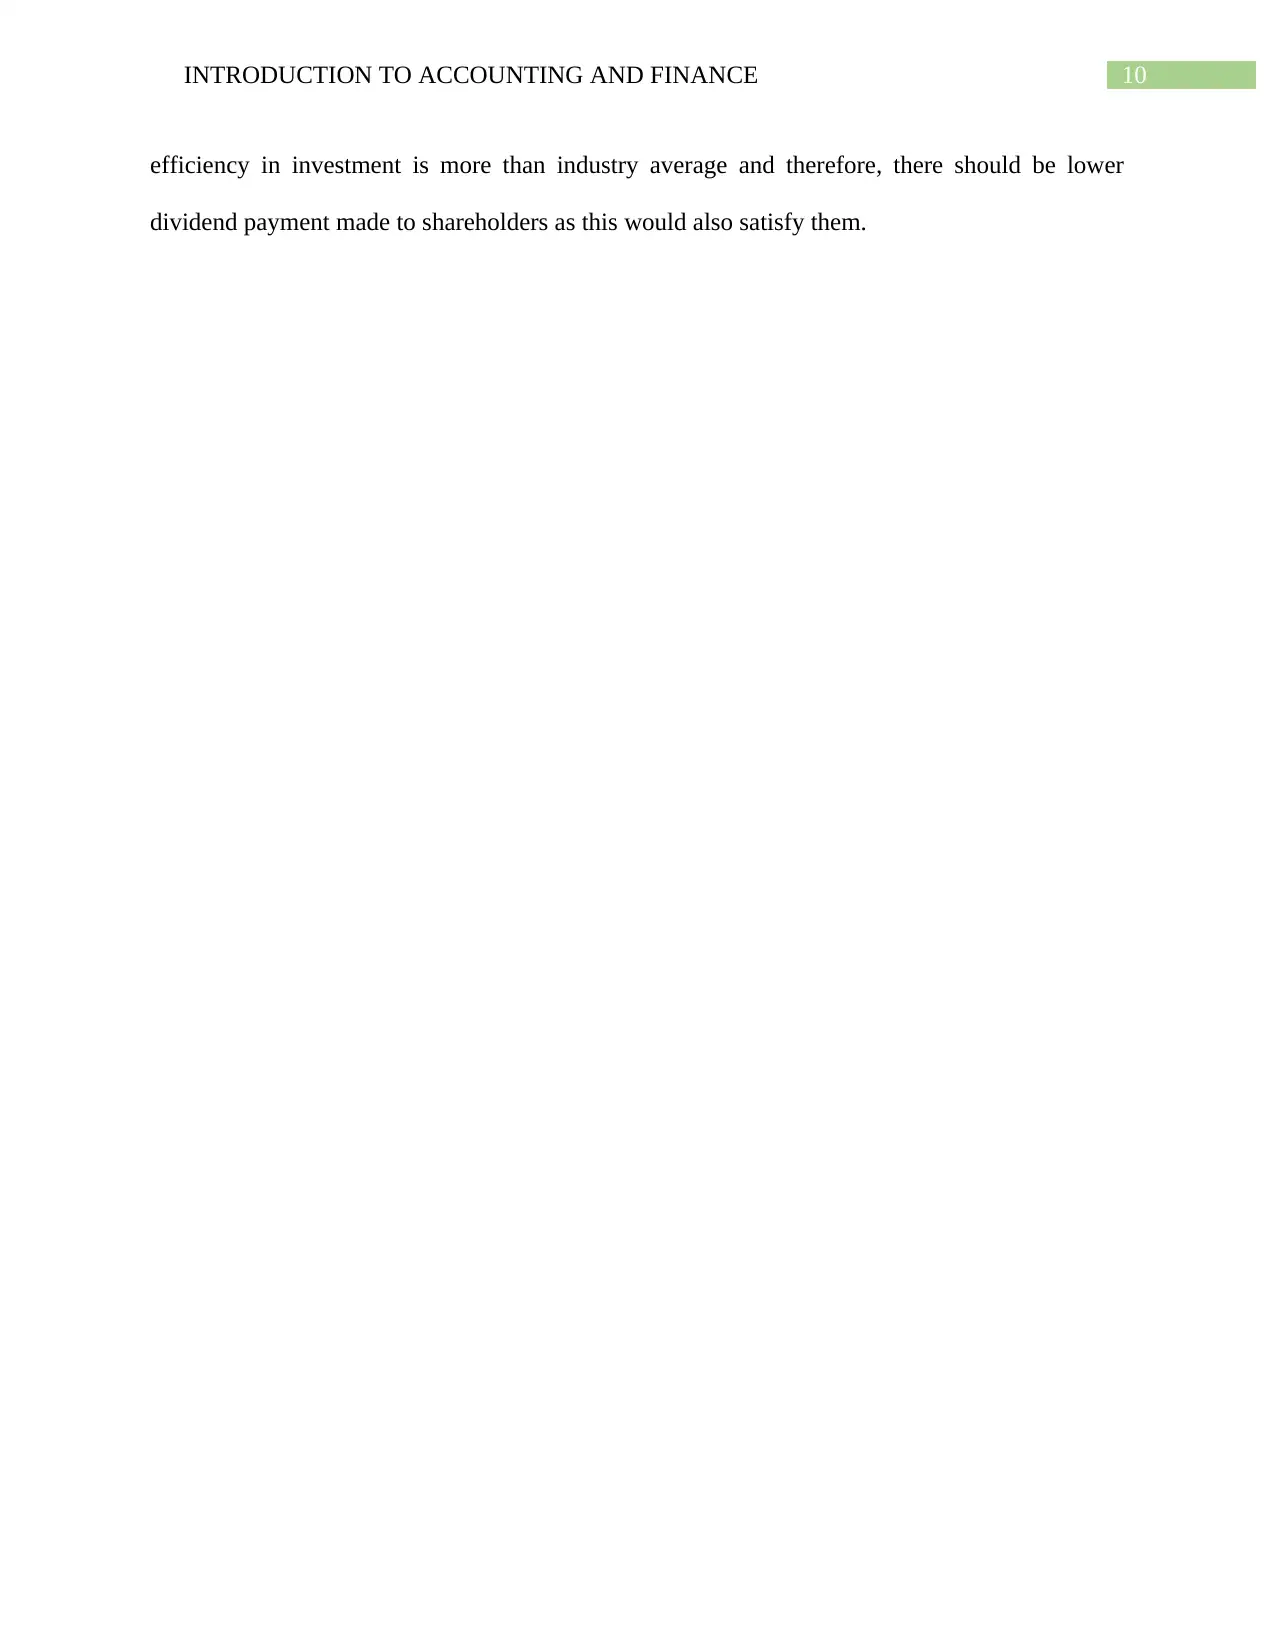
This report provides a comprehensive analysis of the financial statements of Track Lock Stones Ltd, evaluating profitability, efficiency, liquidity, leverage, and investment ratios. It computes the weighted average cost of capital and evaluates a project using capital budgeting tools, including the net present value. The report also covers product planning and budgeting, including break-even analysis. Based on the financial analysis, the report offers recommendations to improve the company's financial performance, emphasizing the need to lower the weighted average cost of capital and improve profitability while maintaining efficiency. The analysis includes relevant financial ratios, calculations, and interpretations to support the recommendations and conclusions.

Running head: INTRODUCTION TO ACCOUNTING AND FINANCE
Introduction to Accounting and Finance
Name of the Student:
Name of the University:
Author’s Note:
Introduction to Accounting and Finance
Name of the Student:
Name of the University:
Author’s Note:
Paraphrase This Document
Need a fresh take? Get an instant paraphrase of this document with our AI Paraphraser

1INTRODUCTION TO ACCOUNTING AND FINANCE
Table of Contents
Analysis of financial statements of Track Lock Stones Ltd:...........................................................2
Analysis of financial statements:.....................................................................................................4
Computation of cost of capital:........................................................................................................6
Evaluation of project using capital budgeting tools:.......................................................................7
Product planning and budgeting:.....................................................................................................8
Recommendation:............................................................................................................................9
References list:...............................................................................................................................11

2INTRODUCTION TO ACCOUNTING AND FINANCE
Analysis of financial statements of Track Lock Stones Ltd:
⊘ This is a preview!⊘
Do you want full access?
Subscribe today to unlock all pages.

Trusted by 1+ million students worldwide

3INTRODUCTION TO ACCOUNTING AND FINANCE
Paraphrase This Document
Need a fresh take? Get an instant paraphrase of this document with our AI Paraphraser

4INTRODUCTION TO ACCOUNTING AND FINANCE
Analysis of financial statements:
Profitability ratios have been evaluated by computing different ratios such as return in
equity, return on capital employed, operating profit margin and gross profit margin. Return on
equity employed is decreasing from 17% in year 2019 to 14.3% in year 2021. ROCE is
increasing to 10% in year 2020 compared to 9.8% in year 2019 and again to 9.8% in year 2021.
Operating profit margin is has reduced by fewer points from 11.2% in year 2019 to 10.6% in
year 2021.
Efficiency ratio is evaluated by computation of ratios such as sales revenue to capital
employed, inventory turnover period and average settlement period for account receivable and
for accounts payable. Inventory turnover period has reduced from 79.3 in year 2019 to 62.9 in
year 2021. Settlement period for accounts payable has reduced considerably as against accounts
receivable period that has increased in year 2021.

5INTRODUCTION TO ACCOUNTING AND FINANCE
Liquidity ratio is evaluated by computing current ratio and acid test ratio. Current ratio is
increasing from 3.48 in year 2019 to 4.76 in year 2021 indicating that ability of current assets to
meet short term obligations have reduced. Acid test ratio on other hand has increased from 2.23
in year 2019 to 3.31 in year 2021.
Looking at leverage ratio, gearing ratio has reduced considerably from 66.2% in year
2019 to 58% in year 2021 indicating that proportion of borrowed fund has reduced compared to
equity. Interest cover ratio on other hand has increased from 5.10 in year 2019 to 5.96 in year
2021 which is indicative of the fact that the ability of company to make interest payment has
increased.
Now, looking at investment ratios, there is decline dividend payout ratio to 51.1% in year
2021 compared to 55.3% in year 2019. This depicts that dividend payment has increased by
company. Dividend yield on other hand has reduced to 3.26% in year 2021 compared to 4.7% in
year 2019. Earnings per share have reduced from $ 0.18 in year 2019 and 2020 to $ 0.16 in year
2021. There has been significant increase in price earnings ratio from 10.0 in year 2019 to 13.5
in year 2021 respectively.
⊘ This is a preview!⊘
Do you want full access?
Subscribe today to unlock all pages.

Trusted by 1+ million students worldwide

6INTRODUCTION TO ACCOUNTING AND FINANCE
Computation of cost of capital:
The weighted average cost of capital is computed at 11.6%.
Computation of cost of capital:
The weighted average cost of capital is computed at 11.6%.
Paraphrase This Document
Need a fresh take? Get an instant paraphrase of this document with our AI Paraphraser

7INTRODUCTION TO ACCOUNTING AND FINANCE
Evaluation of project using capital budgeting tools:
The above table shows the computation of net present value of project that takes into
account present value of cash flows, weighted average cost of capital and applicable rate of tax.
It can be seen that net present value of project stood at -66.30 which is a negative figure
indicating that project should be rejected.

8INTRODUCTION TO ACCOUNTING AND FINANCE
Product planning and budgeting:
⊘ This is a preview!⊘
Do you want full access?
Subscribe today to unlock all pages.

Trusted by 1+ million students worldwide

9INTRODUCTION TO ACCOUNTING AND FINANCE
It is depicted from the above table that sales made is initially decreasing to 21000 in the
first three months compared to 35000 in the last months of year.
The above table presents the breakeven point that has come to 240 units.
Recommendation:
From the analysis of various financial statements presented above, it can be seen that
total amount of assets stood at $ 2828. It is required by business to further lower the weighted
average cost of capital for acquiring the funds at lower cost. The computed net present value is
indicating negative which is indicative of the fact that such project should be rejected. Looking at
the industry average, there is a need to improve the profitability position of company. However,
Paraphrase This Document
Need a fresh take? Get an instant paraphrase of this document with our AI Paraphraser

10INTRODUCTION TO ACCOUNTING AND FINANCE
efficiency in investment is more than industry average and therefore, there should be lower
dividend payment made to shareholders as this would also satisfy them.
efficiency in investment is more than industry average and therefore, there should be lower
dividend payment made to shareholders as this would also satisfy them.

11INTRODUCTION TO ACCOUNTING AND FINANCE
References list:
Gitman, L. J., Juchau, R., & Flanagan, J. (2015). Principles of managerial finance. Pearson
Higher Education AU.
Scott, W. R. (2015). Financial accounting theory (Vol. 2, No. 0, p. 0). Prentice Hall.
References list:
Gitman, L. J., Juchau, R., & Flanagan, J. (2015). Principles of managerial finance. Pearson
Higher Education AU.
Scott, W. R. (2015). Financial accounting theory (Vol. 2, No. 0, p. 0). Prentice Hall.
⊘ This is a preview!⊘
Do you want full access?
Subscribe today to unlock all pages.

Trusted by 1+ million students worldwide
1 out of 12
Related Documents
Your All-in-One AI-Powered Toolkit for Academic Success.
+13062052269
info@desklib.com
Available 24*7 on WhatsApp / Email
Unlock your academic potential
Copyright © 2020–2025 A2Z Services. All Rights Reserved. Developed and managed by ZUCOL.


