Financial Performance Analysis of Retail Firms Report
VerifiedAdded on 2020/02/05
|17
|4215
|74
Report
AI Summary
This report provides a comprehensive analysis of accounting and finance principles for managers, focusing on the financial performance of two major fashion retail firms, Next PLC and H&M. The report begins with an introduction to the importance of accounting and finance in business operations, followed by a detailed comparative analysis of the two companies' financial strengths using various financial and non-financial ratios. It examines liquidity, profitability, and efficiency ratios, presenting the data in charts and tables for clarity. The analysis includes an assessment of investment appraisal techniques and their limitations. The report also offers recommendations to improve the financial position of the companies based on the findings and concludes with a summary of the key insights. This report provides insights into practical applications of financial analysis, aiding in decision-making processes and offering a valuable resource for students studying accounting and finance.

ACCOUNTING AND FINANCE FOR
MANAGERS
MANAGERS
Paraphrase This Document
Need a fresh take? Get an instant paraphrase of this document with our AI Paraphraser
TABLE OF CONTENTS
INTRODUCTION...........................................................................................................................1
QUESTION 1 & 2. PERFORMANCE ANALYSIS USING CHARTS.........................................1
QUESTION 3. RECOMMENDATIONS TO IMPROVE THE FINANCIAL POSITION............8
QUESTION 4. LIMITATIONS OF RELYING ON FINANCIAL RATIOS.................................9
QUESTION 5. INVESTMENT APPRAISAL TECHNIQUES....................................................10
QUESTION 6. LIMITATIONS OF USING THE INVESTMENT APPRAISAL TECHNIQUES
........................................................................................................................................................13
CONCLUSION..............................................................................................................................14
REFERENCES..............................................................................................................................15
INTRODUCTION
Accounting and finance for managers lays a significant impact on the overall business
operations of a company. The organization operates its business on money, and if it fails to
manage and control its money, the company with no doubt loses its competitive position along
with the financial strength in the global business environment. In this regard, appropriate
accounting of the organization's income and expense is essential which helps to manage and
control the inflows and outflows of money thereby providing the organization with a strategic
direction to conduct its business operations. The present report analyzes the importance of
accounting and finance for the managers within an organization. Furthermore, it also examines
the link between theoretical knowledge as against practical applications. It helps to gain an
insight knowledge about different financial and non financial ratios along with the overall
financial interpretation of companies which helps in the decision making process.
QUESTION 1 & 2: PERFORMANCE ANALYSIS USING CHARTS
Comparative performance analysis of company's financial strength creates a tremendous
impact on the decision making process of the organization. It assists the investors along with the
employees and the management of the company to compare its overall competitive position in
the line of global business environment (Patra, 2006.). In the report, we have analyzed the
financial strength of two large fashion retail firms named Next Plc and H&M in order to analyze
its performance in the competitive market and to examine its investment appraisal techniques.
Comparative analysis of an organization is done by observing, examining, analysing and
finally interpreting the performance of some major financial and non financial ratios in the
following manner. In context with the present case file, company makes use of various financial
and non financial ratios to evaluate its business performance.
Financial ratios- These ratios are broadly segmented into the following categories-
Liquidity ratios- The organization makes use of this ratio to measure the short term credibility of
the firm. It serves the information of meeting the short term financial barriers by a company. The
two most commonly used liquidity ratios are-
1
⊘ This is a preview!⊘
Do you want full access?
Subscribe today to unlock all pages.
Trusted by 1+ million students worldwide
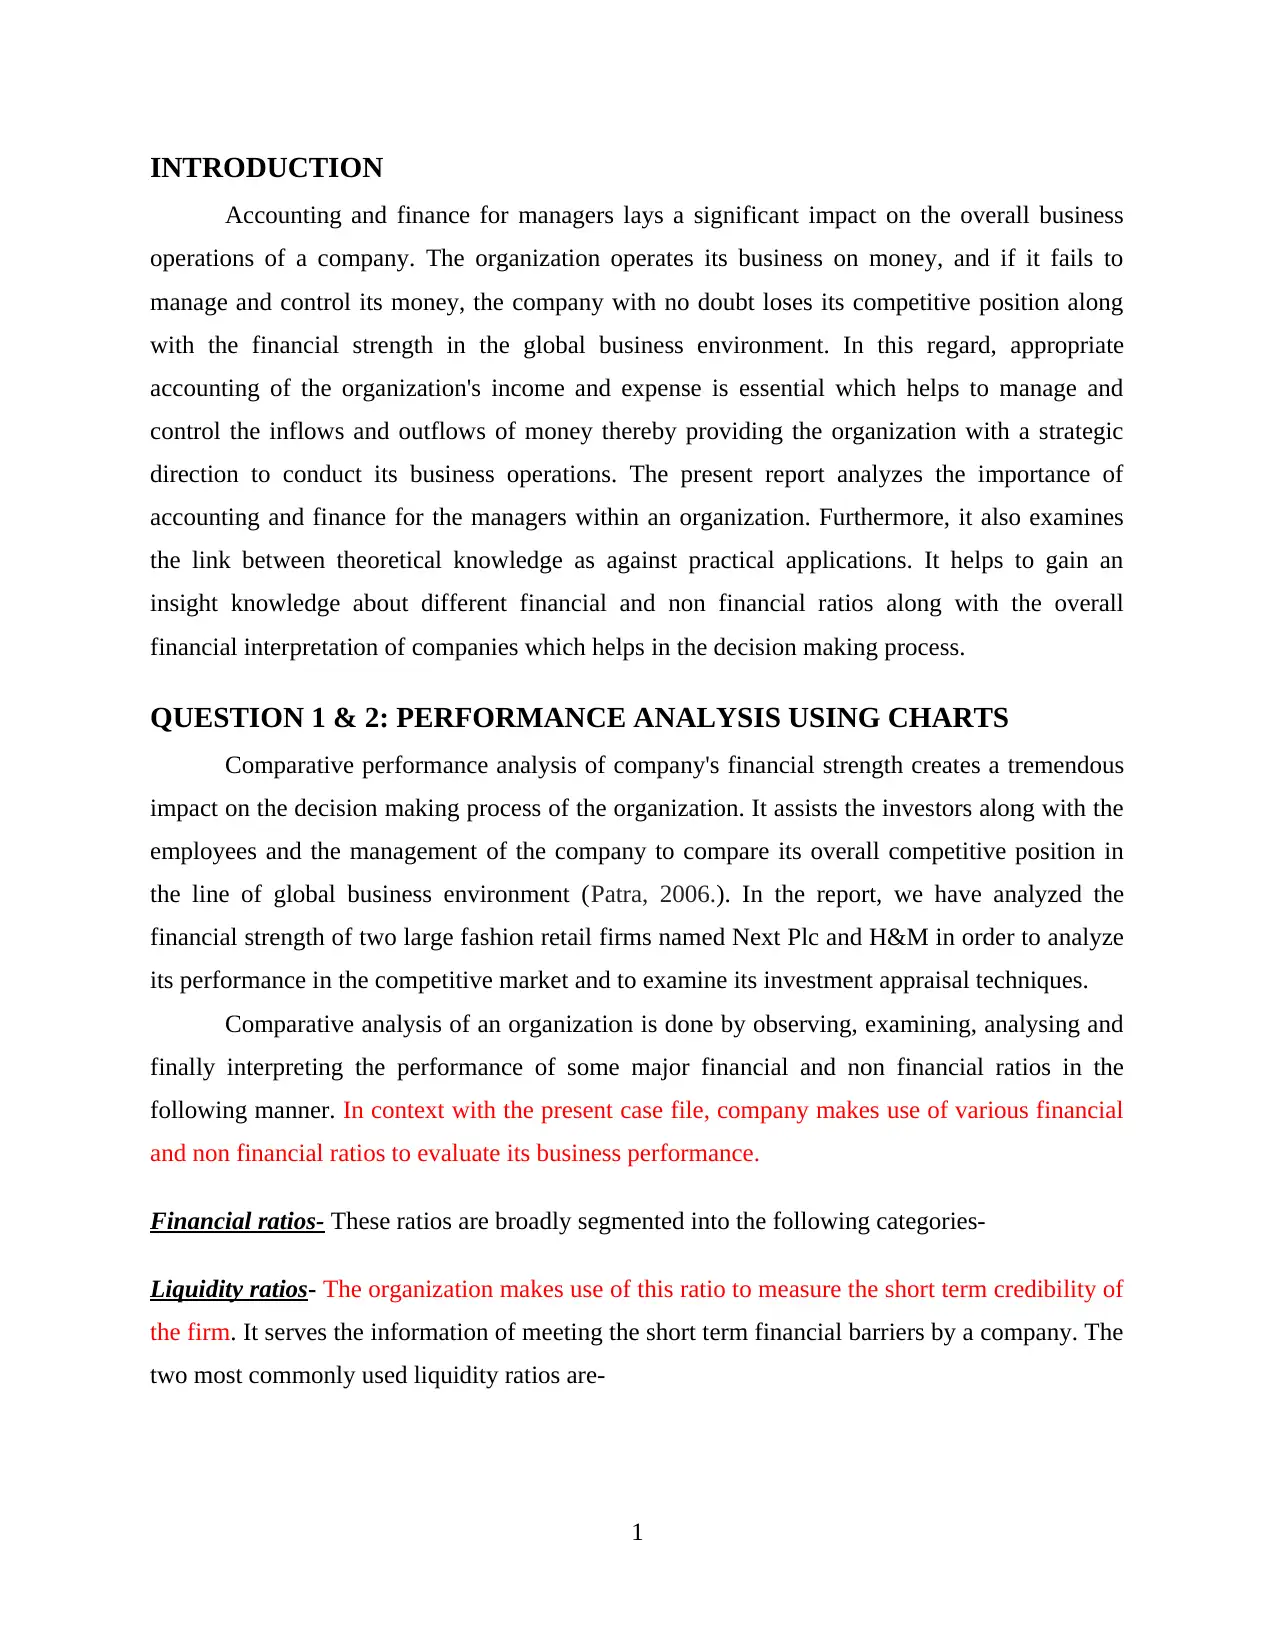
Current ratio-It measures the ability of the firm to pay its debts in the near future from its
existing resources. This ratio compares the company's current assets with its current
liabilities. In the present case, the current ratio of Next Plc has tremendously increased
from 1.28 to 1.82 over the past five years. However, the current ratio of H&M has
marked the downfall from 2.96 to 2.11 over the past 5 years. As a result, Next Plc
possesses good ability to pay off its debts from the existing resources because higher the
ratio, better it would result in company's liquidity position (Pavett and Lau, 2013).
Quick ratio-Also known as acid test ratio, is one of the alternative of current ratio which
does not include inventory in its current assets. It simply compares the total of accounts
receivables, cash and marketable securities with the total of its current liabilities. The
quick ratio of Next Plc has shown an increasing phenomenon from 0.72 to 1.16 over the
past five years (Eiteman and et.al., 2012). Conversely, H&M faces the decrement of its
quick ratio from 2.06 to 1.07 over the last five years. From this context, Next Plc
maintains greater liquidity position as compared to H&M.
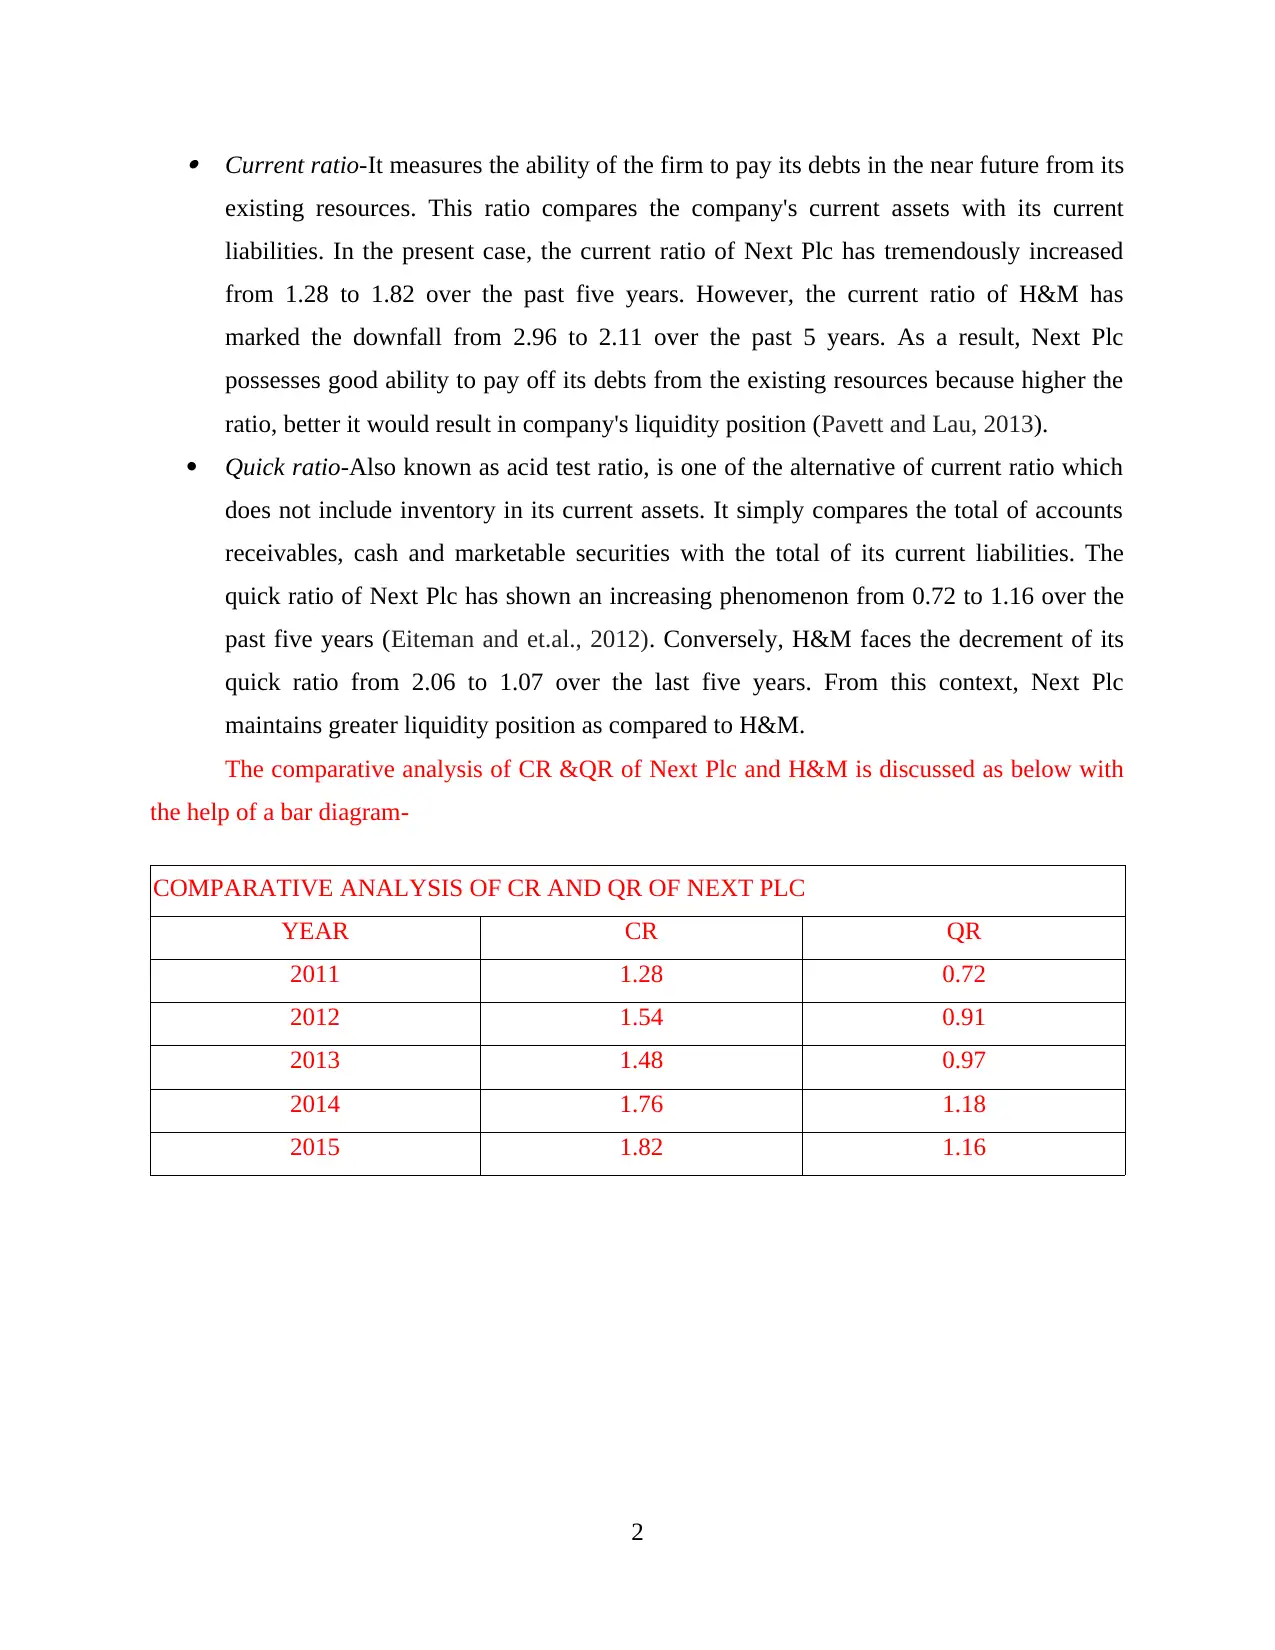
The comparative analysis of CR &QR of Next Plc and H&M is discussed as below with
the help of a bar diagram-
COMPARATIVE ANALYSIS OF CR AND QR OF NEXT PLC
YEAR CR QR
2011 1.28 0.72
2012 1.54 0.91
2013 1.48 0.97
2014 1.76 1.18
2015 1.82 1.16
2
existing resources. This ratio compares the company's current assets with its current
liabilities. In the present case, the current ratio of Next Plc has tremendously increased
from 1.28 to 1.82 over the past five years. However, the current ratio of H&M has
marked the downfall from 2.96 to 2.11 over the past 5 years. As a result, Next Plc
possesses good ability to pay off its debts from the existing resources because higher the
ratio, better it would result in company's liquidity position (Pavett and Lau, 2013).
Quick ratio-Also known as acid test ratio, is one of the alternative of current ratio which
does not include inventory in its current assets. It simply compares the total of accounts
receivables, cash and marketable securities with the total of its current liabilities. The
quick ratio of Next Plc has shown an increasing phenomenon from 0.72 to 1.16 over the
past five years (Eiteman and et.al., 2012). Conversely, H&M faces the decrement of its
quick ratio from 2.06 to 1.07 over the last five years. From this context, Next Plc
maintains greater liquidity position as compared to H&M.
The comparative analysis of CR &QR of Next Plc and H&M is discussed as below with
the help of a bar diagram-
COMPARATIVE ANALYSIS OF CR AND QR OF NEXT PLC
YEAR CR QR
2011 1.28 0.72
2012 1.54 0.91
2013 1.48 0.97
2014 1.76 1.18
2015 1.82 1.16
2
Paraphrase This Document
Need a fresh take? Get an instant paraphrase of this document with our AI Paraphraser
COMPARATIVE ANALYSIS OF CR AND QR OF H&M
YEAR CR QR
2010 2.96 2.06
2011 2.71 1.69
2012 2.66 1.49
2013 2.25 1.22
2014 2.11 1.07
3
03/07/1905
04/07/1905
05/07/1905
06/07/1905
07/07/1905
0 0.2 0.4 0.6 0.8 1 1.2 1.4 1.6 1.8 2
1.28
1.54
1.48
1.76
1.82
0.72
0.91
0.97
1.18
1.16
COMPARATIVE ANALYSIS OF LIQUIDITY RATIOS OF
NEXT PLC.
QR
CR
02/07/1905
03/07/1905
04/07/1905
05/07/1905
06/07/1905
0 0.5 1 1.5 2 2.5 3 3.5
2.96
2.71
2.66
2.25
2.11
2.06
1.69
1.49
1.22
1.07
COMPARATIVE ANALYSIS OF LIQUIDITY RATIOS OF H&M
QR
CR
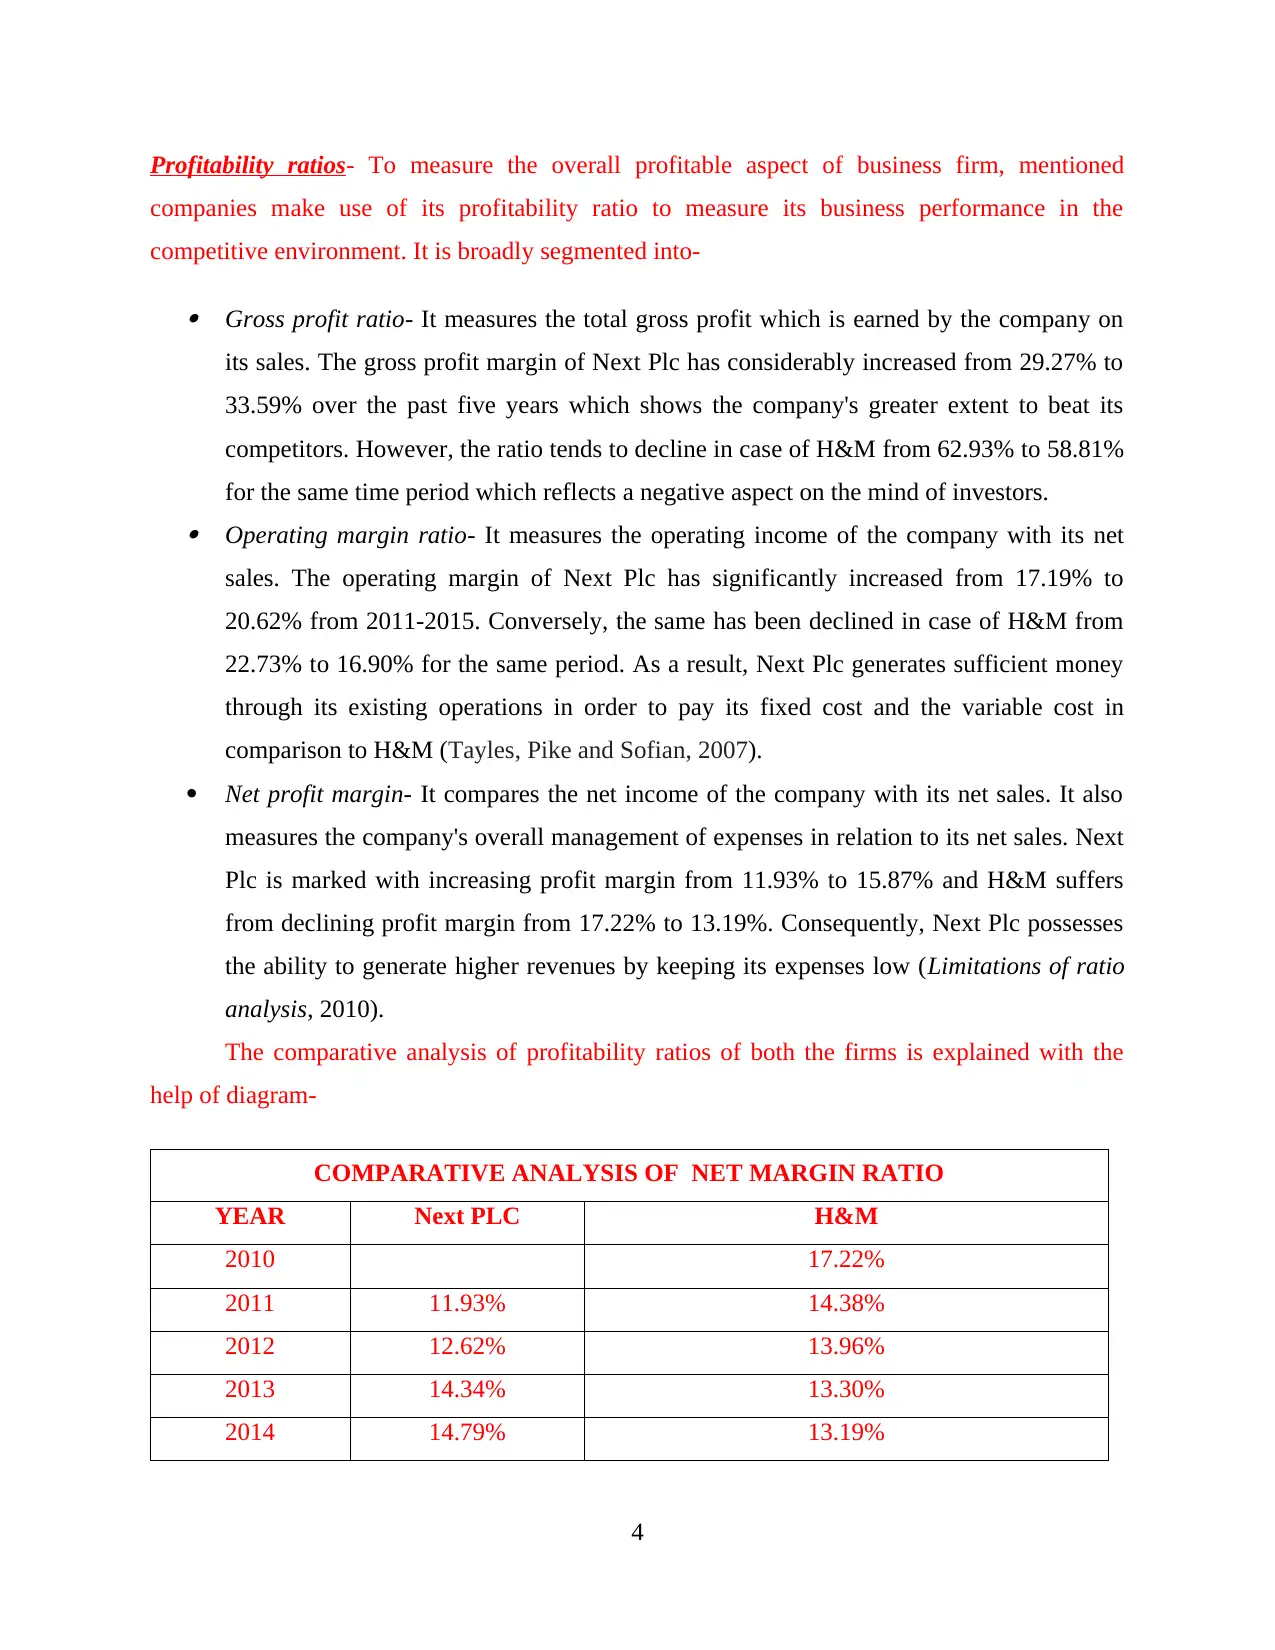
Profitability ratios- To measure the overall profitable aspect of business firm, mentioned
companies make use of its profitability ratio to measure its business performance in the
competitive environment. It is broadly segmented into-
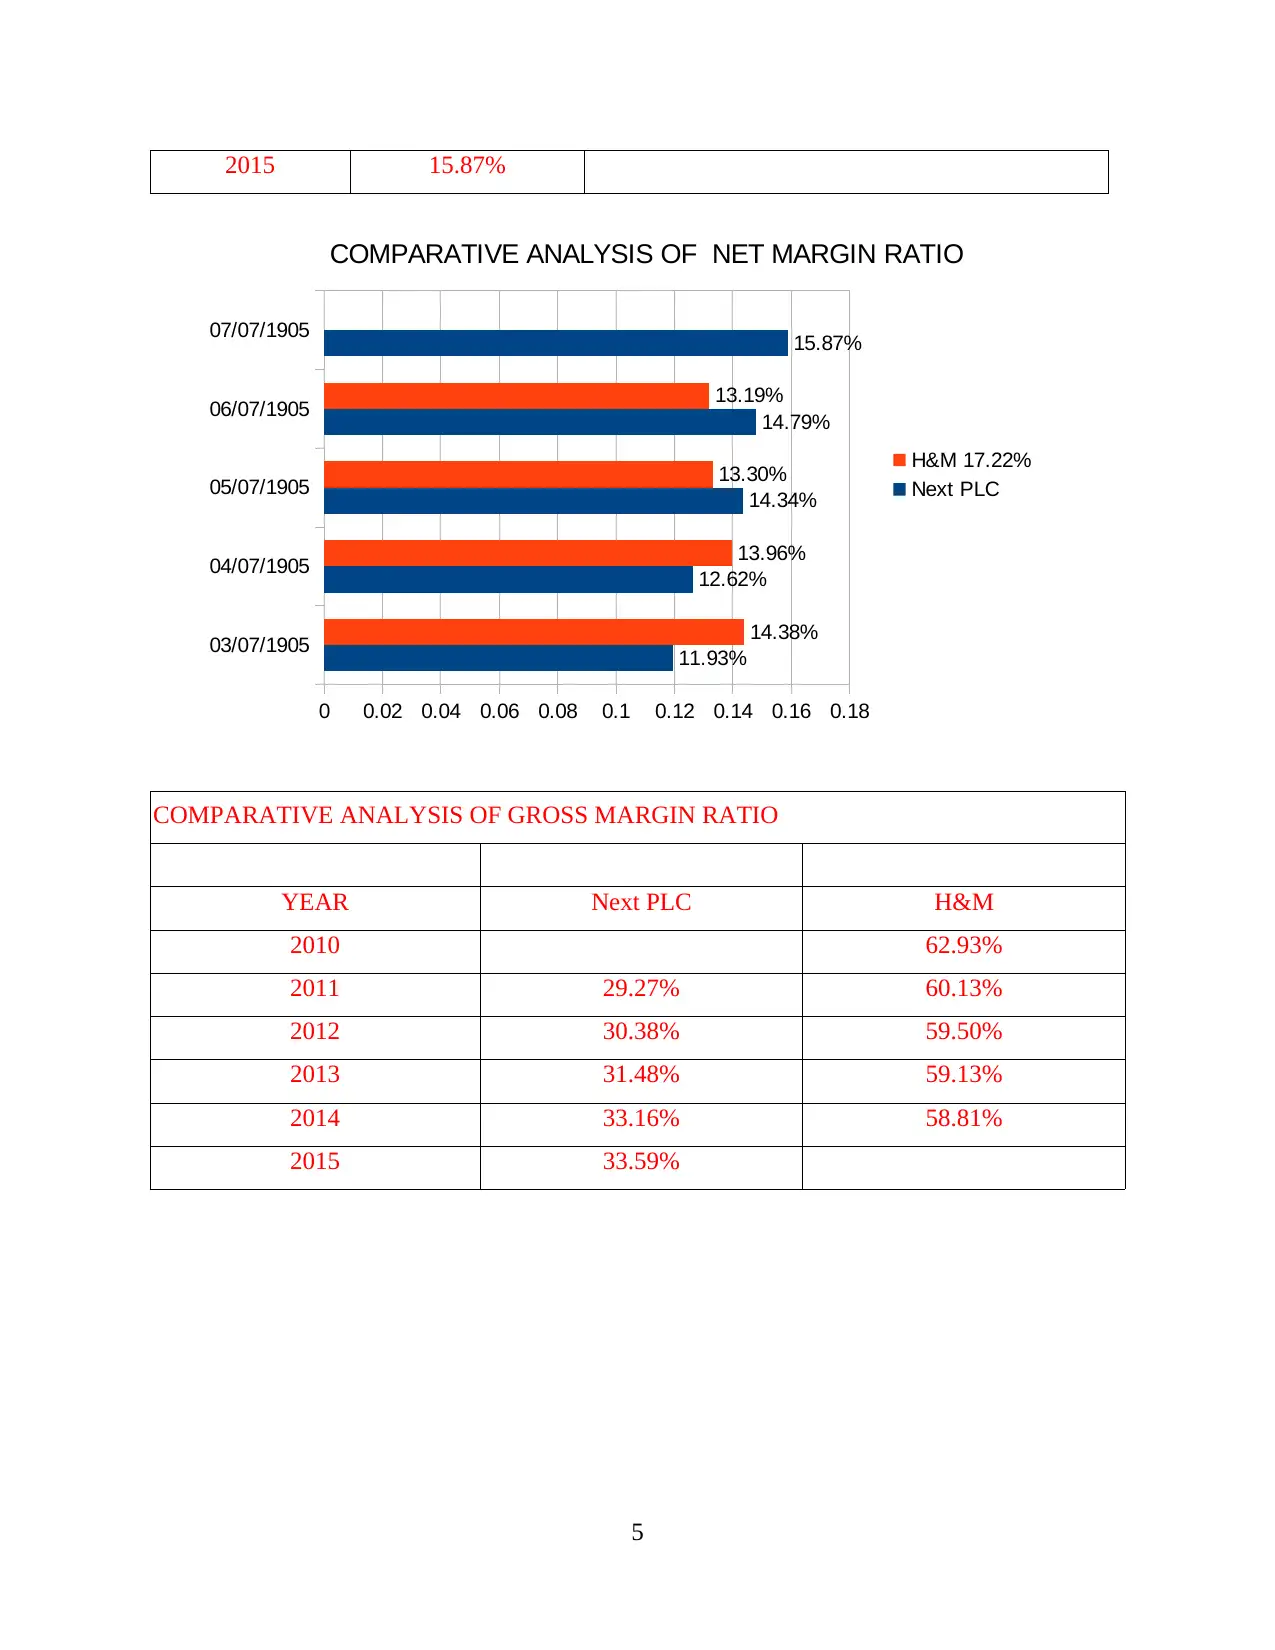
Gross profit ratio- It measures the total gross profit which is earned by the company on
its sales. The gross profit margin of Next Plc has considerably increased from 29.27% to
33.59% over the past five years which shows the company's greater extent to beat its
competitors. However, the ratio tends to decline in case of H&M from 62.93% to 58.81%
for the same time period which reflects a negative aspect on the mind of investors. Operating margin ratio- It measures the operating income of the company with its net
sales. The operating margin of Next Plc has significantly increased from 17.19% to
20.62% from 2011-2015. Conversely, the same has been declined in case of H&M from
22.73% to 16.90% for the same period. As a result, Next Plc generates sufficient money
through its existing operations in order to pay its fixed cost and the variable cost in
comparison to H&M (Tayles, Pike and Sofian, 2007).
Net profit margin- It compares the net income of the company with its net sales. It also
measures the company's overall management of expenses in relation to its net sales. Next
Plc is marked with increasing profit margin from 11.93% to 15.87% and H&M suffers
from declining profit margin from 17.22% to 13.19%. Consequently, Next Plc possesses
the ability to generate higher revenues by keeping its expenses low (Limitations of ratio
analysis, 2010).
The comparative analysis of profitability ratios of both the firms is explained with the
help of diagram-
COMPARATIVE ANALYSIS OF NET MARGIN RATIO
YEAR Next PLC H&M
2010 17.22%
2011 11.93% 14.38%
2012 12.62% 13.96%
2013 14.34% 13.30%
2014 14.79% 13.19%
4
companies make use of its profitability ratio to measure its business performance in the
competitive environment. It is broadly segmented into-
Gross profit ratio- It measures the total gross profit which is earned by the company on
its sales. The gross profit margin of Next Plc has considerably increased from 29.27% to
33.59% over the past five years which shows the company's greater extent to beat its
competitors. However, the ratio tends to decline in case of H&M from 62.93% to 58.81%
for the same time period which reflects a negative aspect on the mind of investors. Operating margin ratio- It measures the operating income of the company with its net
sales. The operating margin of Next Plc has significantly increased from 17.19% to
20.62% from 2011-2015. Conversely, the same has been declined in case of H&M from
22.73% to 16.90% for the same period. As a result, Next Plc generates sufficient money
through its existing operations in order to pay its fixed cost and the variable cost in
comparison to H&M (Tayles, Pike and Sofian, 2007).
Net profit margin- It compares the net income of the company with its net sales. It also
measures the company's overall management of expenses in relation to its net sales. Next
Plc is marked with increasing profit margin from 11.93% to 15.87% and H&M suffers
from declining profit margin from 17.22% to 13.19%. Consequently, Next Plc possesses
the ability to generate higher revenues by keeping its expenses low (Limitations of ratio
analysis, 2010).
The comparative analysis of profitability ratios of both the firms is explained with the
help of diagram-
COMPARATIVE ANALYSIS OF NET MARGIN RATIO
YEAR Next PLC H&M
2010 17.22%
2011 11.93% 14.38%
2012 12.62% 13.96%
2013 14.34% 13.30%
2014 14.79% 13.19%
4
⊘ This is a preview!⊘
Do you want full access?
Subscribe today to unlock all pages.
Trusted by 1+ million students worldwide
2015 15.87%
COMPARATIVE ANALYSIS OF GROSS MARGIN RATIO
YEAR Next PLC H&M
2010 62.93%
2011 29.27% 60.13%
2012 30.38% 59.50%
2013 31.48% 59.13%
2014 33.16% 58.81%
2015 33.59%
5
03/07/1905
04/07/1905
05/07/1905
06/07/1905
07/07/1905
0 0.02 0.04 0.06 0.08 0.1 0.12 0.14 0.16 0.18
11.93%
12.62%
14.34%
14.79%
15.87%
14.38%
13.96%
13.30%
13.19%
COMPARATIVE ANALYSIS OF NET MARGIN RATIO
H&M 17.22%
Next PLC
Paraphrase This Document
Need a fresh take? Get an instant paraphrase of this document with our AI Paraphraser
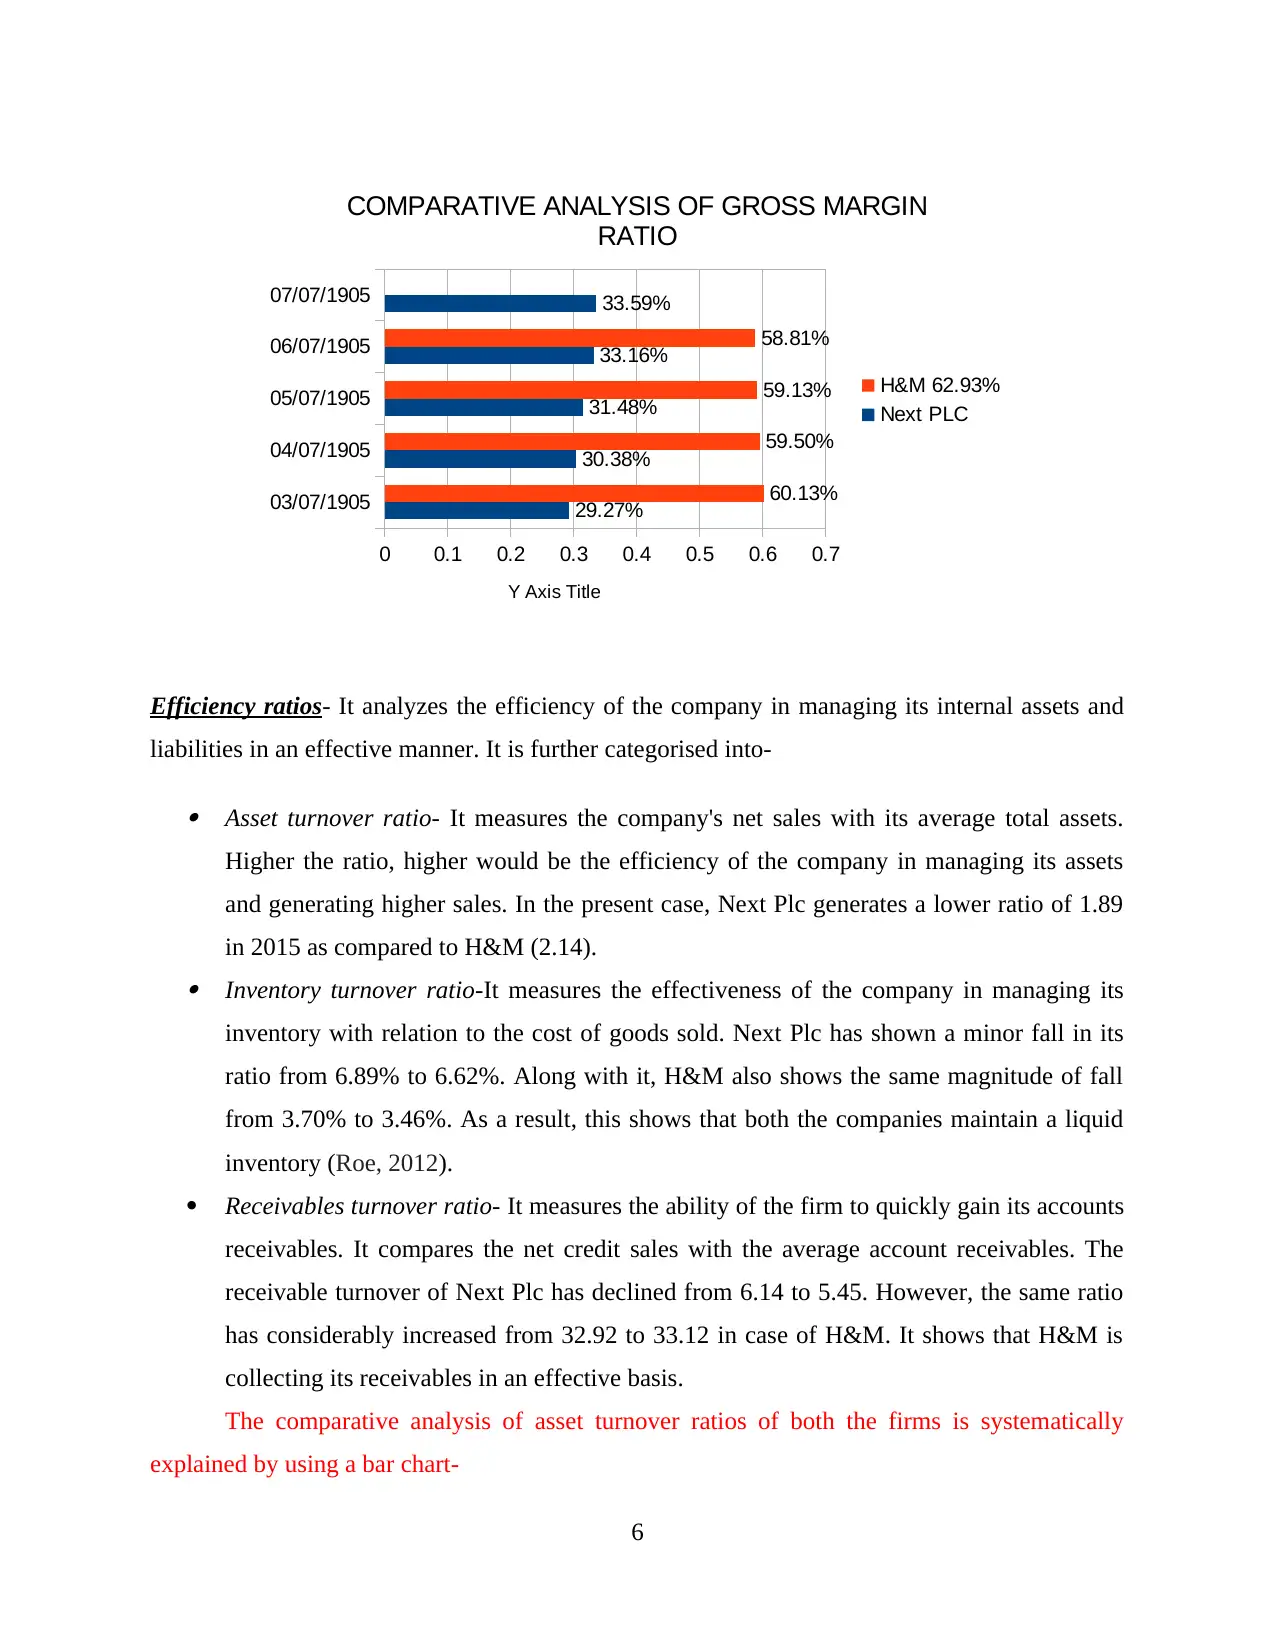
Efficiency ratios- It analyzes the efficiency of the company in managing its internal assets and
liabilities in an effective manner. It is further categorised into-
Asset turnover ratio- It measures the company's net sales with its average total assets.
Higher the ratio, higher would be the efficiency of the company in managing its assets
and generating higher sales. In the present case, Next Plc generates a lower ratio of 1.89
in 2015 as compared to H&M (2.14). Inventory turnover ratio-It measures the effectiveness of the company in managing its
inventory with relation to the cost of goods sold. Next Plc has shown a minor fall in its
ratio from 6.89% to 6.62%. Along with it, H&M also shows the same magnitude of fall
from 3.70% to 3.46%. As a result, this shows that both the companies maintain a liquid
inventory (Roe, 2012).
Receivables turnover ratio- It measures the ability of the firm to quickly gain its accounts
receivables. It compares the net credit sales with the average account receivables. The
receivable turnover of Next Plc has declined from 6.14 to 5.45. However, the same ratio
has considerably increased from 32.92 to 33.12 in case of H&M. It shows that H&M is
collecting its receivables in an effective basis.
The comparative analysis of asset turnover ratios of both the firms is systematically
explained by using a bar chart-
6
03/07/1905
04/07/1905
05/07/1905
06/07/1905
07/07/1905
0 0.1 0.2 0.3 0.4 0.5 0.6 0.7
29.27%
30.38%
31.48%
33.16%
33.59%
60.13%
59.50%
59.13%
58.81%
COMPARATIVE ANALYSIS OF GROSS MARGIN
RATIO
H&M 62.93%
Next PLC
Y Axis Title
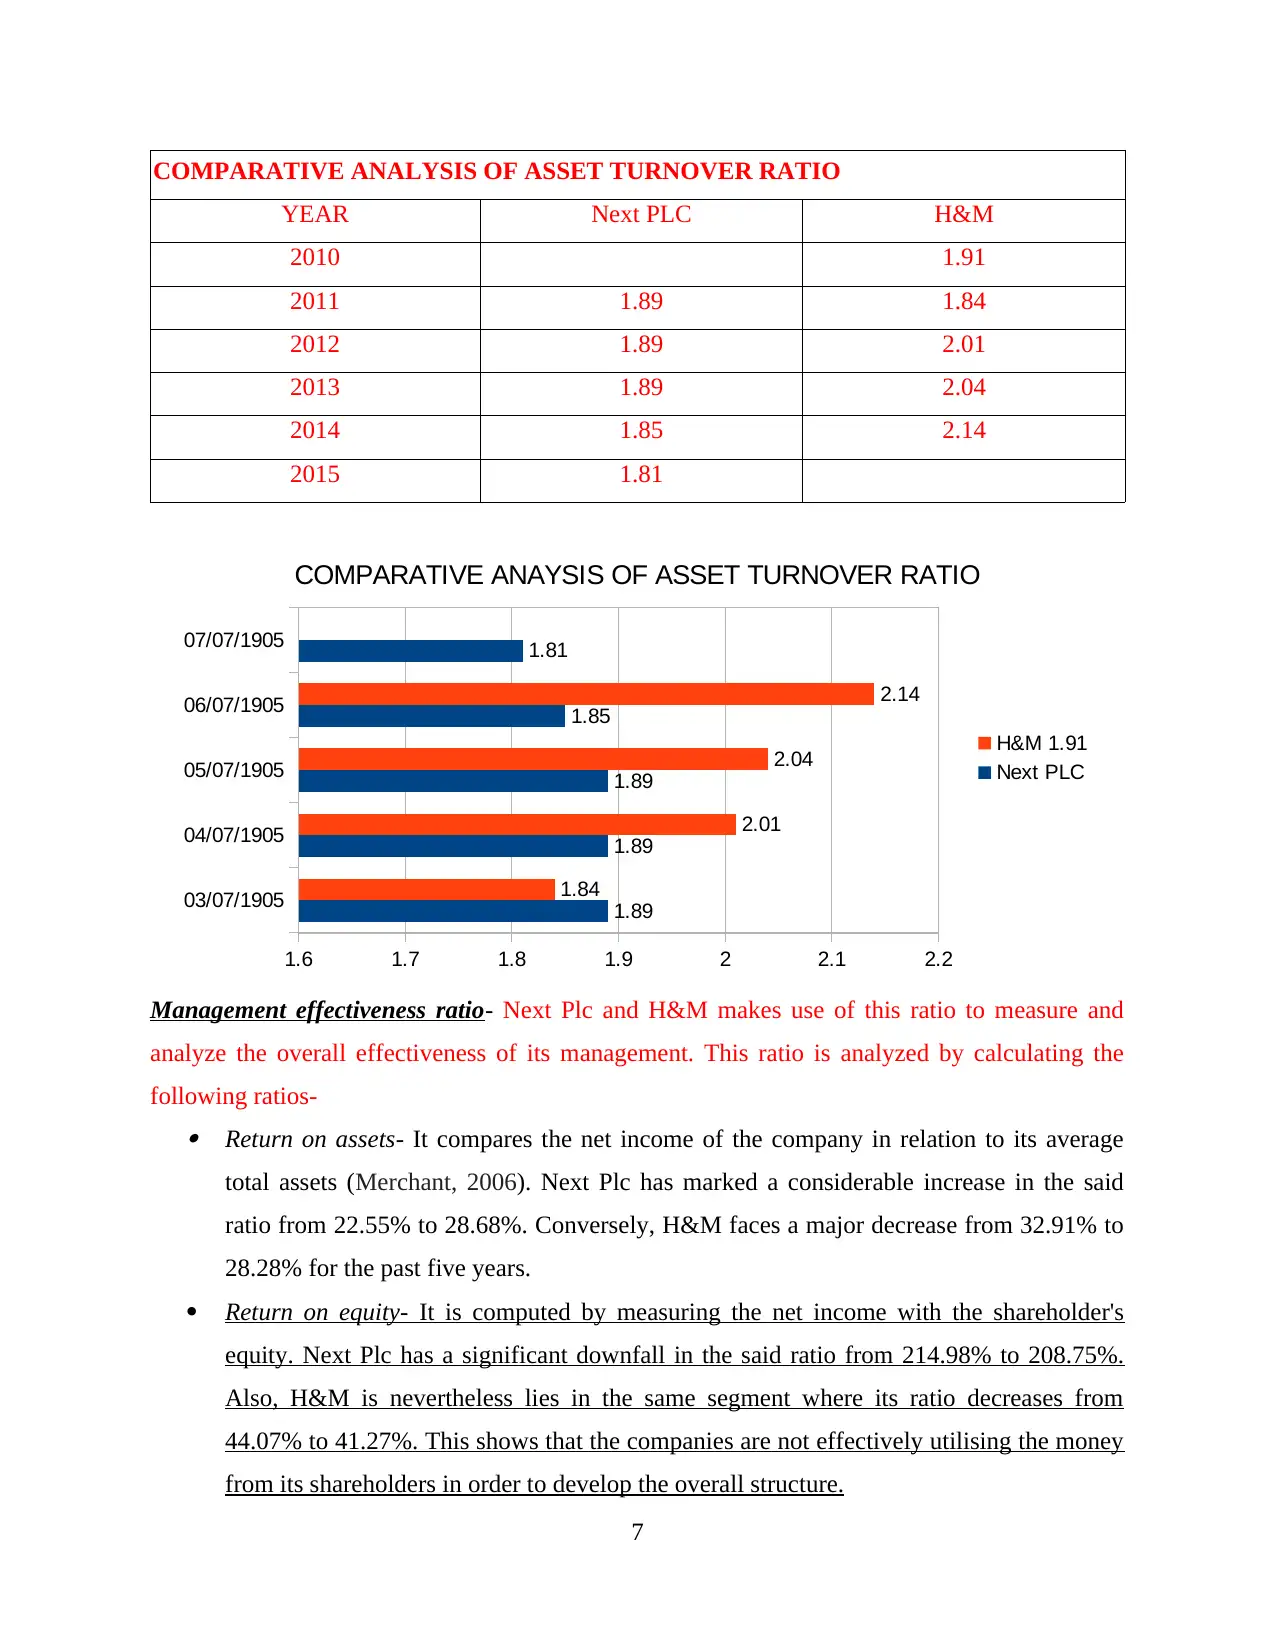
COMPARATIVE ANALYSIS OF ASSET TURNOVER RATIO
YEAR Next PLC H&M
2010 1.91
2011 1.89 1.84
2012 1.89 2.01
2013 1.89 2.04
2014 1.85 2.14
2015 1.81
Management effectiveness ratio- Next Plc and H&M makes use of this ratio to measure and
analyze the overall effectiveness of its management. This ratio is analyzed by calculating the
following ratios- Return on assets- It compares the net income of the company in relation to its average
total assets (Merchant, 2006). Next Plc has marked a considerable increase in the said
ratio from 22.55% to 28.68%. Conversely, H&M faces a major decrease from 32.91% to
28.28% for the past five years.
Return on equity- It is computed by measuring the net income with the shareholder's
equity. Next Plc has a significant downfall in the said ratio from 214.98% to 208.75%.
Also, H&M is nevertheless lies in the same segment where its ratio decreases from
44.07% to 41.27%. This shows that the companies are not effectively utilising the money
from its shareholders in order to develop the overall structure.
7
03/07/1905
04/07/1905
05/07/1905
06/07/1905
07/07/1905
1.6 1.7 1.8 1.9 2 2.1 2.2
1.89
1.89
1.89
1.85
1.81
1.84
2.01
2.04
2.14
COMPARATIVE ANAYSIS OF ASSET TURNOVER RATIO
H&M 1.91
Next PLC
⊘ This is a preview!⊘
Do you want full access?
Subscribe today to unlock all pages.
Trusted by 1+ million students worldwide
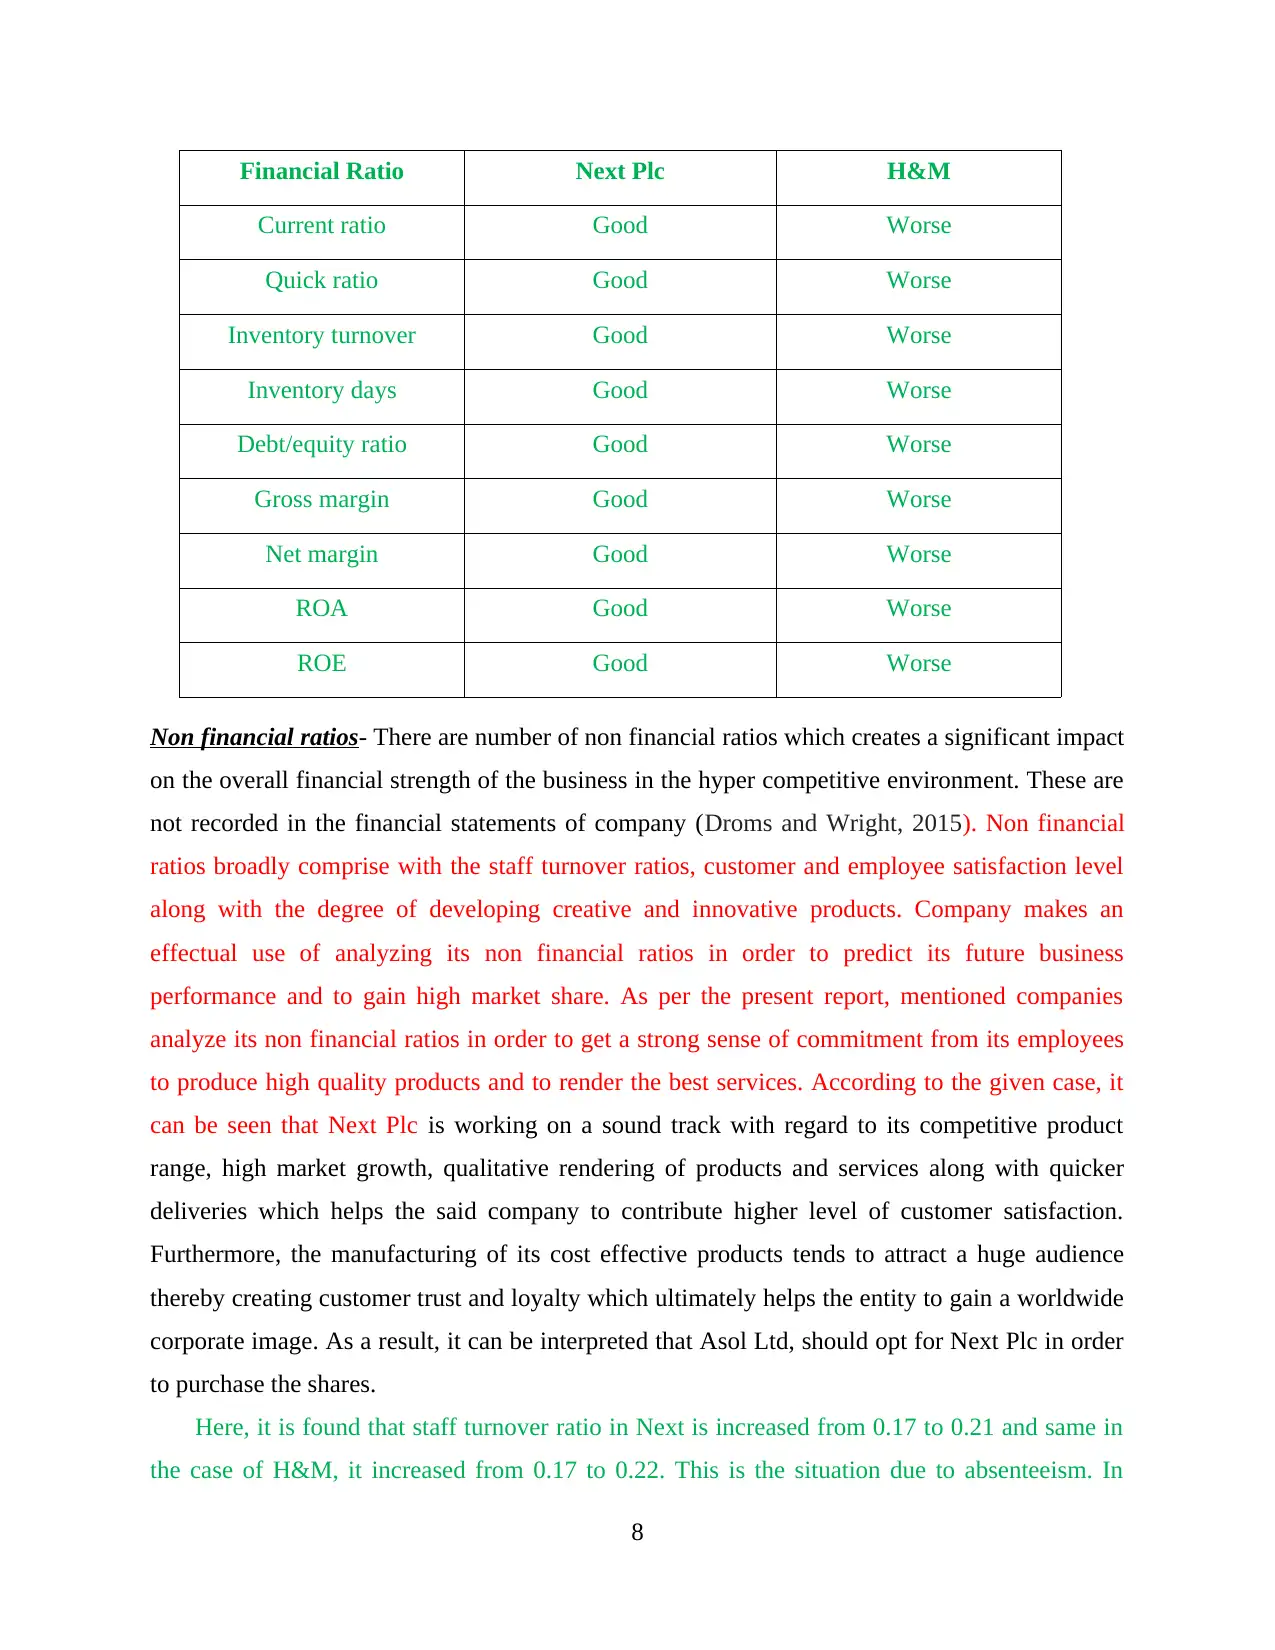
Financial Ratio Next Plc H&M
Current ratio Good Worse
Quick ratio Good Worse
Inventory turnover Good Worse
Inventory days Good Worse
Debt/equity ratio Good Worse
Gross margin Good Worse
Net margin Good Worse
ROA Good Worse
ROE Good Worse
Non financial ratios- There are number of non financial ratios which creates a significant impact
on the overall financial strength of the business in the hyper competitive environment. These are
not recorded in the financial statements of company (Droms and Wright, 2015). Non financial
ratios broadly comprise with the staff turnover ratios, customer and employee satisfaction level
along with the degree of developing creative and innovative products. Company makes an
effectual use of analyzing its non financial ratios in order to predict its future business
performance and to gain high market share. As per the present report, mentioned companies
analyze its non financial ratios in order to get a strong sense of commitment from its employees
to produce high quality products and to render the best services. According to the given case, it
can be seen that Next Plc is working on a sound track with regard to its competitive product
range, high market growth, qualitative rendering of products and services along with quicker
deliveries which helps the said company to contribute higher level of customer satisfaction.
Furthermore, the manufacturing of its cost effective products tends to attract a huge audience
thereby creating customer trust and loyalty which ultimately helps the entity to gain a worldwide
corporate image. As a result, it can be interpreted that Asol Ltd, should opt for Next Plc in order
to purchase the shares.
Here, it is found that staff turnover ratio in Next is increased from 0.17 to 0.21 and same in
the case of H&M, it increased from 0.17 to 0.22. This is the situation due to absenteeism. In
8
Paraphrase This Document
Need a fresh take? Get an instant paraphrase of this document with our AI Paraphraser
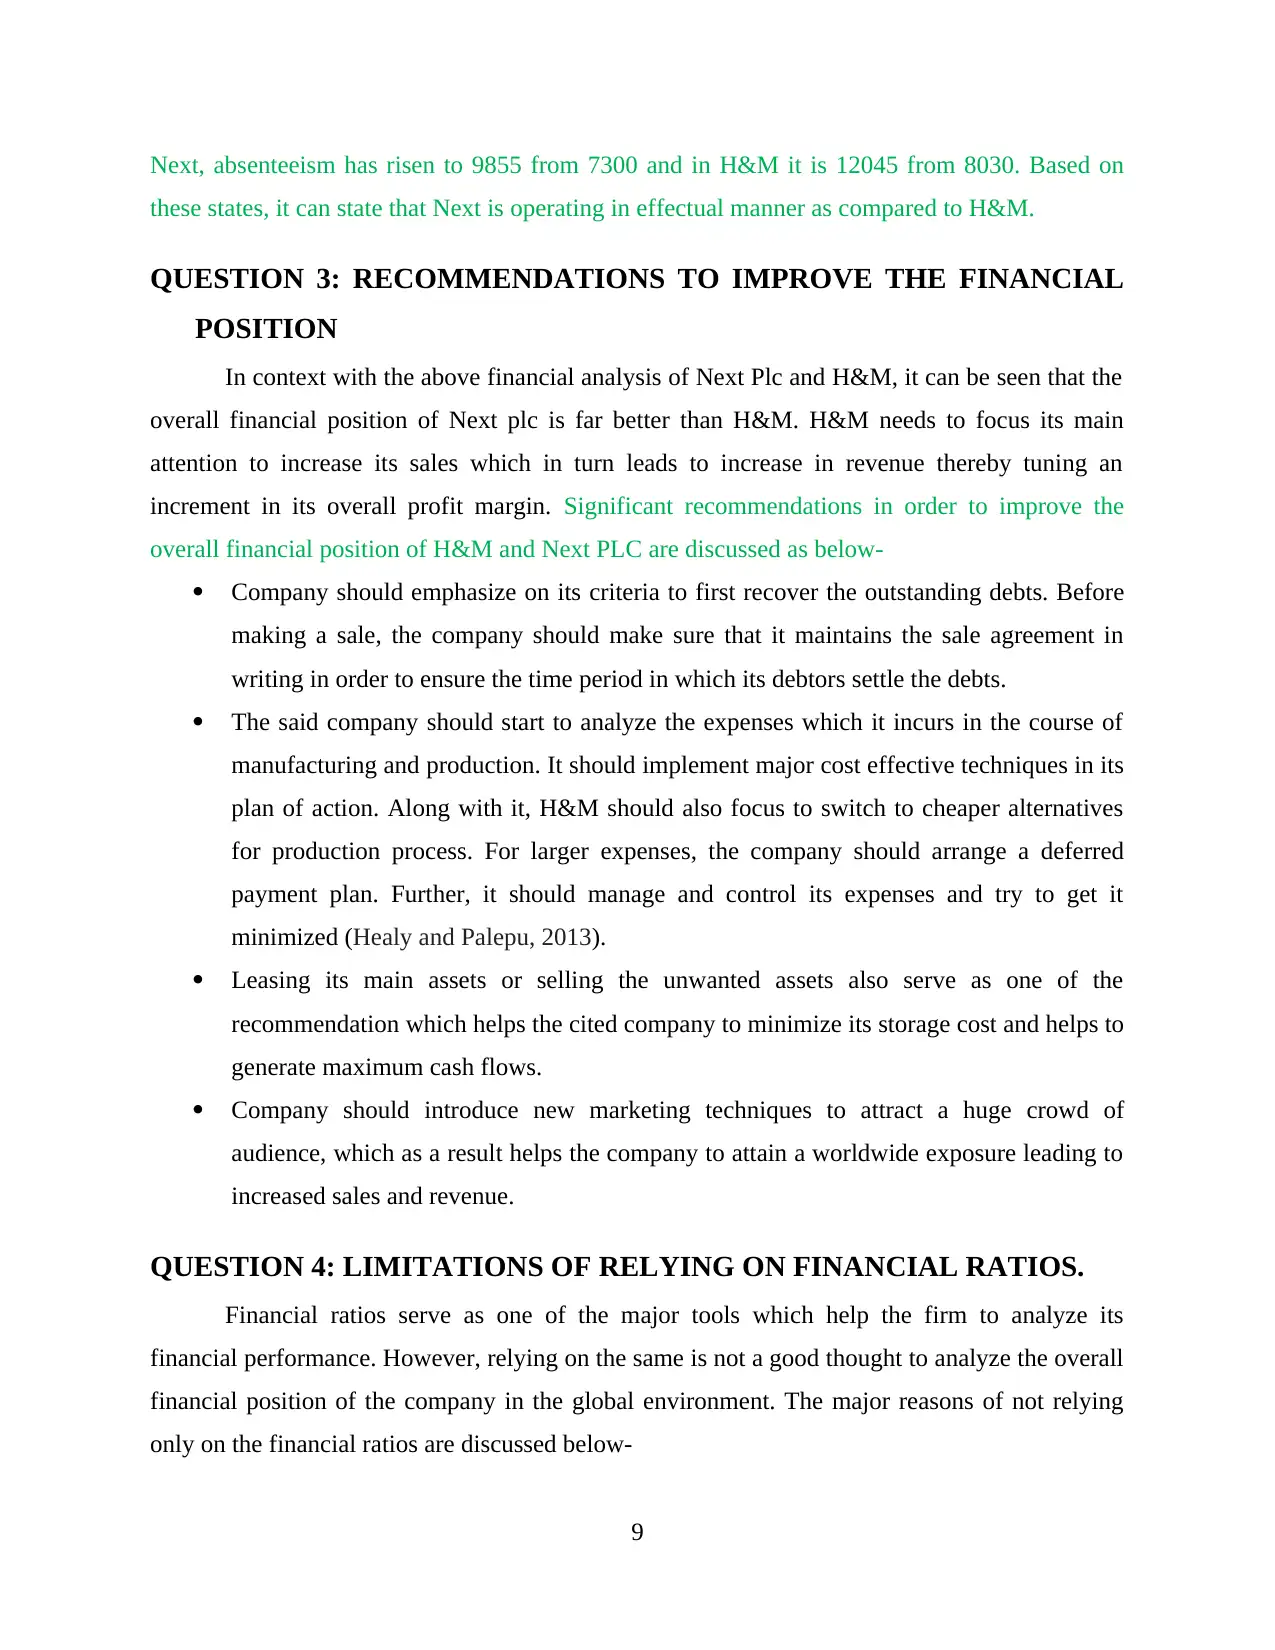
Next, absenteeism has risen to 9855 from 7300 and in H&M it is 12045 from 8030. Based on
these states, it can state that Next is operating in effectual manner as compared to H&M.
QUESTION 3: RECOMMENDATIONS TO IMPROVE THE FINANCIAL
POSITION
In context with the above financial analysis of Next Plc and H&M, it can be seen that the
overall financial position of Next plc is far better than H&M. H&M needs to focus its main
attention to increase its sales which in turn leads to increase in revenue thereby tuning an
increment in its overall profit margin. Significant recommendations in order to improve the
overall financial position of H&M and Next PLC are discussed as below-
Company should emphasize on its criteria to first recover the outstanding debts. Before
making a sale, the company should make sure that it maintains the sale agreement in
writing in order to ensure the time period in which its debtors settle the debts.
The said company should start to analyze the expenses which it incurs in the course of
manufacturing and production. It should implement major cost effective techniques in its
plan of action. Along with it, H&M should also focus to switch to cheaper alternatives
for production process. For larger expenses, the company should arrange a deferred
payment plan. Further, it should manage and control its expenses and try to get it
minimized (Healy and Palepu, 2013).
Leasing its main assets or selling the unwanted assets also serve as one of the
recommendation which helps the cited company to minimize its storage cost and helps to
generate maximum cash flows.
Company should introduce new marketing techniques to attract a huge crowd of
audience, which as a result helps the company to attain a worldwide exposure leading to
increased sales and revenue.
QUESTION 4: LIMITATIONS OF RELYING ON FINANCIAL RATIOS.
Financial ratios serve as one of the major tools which help the firm to analyze its
financial performance. However, relying on the same is not a good thought to analyze the overall
financial position of the company in the global environment. The major reasons of not relying
only on the financial ratios are discussed below-
9
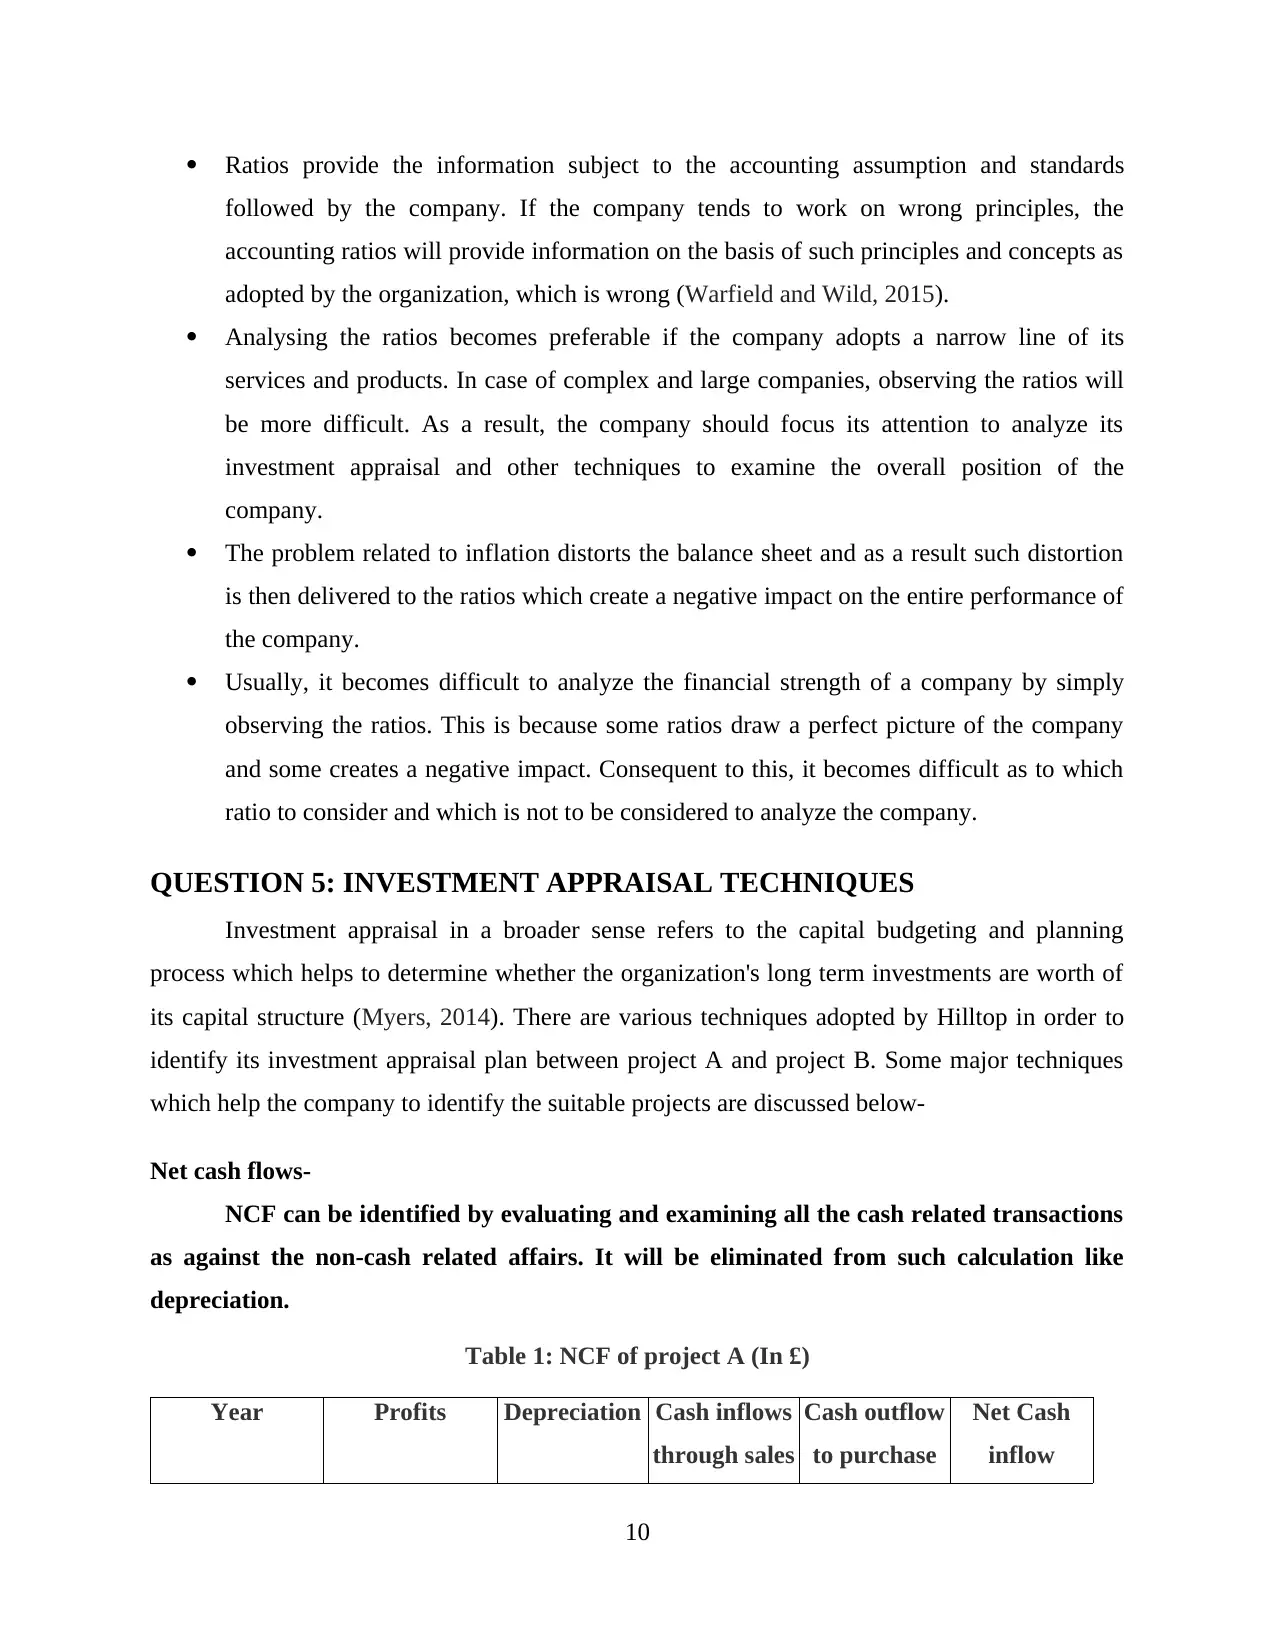
Ratios provide the information subject to the accounting assumption and standards
followed by the company. If the company tends to work on wrong principles, the
accounting ratios will provide information on the basis of such principles and concepts as
adopted by the organization, which is wrong (Warfield and Wild, 2015).
Analysing the ratios becomes preferable if the company adopts a narrow line of its
services and products. In case of complex and large companies, observing the ratios will
be more difficult. As a result, the company should focus its attention to analyze its
investment appraisal and other techniques to examine the overall position of the
company.
The problem related to inflation distorts the balance sheet and as a result such distortion
is then delivered to the ratios which create a negative impact on the entire performance of
the company.
Usually, it becomes difficult to analyze the financial strength of a company by simply
observing the ratios. This is because some ratios draw a perfect picture of the company
and some creates a negative impact. Consequent to this, it becomes difficult as to which
ratio to consider and which is not to be considered to analyze the company.
QUESTION 5: INVESTMENT APPRAISAL TECHNIQUES
Investment appraisal in a broader sense refers to the capital budgeting and planning
process which helps to determine whether the organization's long term investments are worth of
its capital structure (Myers, 2014). There are various techniques adopted by Hilltop in order to
identify its investment appraisal plan between project A and project B. Some major techniques
which help the company to identify the suitable projects are discussed below-
Net cash flows-
NCF can be identified by evaluating and examining all the cash related transactions
as against the non-cash related affairs. It will be eliminated from such calculation like
depreciation.
Table 1: NCF of project A (In £)
Year Profits Depreciation Cash inflows
through sales
Cash outflow
to purchase
Net Cash
inflow
10
⊘ This is a preview!⊘
Do you want full access?
Subscribe today to unlock all pages.
Trusted by 1+ million students worldwide
1 out of 17
Related Documents


Your All-in-One AI-Powered Toolkit for Academic Success.
+13062052269
info@desklib.com
Available 24*7 on WhatsApp / Email
![[object Object]](/_next/static/media/star-bottom.7253800d.svg)
Unlock your academic potential
Copyright © 2020–2026 A2Z Services. All Rights Reserved. Developed and managed by ZUCOL.