Accounting and Finance Report: Financial Analysis of Three Companies

Verified

Added on  2023/01/04

|17
|3751
|35
Report
AI Summary
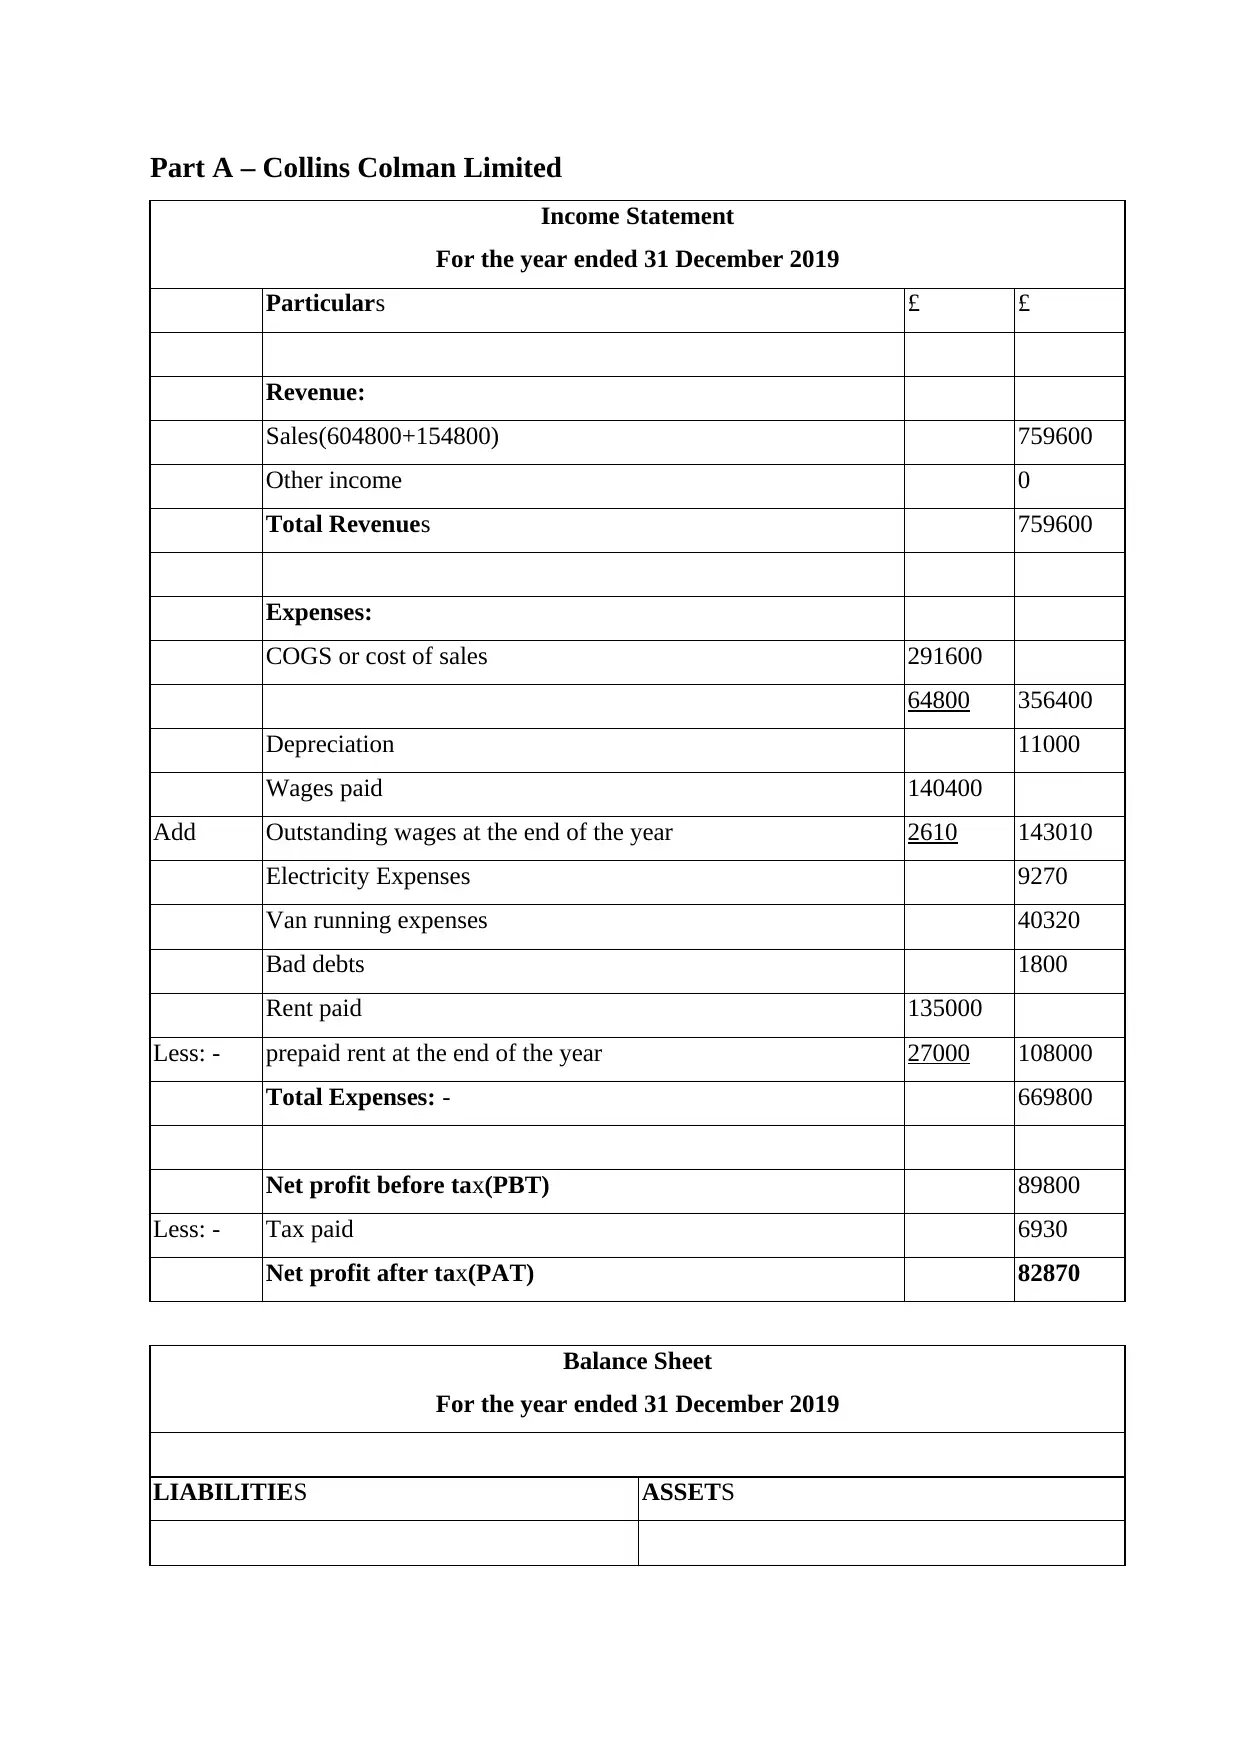
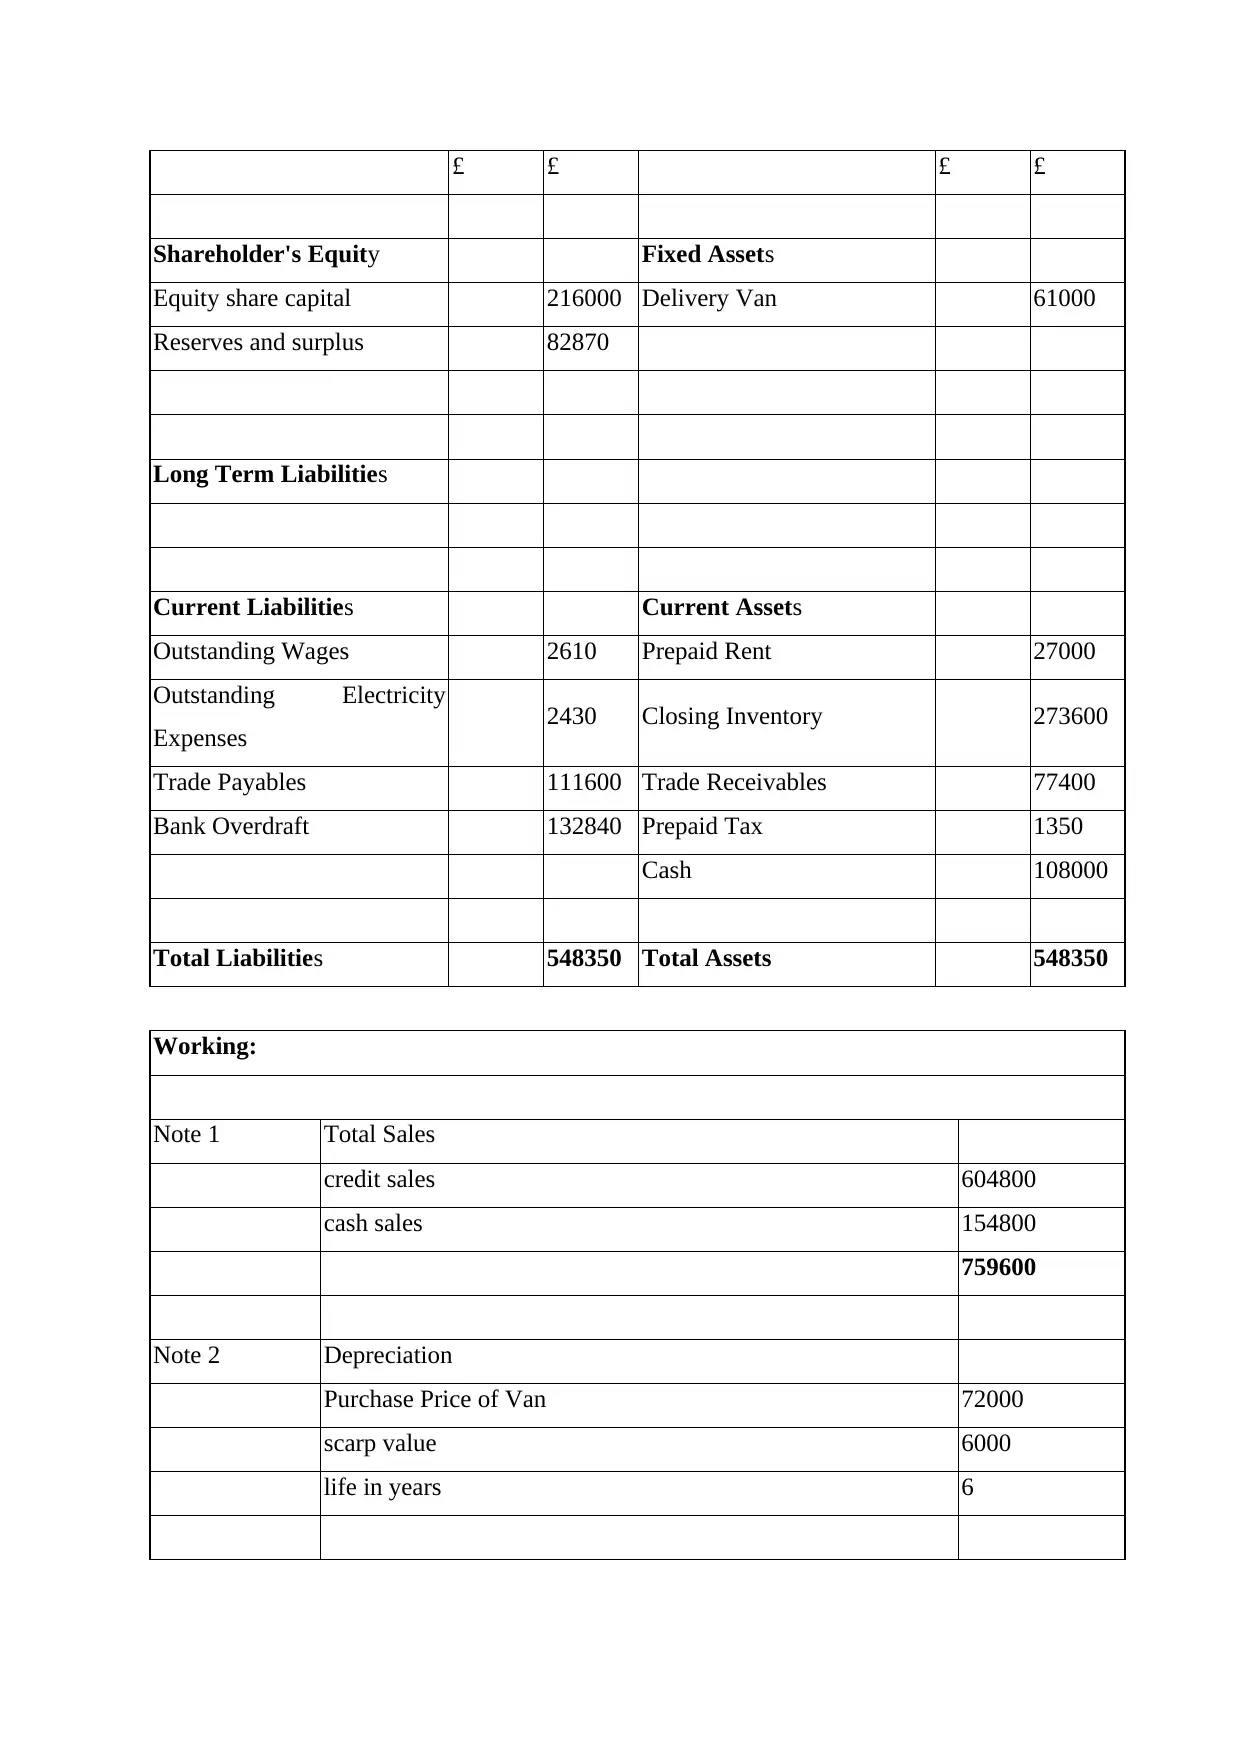
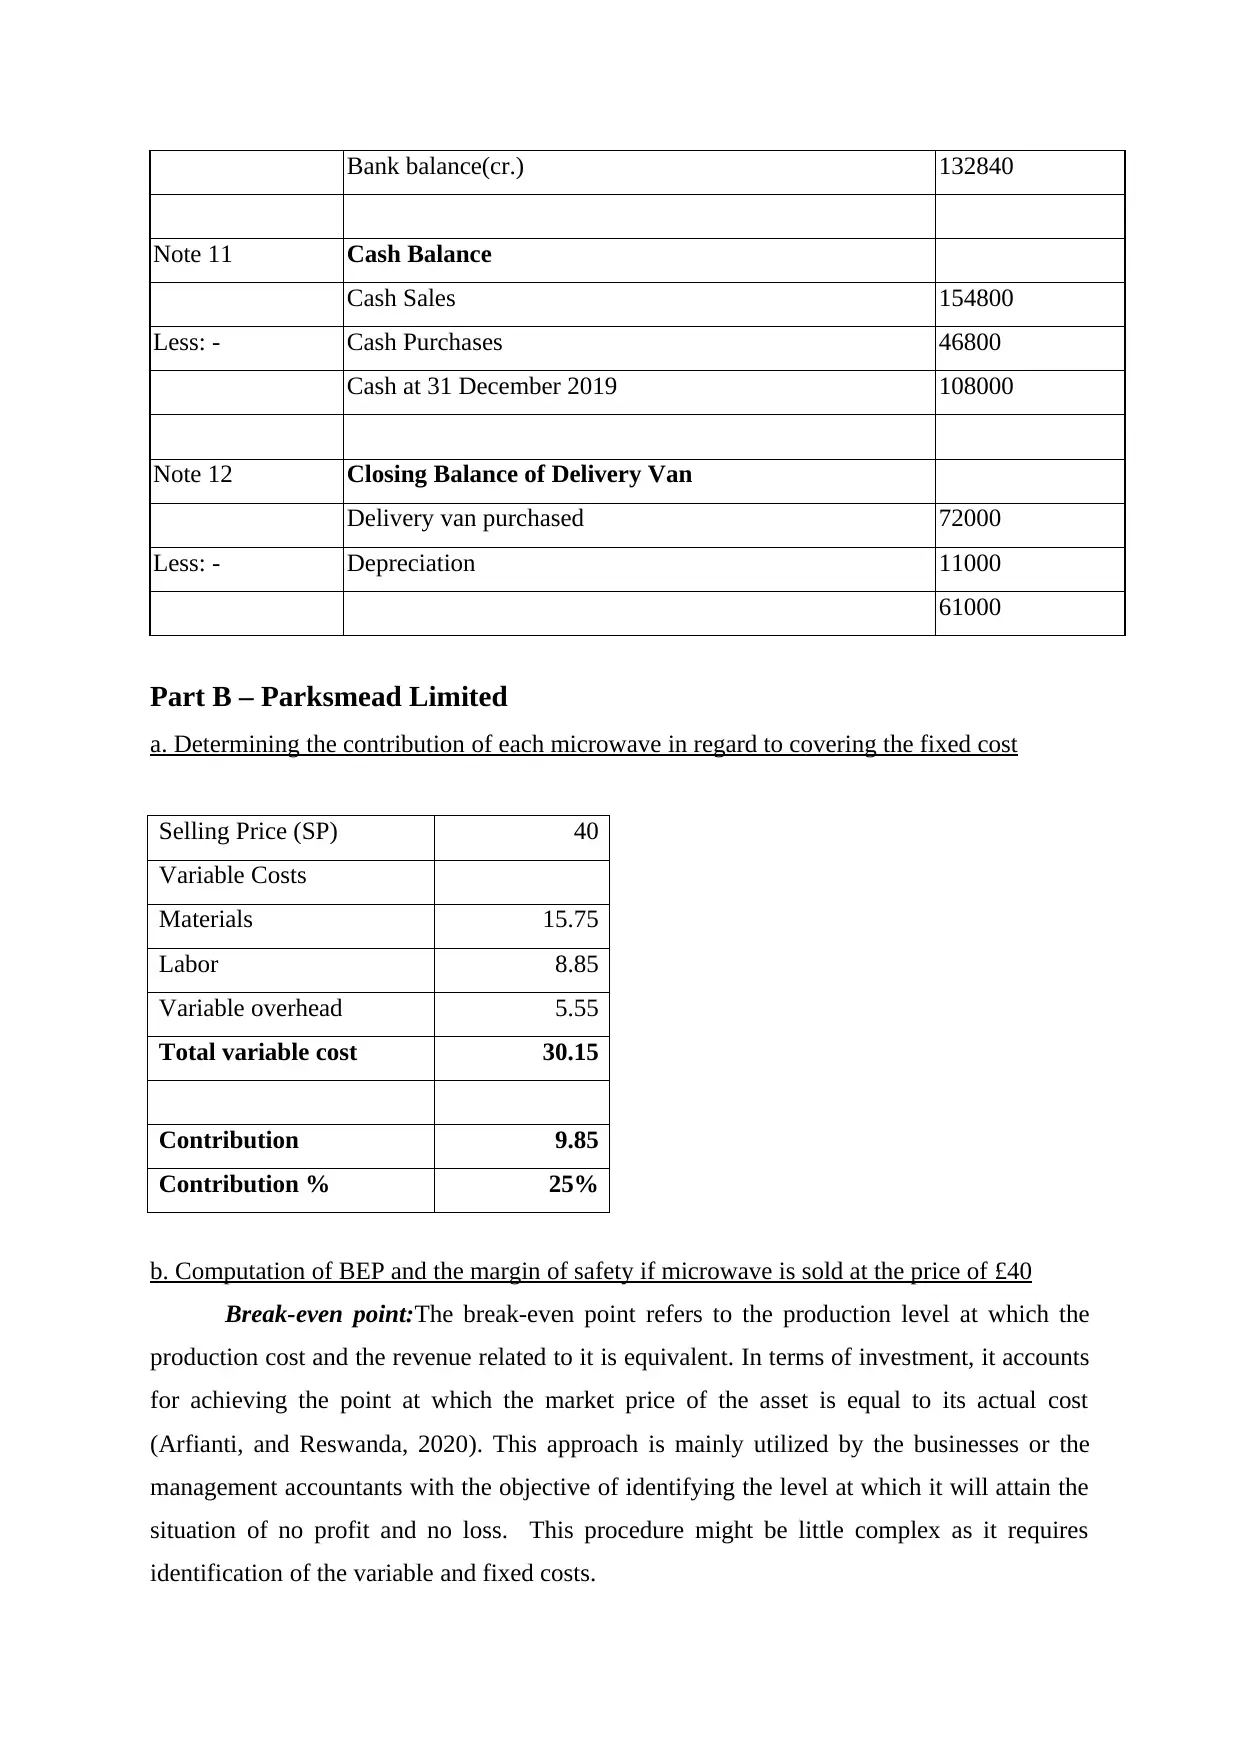
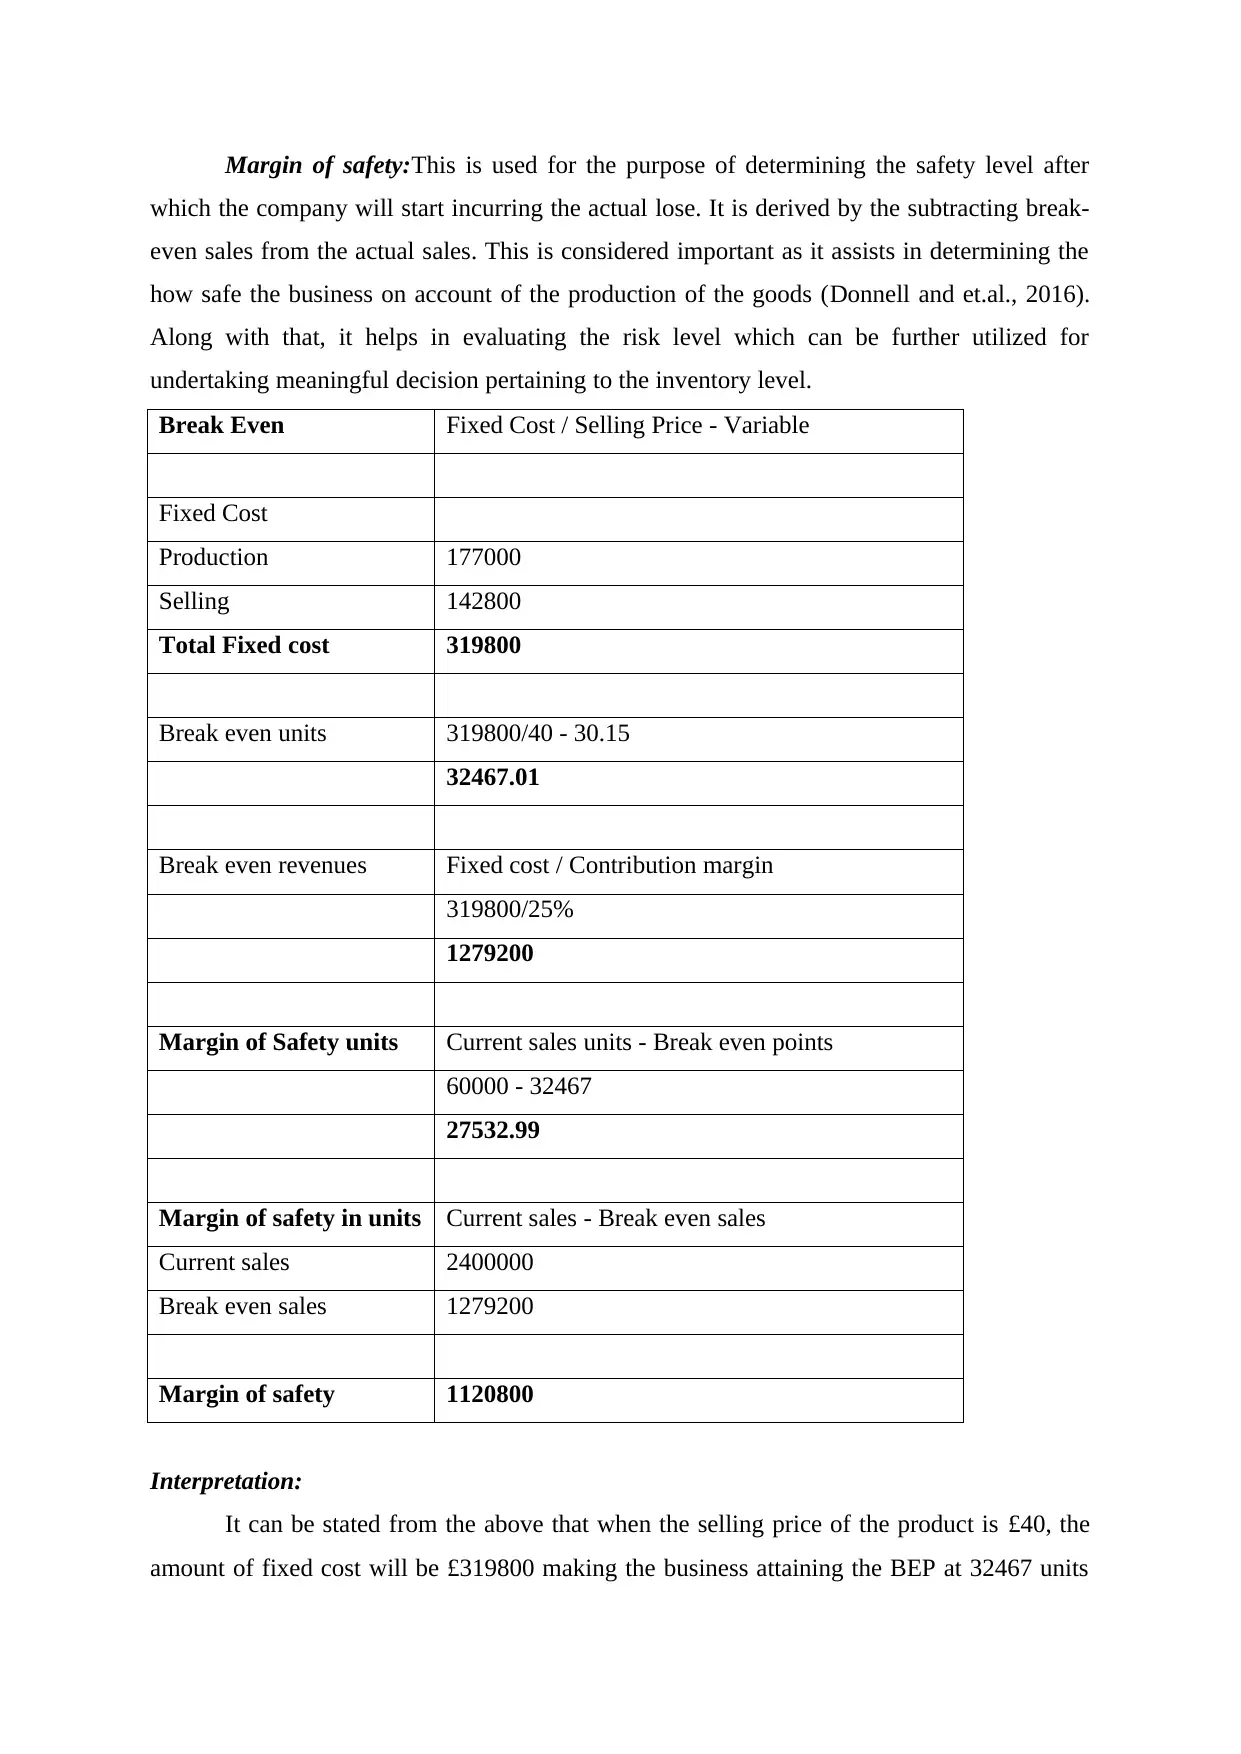
This report provides a comprehensive analysis of financial statements and investment appraisal techniques, focusing on three companies: Collins Colman Limited, Parksmead Limited, and Skipsey Clifford Plc. Part A examines Collins Colman's income statement and balance sheet for 2019, including detailed workings for key figures like sales, depreciation, and tax computation. Part B delves into Parksmead Limited, calculating the contribution margin, break-even point, margin of safety, and profitability analysis, and evaluating the impact of a new sales strategy. Part C analyzes Skipsey Clifford Plc, computing the payback period, accounting rate of return (ARR), and net present value (NPV) of a proposed project, along with a discussion of the merits and demerits of different investment appraisal techniques. The report offers a detailed breakdown of financial calculations and their interpretations, providing insights into financial performance and investment decision-making.
Document Page
Introduction to Accounting and
Finance
tabler-icon-diamond-filled.svg

Paraphrase This Document

Need a fresh take? Get an instant paraphrase of this document with our AI Paraphraser
Document Page
Table of Contents
Part A – Collins Colman Limited...............................................................................................3
Part B – Parksmead Limited......................................................................................................7
a. Determining the contribution of each microwave in regard to covering the fixed cost.....7
b. Computation of BEP and the margin of safety if microwave is sold at the price of £40...7
c. Computation of profit that Parks mead Ltd would make by selling 60000 units of
microwaves at the price of £40..............................................................................................9
d. Determining and analysing the new strategy of Parksmead Ltd........................................9
e. Underpinning assumptions attached to the BEP model...................................................10
Part C – Skipsey Clifford Plc...................................................................................................11
a. Computing payback, ARR, and NPV of the firm.............................................................11
REFERENCES.........................................................................................................................14
Document Page
Part A – Collins Colman Limited
Income Statement
For the year ended 31 December 2019
Particulars £ £
Revenue:
Sales(604800+154800) 759600
Other income 0
Total Revenues 759600
Expenses:
COGS or cost of sales 291600
64800 356400
Depreciation 11000
Wages paid 140400
Add Outstanding wages at the end of the year 2610 143010
Electricity Expenses 9270
Van running expenses 40320
Bad debts 1800
Rent paid 135000
Less: - prepaid rent at the end of the year 27000 108000
Total Expenses: - 669800
Net profit before tax(PBT) 89800
Less: - Tax paid 6930
Net profit after tax(PAT) 82870
Balance Sheet
For the year ended 31 December 2019
LIABILITIES ASSETS
Document Page
£ £ £ £
Shareholder's Equity Fixed Assets
Equity share capital 216000 Delivery Van 61000
Reserves and surplus 82870
Long Term Liabilities
Current Liabilities Current Assets
Outstanding Wages 2610 Prepaid Rent 27000
Outstanding Electricity
Expenses 2430 Closing Inventory 273600
Trade Payables 111600 Trade Receivables 77400
Bank Overdraft 132840 Prepaid Tax 1350
Cash 108000
Total Liabilities 548350 Total Assets 548350
Working:
Note 1 Total Sales
credit sales 604800
cash sales 154800
759600
Note 2 Depreciation
Purchase Price of Van 72000
scarp value 6000
life in years 6
tabler-icon-diamond-filled.svg

Paraphrase This Document

Need a fresh take? Get an instant paraphrase of this document with our AI Paraphraser
Document Page
Depreciation 11000
Note 3 Tax Computation
Tax up to 31 march 2019 2880
Add: - Tax from 1 April 2019 to 31 march 2020 5400
Less: - Prepaid tax of 3 months(from 1january 2020 to 31 march
2020) 1350
6930
Note 4 Electricity Expenses:
Expenses paid 6840
Add: - Outstanding expenses at the end of the year 2430
9270
Workings:
Note 5 Reserves and surplus
Net profit after tax 82870
Note 6 Trade Payables
Credit Purchases 583200
Less: - Payment to Trade Payables 471600
111600
Note 7 Trade Receivables
Credit Sales 604800
Receipts from Trade Receivables 525600
Closing Trade Receivables 79200
Bad Debts 1800
Net Trade Receivables 77400
Document Page
Note 8 Prepaid Rent of 3 Months
Annual Rent 108000
Rent Per month 9000
Rent For 3 months 27000
Note 9 Closing Inventory
Cost of credit sales 291600
Add: - Cost of cash sales 64800
Total Cost of sales 356400
Credit Purchases 583200
Cash Purchases 46800
Total Purchases 630000
Less: - Total Cost of sales 356400
Closing Inventory 273600
Note 10 Closing Bank balance
Issue of Equity 216000
Receipts from Trade Receivables 525600
Total Receipts 741600
Less: - Rent paid 135000
Tax paid(2880+5400) 8280
Delivery van purchased 72000
Wages paid 140400
Electricity Expenses 6840
Payment to Trade Payables 471600
Van running expenses paid 40320
Total Payments 874440
Document Page
Bank balance(cr.) 132840
Note 11 Cash Balance
Cash Sales 154800
Less: - Cash Purchases 46800
Cash at 31 December 2019 108000
Note 12 Closing Balance of Delivery Van
Delivery van purchased 72000
Less: - Depreciation 11000
61000
Part B – Parksmead Limited
a. Determining the contribution of each microwave in regard to covering the fixed cost
Selling Price (SP) 40
Variable Costs
Materials 15.75
Labor 8.85
Variable overhead 5.55
Total variable cost 30.15
Contribution 9.85
Contribution % 25%
b. Computation of BEP and the margin of safety if microwave is sold at the price of £40
Break-even point:The break-even point refers to the production level at which the
production cost and the revenue related to it is equivalent. In terms of investment, it accounts
for achieving the point at which the market price of the asset is equal to its actual cost
(Arfianti, and Reswanda, 2020). This approach is mainly utilized by the businesses or the
management accountants with the objective of identifying the level at which it will attain the
situation of no profit and no loss. This procedure might be little complex as it requires
identification of the variable and fixed costs.
tabler-icon-diamond-filled.svg

Paraphrase This Document

Need a fresh take? Get an instant paraphrase of this document with our AI Paraphraser
Document Page
Margin of safety:This is used for the purpose of determining the safety level after
which the company will start incurring the actual lose. It is derived by the subtracting break-
even sales from the actual sales. This is considered important as it assists in determining the
how safe the business on account of the production of the goods (Donnell and et.al., 2016).
Along with that, it helps in evaluating the risk level which can be further utilized for
undertaking meaningful decision pertaining to the inventory level.
Break Even Fixed Cost / Selling Price - Variable
Fixed Cost
Production 177000
Selling 142800
Total Fixed cost 319800
Break even units 319800/40 - 30.15
32467.01
Break even revenues Fixed cost / Contribution margin
319800/25%
1279200
Margin of Safety units Current sales units - Break even points
60000 - 32467
27532.99
Margin of safety in units Current sales - Break even sales
Current sales 2400000
Break even sales 1279200
Margin of safety 1120800
Interpretation:
It can be stated from the above that when the selling price of the product is £40, the
amount of fixed cost will be £319800 making the business attaining the BEP at 32467 units
Document Page
which approximately amounted to the £1279200. Apart from this, the amount f margin of
safety is computed to be £1120800 with the units of 275333. This indicates that if the revenue
drops below this level then will cause the situation of incurring loss. Thus, margin of safety is
considered as an important tool for a business entity as it helps in identifying the situation of
risk so that actions can be taken on time.
c. Computation of profit that Parks mead Ltd would make by selling 60000 units of
microwaves at the price of £40
Calculation of Profits
Units 60000
Sales 40 2400000
Variable Cost
Materials 15.75 945000
Labor 8.85 531000
Variable overhead 5.55 333000
Contribution 591000
Fixed Cost
Production 177000
Selling cost etc. 142800
Profit 271200
Interpretation:
It can be seen that by producing and selling the entire 60000 units of the product at
the selling price of £40, this is result into the profits of £271200 which includes the amount of
contribution be to £591000.
d. Determining and analysing the new strategy of Parksmead Ltd
Details provided:
Selling price rises by 8%
Selling units rises by 15%
New Strategy Existing New
Document Page
Increase in sales price 8% 40 43.20
Increase in sales unit 15% 60000 69000
Computation of Profits
Units 69000
Sales 40 2760000
Variable Cost
Materials 15.75 1086750
Labor 8.85 610650
Variable overhead 5.55 382950
Contribution 679650
Advertising 135000
Fixed Cost
Production 177000
Selling cost etc. 142800
Profit 224850
Interpretation:
It can be inferred from the above that the company should not implement the new
strategy as this has resulted into decline in the profits of the company. Therefore, it is highly
preferable for the firm to not proceed with this strategy which has impacted its profitability.
On the flip side, it will help building brand image in long term.
e. Underpinning assumptions attached to the BEP model
The break-even analysis is of essential significance to the business association in
regard to deciding the pertinence of its cost capacities in the actual business practices. It
assists in determining the dynamic qualities along with the current expense and the business’s
sales volume. This investigation depends on specific suspicions which are expressed
underneath.
It depends on the fixed and the variable expense and doesn't contemplate the semi-
variable expense.
Both the expense and the business stay straight.
tabler-icon-diamond-filled.svg

Paraphrase This Document

Need a fresh take? Get an instant paraphrase of this document with our AI Paraphraser
Document Page
It is accepted that the cost of the item will stay consistent under any degree of
production.
Also, the volume of the itemsproduced and the deals will be equivalent.
The fixed cost will stay consistent under the specific degree or to the certain limit of
production.
It is additionally expected that the technological change and any improvement in the
proficiency of the labour will be consistent.
The cost of the product is expected to stay steady.
In the circumstance of the different item, the product mixwill be considered as
constant.
The BEP analysisis mainly used by manufacturing organizations. It will help the
business association regardless of nature, occupation, field or size in deciding where it will
accomplish the circumstance of no benefit no loss (Batkovskiy and et.al., 2017). It
additionally bolsters the organizations in deciding the offering price of the item to accomplish
greatest benefit. It must be utilized if the association is having cost bifurcated into fixed and
variable as these are significant in for determining the contribution and afterward the BEP
also. Along these lines, this is helpful in each kind of business association which helps in
taking significant business choices to achieve the objectives all the more viably.
Part C – Skipsey Clifford Plc
a. Computing payback, ARR, and NPV of the firm
Years
Annual
cash
inflow (in
£)
Annual
cash
outflow
(in £)
less:
Deprecia
tion (in
£)
Total
annual
cash
inflow
(in £)
Add:
Depreciati
on (in £)
Cash
inflows
after
deprecia
tion (in
£)
Add:
Scrap
value (in
£)
Net cash
inflow
(in £)
1 3400000 1280000 1400000 720000 1400000 2120000 2120000
2 3400000 1280000 1400000 720000 1400000 2120000 2120000
3 3400000 1280000 1400000 720000 1400000 2120000 2120000
4 3400000 1280000 1400000 720000 1400000 2120000 2120000
5 3400000 1280000 1400000 720000 1400000 2120000 1000000 3120000
Payback period
Document Page
Years Net cash inflow (in £) Cumulative cash inflows
(in £)
1 2120000 2120000
2 2120000 4240000
3 2120000 6360000
4 2120000 8480000
5 3120000 11600000
Payback period (PBP) 3
0.8
[(8000000-6360000)/21200
00]
PBP 3.8 years
Interpretation:
It can be concluded from the above that the shortest period in which the company will
recover the amount invested initially is 3.8 years which results into making the project
economically feasible for making an investment (Zis and et.al., 2016). Thus, the company
must go with the investment.
Average rate of return
Years Earnings after taxes
1 2120000
2 2120000
3 2120000
4 2120000
5 3120000
Average earnings 2320000
Average investment 4050000
ARR 57.28%
Interpretation:
The ARR derived from the above is 57.28% which is the return that the company
would be earning from this project (Magni, 2016). This rate is much more than the cost of
chevron_up_icon
1 out of 17
circle_padding
hide_on_mobile
zoom_out_icon
[object Object]