University Financial Analysis Report: Tabcorp Holdings Limited
VerifiedAdded on 2023/02/01
|7
|1439
|68
Report
AI Summary
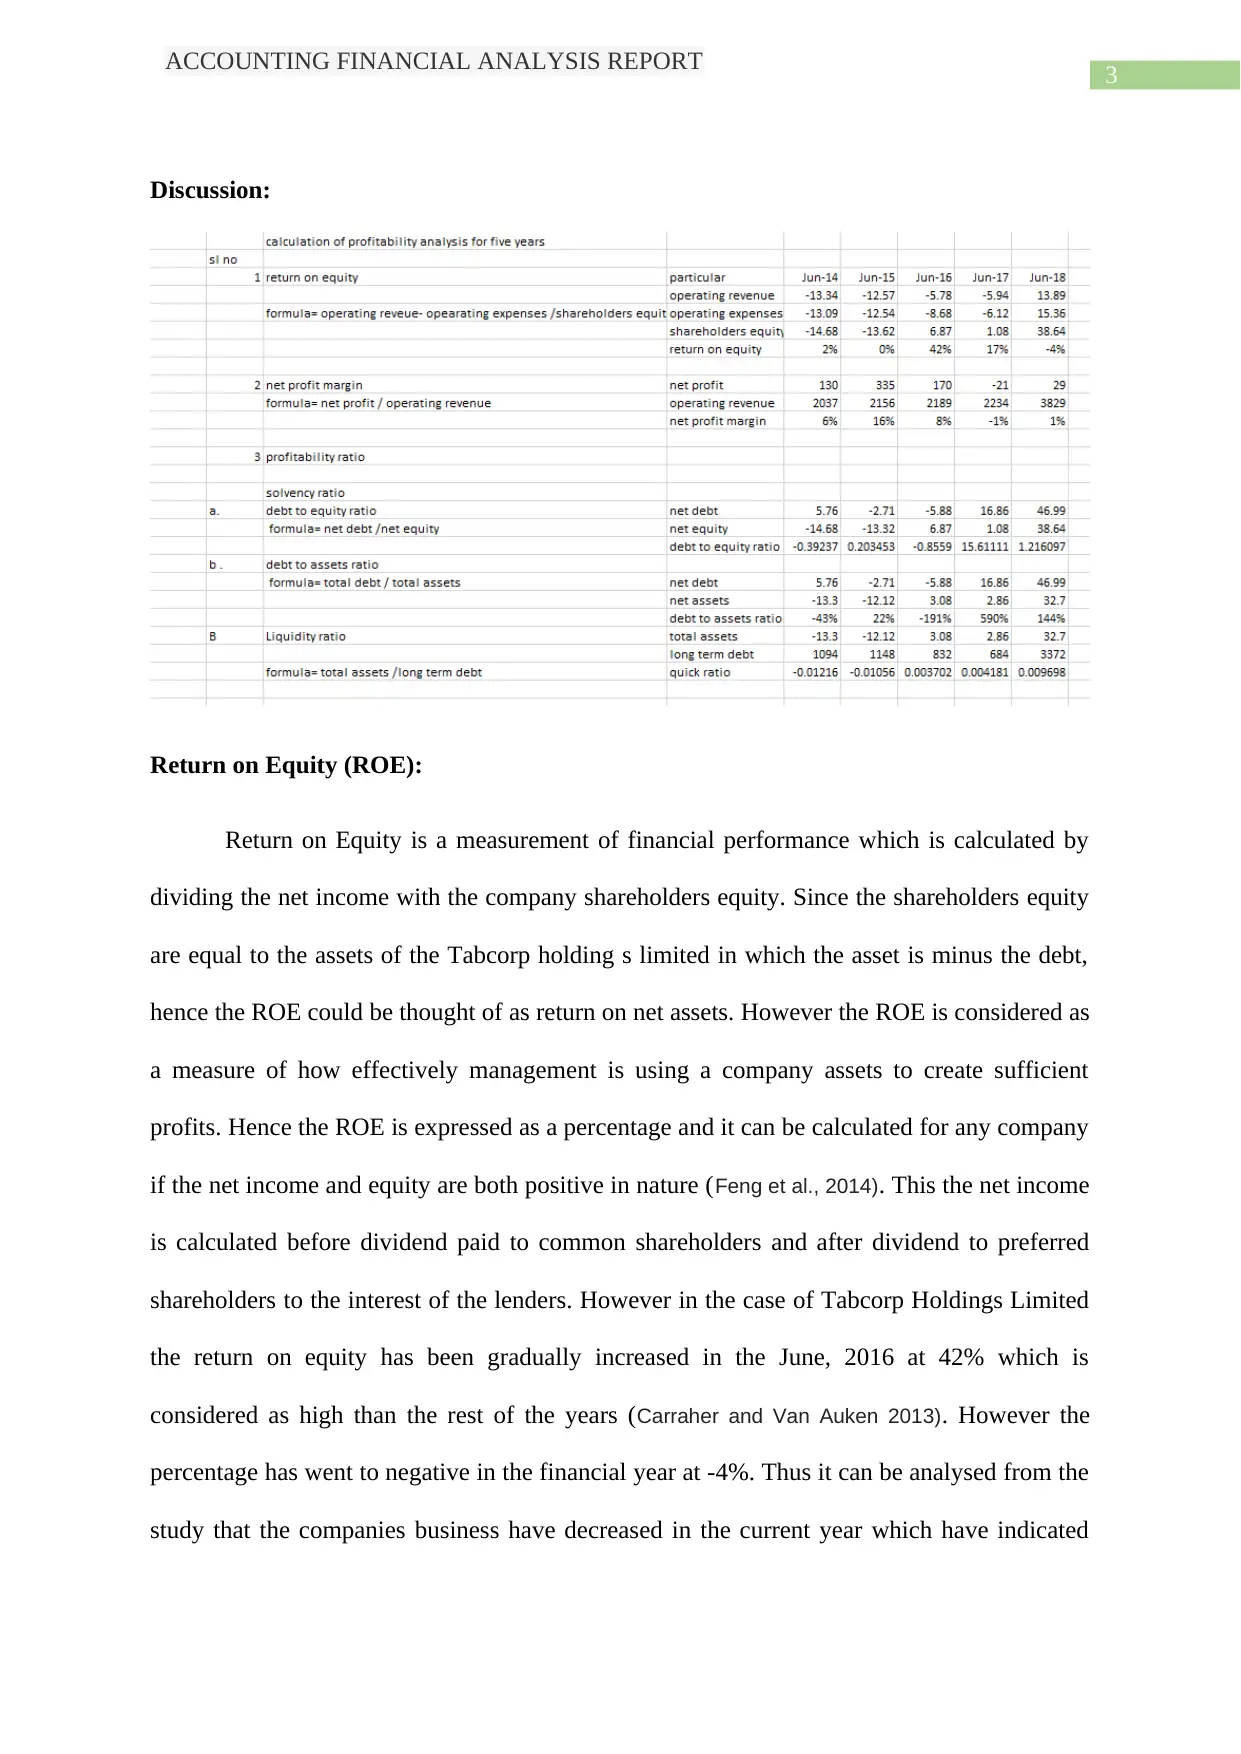
This report provides a financial analysis of Tabcorp Holdings Limited, evaluating its performance over a five-year period. The analysis focuses on key financial metrics, including Return on Equity (ROE), net profit margin, debt-to-equity ratio, debt-to-asset ratio, and liquidity ratios. The report examines the trends and implications of these ratios, offering insights into the company's profitability, financial leverage, and overall financial health. The discussion includes the calculation and interpretation of each ratio, highlighting the factors that influence the company's financial performance. The report also includes a review of relevant literature and concludes with a summary of the company's financial position. The report concludes with a discussion of the company's profitability ratios, highlighting its financial performance in comparison to the industry average.

Running head: ACCOUNTING FINANCIAL ANALYSIS REPORT
Accounting financial analysis report
Name of the Student
Name of the University
Author’s note
Accounting financial analysis report
Name of the Student
Name of the University
Author’s note
Paraphrase This Document
Need a fresh take? Get an instant paraphrase of this document with our AI Paraphraser

1
ACCOUNTING FINANCIAL ANALYSIS REPORT
Executive summary:
The topic deals with the financial reports of Tabcorp Holdings Limited and the
required calculations like return on equity, net profit margin and analysed the financial
position of the company for five years. Apart from this the company also focus on providing
the profitability ratio like debt to equity ratio, debt to assets ratio and liquidity ratio in order
to see the financial performance of the company.

2
ACCOUNTING FINANCIAL ANALYSIS REPORT
Table of Contents
Discussion:.................................................................................................................................3
References:.................................................................................................................................6
⊘ This is a preview!⊘
Do you want full access?
Subscribe today to unlock all pages.

Trusted by 1+ million students worldwide

3
ACCOUNTING FINANCIAL ANALYSIS REPORT
Discussion:
Return on Equity (ROE):
Return on Equity is a measurement of financial performance which is calculated by
dividing the net income with the company shareholders equity. Since the shareholders equity
are equal to the assets of the Tabcorp holding s limited in which the asset is minus the debt,
hence the ROE could be thought of as return on net assets. However the ROE is considered as
a measure of how effectively management is using a company assets to create sufficient
profits. Hence the ROE is expressed as a percentage and it can be calculated for any company
if the net income and equity are both positive in nature (Feng et al., 2014). This the net income
is calculated before dividend paid to common shareholders and after dividend to preferred
shareholders to the interest of the lenders. However in the case of Tabcorp Holdings Limited
the return on equity has been gradually increased in the June, 2016 at 42% which is
considered as high than the rest of the years (Carraher and Van Auken 2013). However the
percentage has went to negative in the financial year at -4%. Thus it can be analysed from the
study that the companies business have decreased in the current year which have indicated
Paraphrase This Document
Need a fresh take? Get an instant paraphrase of this document with our AI Paraphraser

4
ACCOUNTING FINANCIAL ANALYSIS REPORT
that the company’s business have decreased which caused less return in equity and hence it
could be a major concern to the company shareholders (Ongore and Kusa 2013).
Net profit margin:
The net profit margin tells on how much net income or profit is generated as a
percentage of revenue. Net profit margin is the ratio of net profit to the revenue for a
company or business segment. Hence the net profit margin is typically expressed as a
percentage but can also be represented in a decimal form. Hence the net profit margin is deals
with how much dollar is calculated based on each revenue collected by the company which
has been converted into profits (Haller and van Staden 2014). However it is seen from the
calculations of Tabcorp Holding that the net profit margin of the company increased for the
first 3 years and then decreased in the fourth year. However the rate have been increased in
the fifth year which indicates that different business issues and internal changes caused the
company’s profitability and hence the net profit margin was variable (Kim et al.,2013).
Debt to equity ratio:
It is calculated by dividing the total liabilities by the company shareholders equity.
Hence these numbers are available on the company balance sheet and the financial
statements. However the ratios are used to evaluate the financial leverage of the company and
it is expected in the corporate finance. Hence it is measured to the degree at which the
company is financing the operations through debt and own funds. Hence it reflects the ability
of the shareholder equity to cover all the outstanding expenses in the business. From the
calculation it is seen that the company have highest debt equity value at 15.11:1 which is
higher than the previous years. Hence it can be said that the company had paid off all the
debts in the financial year which indicates that the company had well maintained debts and
paid off to the equity shareholders (Altman et al.,2017). Similarly from the debt to asset ratio it

5
ACCOUNTING FINANCIAL ANALYSIS REPORT
can be said that company had purchased new assets for the company in the year 2017 (Delen ,
Kuzey and Uyar 2013). Hence the business valuation had increased in the financial year. Lastly
the quick ratio describe the valuation of the company which is limited at 2:1. However from
the calculation it is seen that the companies liquid ratio for the last five years are calculated at
less than 2:1 which indicates that the company could improve the liquidity ratio in the near
future since it is not up to the mark for the company (Robinson et al.,2015).
Profitability ratio:
These ratios are the class of financial metrics used to assess the business ability to generate
the earnings related of the revenue, operating costs, balance sheet assets and the shareholders
equity over time by using some specific data related to the job. These can tell that how well
the company is using their existing assets to generate the value of profit and revenue for the
company shareholders. However the higher ratios are often more favourite and can provide
much more information relating to the results than the other companies like the companies
historical performance and company industrial average. However increase in the company
profitability ratio indicates that the company is doing well. Hence the ratios are most
informative and useful while it issued to compare a subject company to other, however the
companies own history, average ratios for the company as a whole. However in case of
TABCORP holdings limited it is seen from the calculations that the company had only
suffered a loss in the year 2017. Other than that the company have managed to maintain a
good amount of profitability. It is also seen that the company have secured most of the profit
in year 2015 with 16%. Hence these indicate that the company have well maintained
profitability in all the five years which is a clear indication that they are doing well in the
market. Thus it is a positive sign for the company shareholders.
⊘ This is a preview!⊘
Do you want full access?
Subscribe today to unlock all pages.

Trusted by 1+ million students worldwide

6
ACCOUNTING FINANCIAL ANALYSIS REPORT
References:
Altman, E. I., Iwanicz‐Drozdowska, M., Laitinen, E. K., & Suvas, A. (2017). Financial
distress prediction in an international context: A review and empirical analysis of
Altman's Z‐score model. Journal of International Financial Management &
Accounting, 28(2), 131-171.
Carraher, S., & Van Auken, H. (2013). The use of financial statements for decision making
by small firms. Journal of Small Business & Entrepreneurship, 26(3), 323-336.
Delen, D., Kuzey, C., & Uyar, A. (2013). Measuring firm performance using financial ratios:
A decision tree approach. Expert Systems with Applications, 40(10), 3970-3983.
Feng, M., Li, C., McVay, S. E., & Skaife, H. (2014). Does ineffective internal control over
financial reporting affect a firm's operations? Evidence from firms' inventory
management. The Accounting Review, 90(2), 529-557.
Haller, A., & van Staden, C. (2014). The value added statement–an appropriate instrument
for Integrated Reporting. Accounting, Auditing & Accountability Journal, 27(7),
1190-1216.
Kim, S., Kraft, P., & Ryan, S. G. (2013). Financial statement comparability and credit
risk. Review of Accounting Studies, 18(3), 783-823.
Ongore, V. O., & Kusa, G. B. (2013). Determinants of financial performance of commercial
banks in Kenya. International journal of economics and financial issues, 3(1), 237-
252.
Robinson, T. R., Henry, E., Pirie, W. L., & Broihahn, M. A. (2015). International financial
statement analysis. John Wiley & Sons.
1 out of 7
Related Documents

Your All-in-One AI-Powered Toolkit for Academic Success.
+13062052269
info@desklib.com
Available 24*7 on WhatsApp / Email
Unlock your academic potential
Copyright © 2020–2025 A2Z Services. All Rights Reserved. Developed and managed by ZUCOL.